Automated

This time, you will use the spectrum analyzer to automatically apply a range of sinusoidal inputs to the motor. The magnitude and phase will be computed automatically.

Procedure

  1. Connect the spectrum analyzer.
    Turn off the power supply, oscilloscope, and fcn. gen., and turn on the spectrum analyzer.
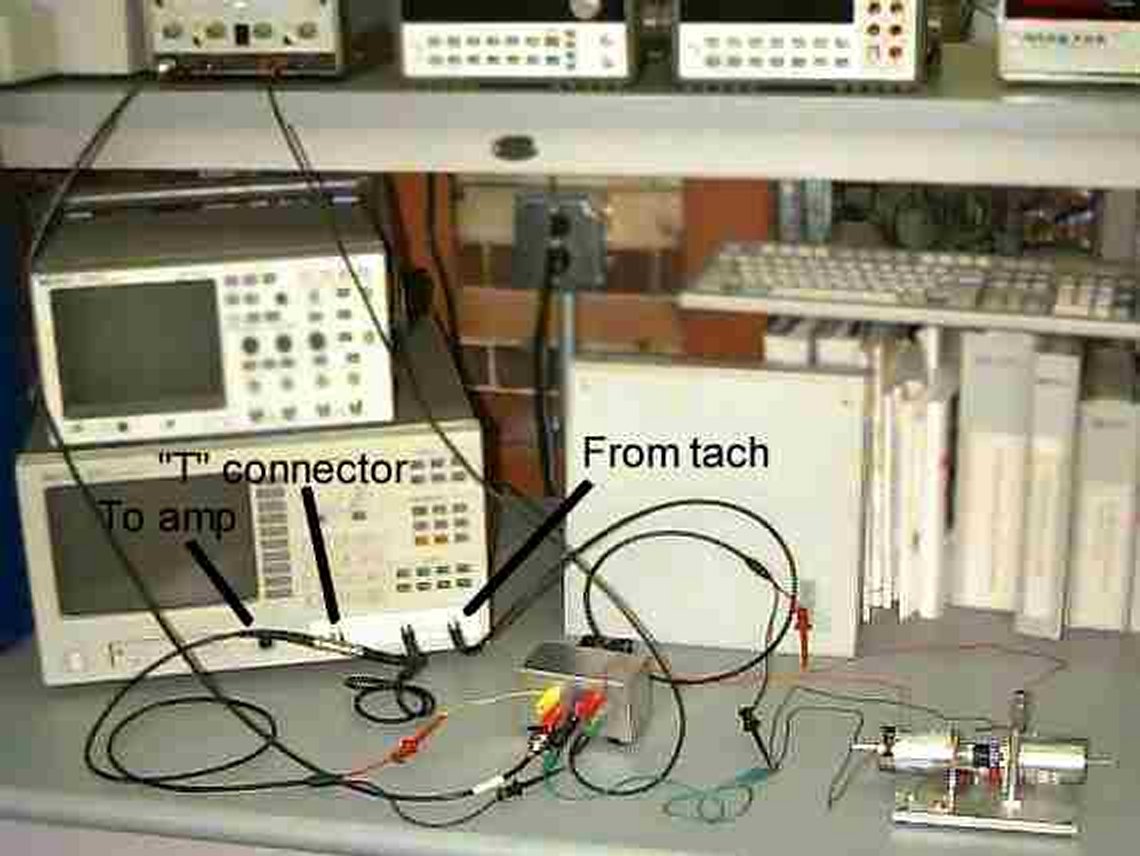
    Attach a "T" connector to the output of the spectrum analyzer.
    Connect one side of the "T" connector to input 1 of the spectrum analyzer with a co-ax cable. This allows the spectrum analyzer to read it's own output.
    Detach the co-ax/pigtail cable from the fcn. gen. and connect it to the free end of the "T" connector on the spectrum analyzer output.
    Detach the co-ax cable from the input 2 of the oscilloscope and attach it to input 2 of the spectrum analyzer.

    Click to Enlarge

  2. Run automated frequency analysis.
    Press Inst Mode button.
    Select Swept Sine.
    Press Freq button.
    Set Start to 0.2Hz.
    Set Stop to 100Hz.
    Set Sweep to AUTO, LIN, and UP.
    Select Res. Setup.
    Set Auto Res. to ON.
    Set Min Res to 101 pts/sweep.
    Set Max % change to 2.5%.
    Press Source button.
    Set Level to 200mVpk
    Press Scale button.
    Set Autoscale to ON.
    Turn on power supply.
    Press Start button.
    Motor will begin to oscillate back and forth. The frequency will gradually increase (it spends more time at lower frequencies). The whole process takes several minutes. Wait until the analysis is complete.
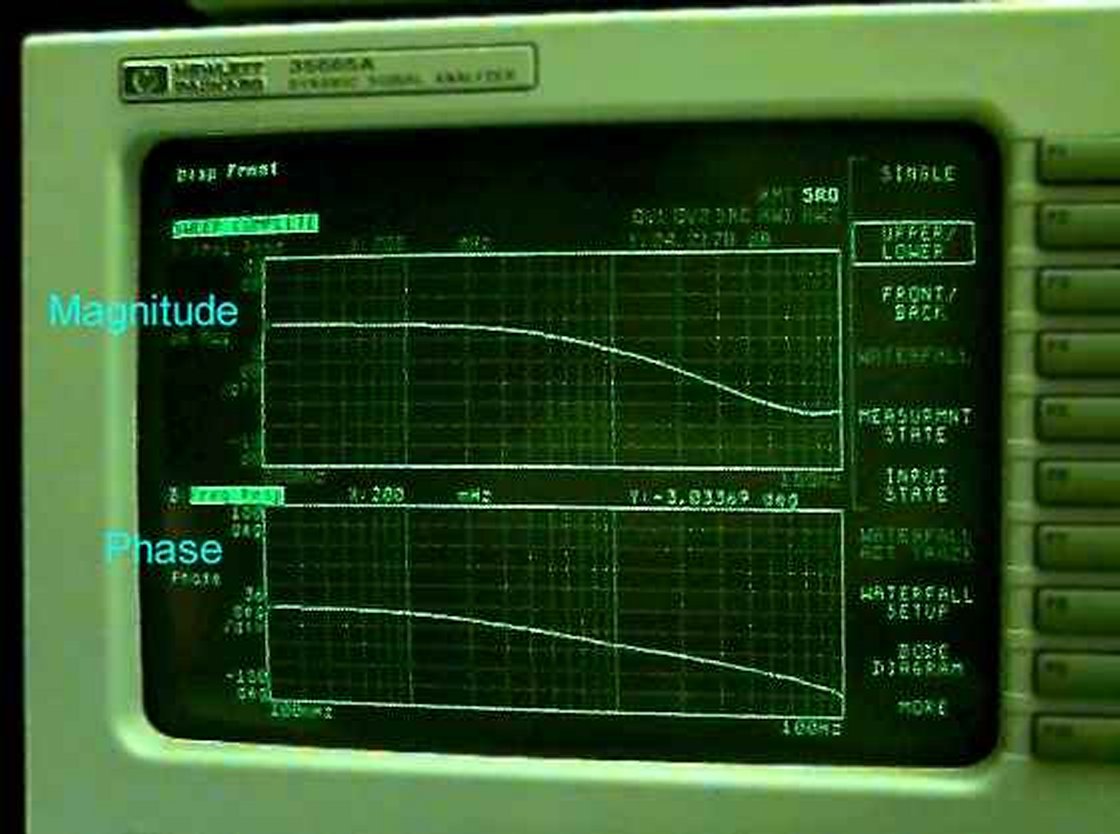
    Press Disp Format button.

    Select Bode Diagram. Click to Enlarge

    Print this screen.
    If you have time, repeat the analysis between frequencies of 1Hz and 1000Hz.

Writeup

The lab writeup is due on the Tuesday 10 February. Writeups can be turned in jointly or individually. Your lab writeup should include the following information. Be sure to justify all of your comments.

  1. Amplifier Identification
    1. Plot the output of the amplifier vs. the input. Draw a straight line representing the linear portion of the graph.
    2. From either the slope of this line, or from an average of the data points, calculate the amplifier's gain, Ka.
    3. Describe and explain the behavior at large positive and negative voltages. How might this affect a control system using this amplifier?
  2. Motor step response Even though the motor was moving between two non-zero speeds, we can shift the datum so that the low speed input and output are both considered zero, and the difference between the low and high speeds is the size of the response.
    1. For the given transfer function of the motor with a step input of the magnitude used in lab, calculate the following in terms of K, Ka and t. Remember that the input voltage gets multiplied by the amplifier gain before it is applied to the motor.
      The final value of the output.
      The time it takes to reach 95% of the final value.
      The initial slope of the graph after the step.
      The location where the initial slope line intersects the final value line.
    2. Using these results, compute K from the final value, and t from both the 95% settling time and the initial slope/final value intersection. How do the two estimates of t compare? Which do you think is more accurate, and why?
    3. Write the transfer function of the motor-plus-amplifier system substituting in the numbers you obtained.
  3. Motor frequency response
    1. Compute the remaining entries of the data table. Magnitude in dB is 20 times the log (base 10) of (output amplitude/input amplitude). Phase is 360 degrees * (delay time/input period).
    2. Generate a pair of Bode plots for this system.
      Using the manual data, plot Magnitude (in dB) vs. frequency, with frequency in rad/s on a log scale.
      Also plot Phase Angle vs. frequency, with frequency in rad/s on a log scale.
      Using the bode command in Matlab, plot these same plots using the transfer function obtained in the step response portion of the lab.
      Compare the frequency plots from Matlab, from the manual experiment, and from the automated experiment both qualitatively and quantitatively. Remember that the automatically generated plots are plotted with frequency in Hz, not rad/s. How closely do they match? Are there any extra features in the experimental plots? If so, explain why there may be extra features.
      How might these high-frequency artifacts effect a control system?
      If you generated an automated plot over higher frequencies, describe what is happening at higher frequencies.
    3. Estimate the motor's DC gain, K, from the experimental bode plots (do this for both manual and automatic plots.)
      The magnitude (in dB) at low frequencies is equal to 20*log(K*Ka). from this, calculate K.
      Compare this to the step response result.
    4. Estimate the time constant, t from the experimental bode plots. (do this for both manual and automatic plots.
      Fit a -20dB/decade sloped line to the downward-sloping portion of the magnitude plot. Mark a horizontal line at the magnitude where the low frequency magnitude lies. The frequency where these two lines cross is called the break frequency. What is this frequency?
      Compute the time constant as the reciprocal of the break frequency (in rad/s).
      How does this compare to the step response result?


Up ] Identity Amplifier ] Motor Step Response ] Motor Frequency Response ] [ Automation & Writeup ]