| Set the function generator to sinusoidal waveform. | |
| Set the frequency to 0.2Hz | |
| Set the time scale on the oscilloscope so that one or two full periods of the sinusoid are on the screen. | |
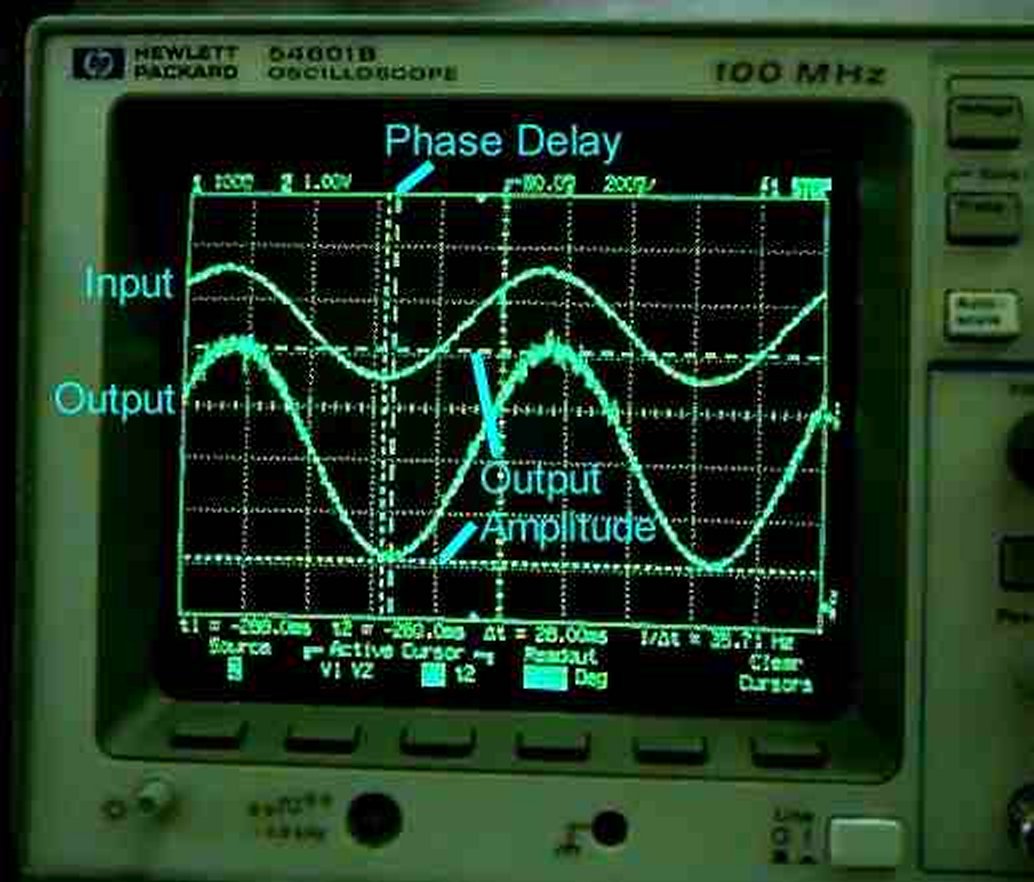
| Use the cursors to measure the output amplitude. | |
| Use the time cursors to measure the time difference between a valley of the input sinusoid and the closest valley of the output sinusoid. | |
Output will appear as shown below. | |
| Print this screen. |
Take the data in the following (just amplitude and delay),
adjusting the input frequency and the time scale on the oscilloscope as
appropriate. Print at least one more screen at a higher frequency, such
as 10 or 20Hz as shown below. 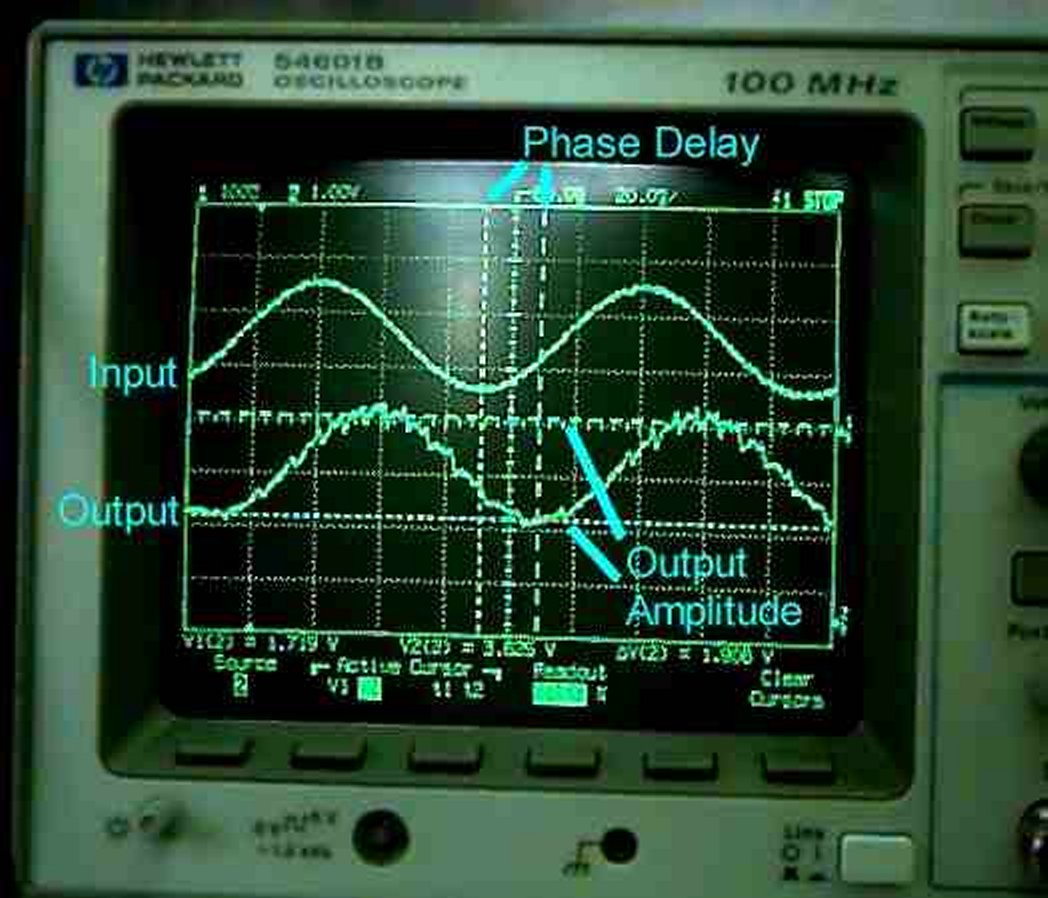
| Freq. | Output Amplitude |
Delay |
|
Phase | ||||||
|---|---|---|---|---|---|---|---|---|---|---|
| 0.2Hz | ||||||||||
| 0.3Hz | ||||||||||
| 0.5Hz | ||||||||||
| 1Hz | ||||||||||
| 2Hz | ||||||||||
| 3Hz | ||||||||||
| 5Hz | ||||||||||
| 10Hz | ||||||||||
| 20Hz | ||||||||||
| 30Hz | ||||||||||
| 50Hz | ||||||||||
| 100Hz | ||||||||||
| 200Hz |