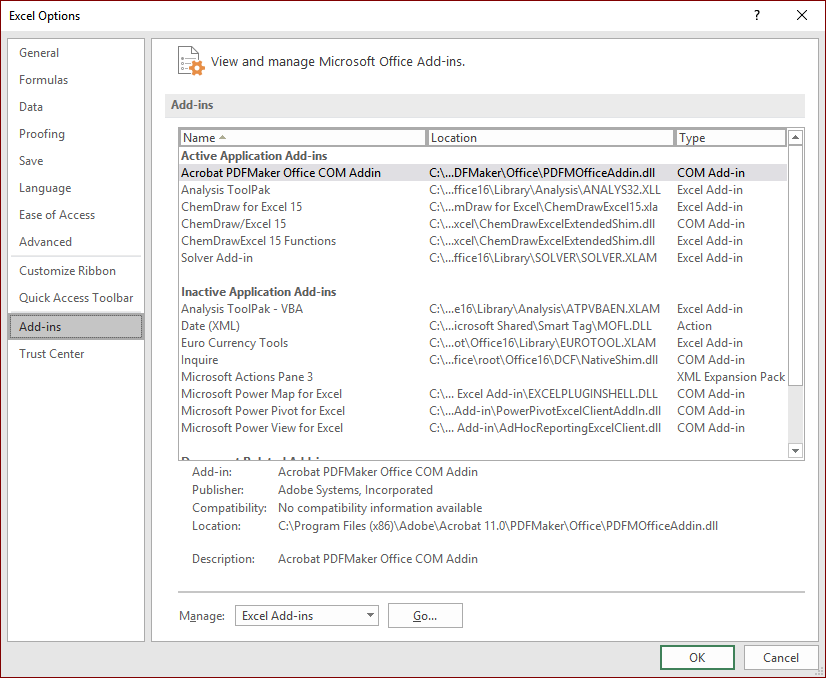
1. You will have to turn on Solver in your version of Excel:
a) Select the file tab, and click on options.
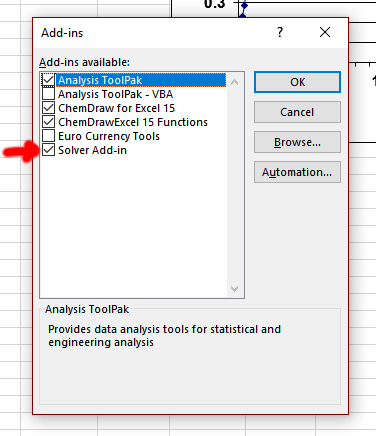
b) Select Add-ins, and then under "Manage:" select Excell Add-ins, and click on "Go.."
c) Click the box marked "Solver Add-in"
2. Set-up the spread sheet.
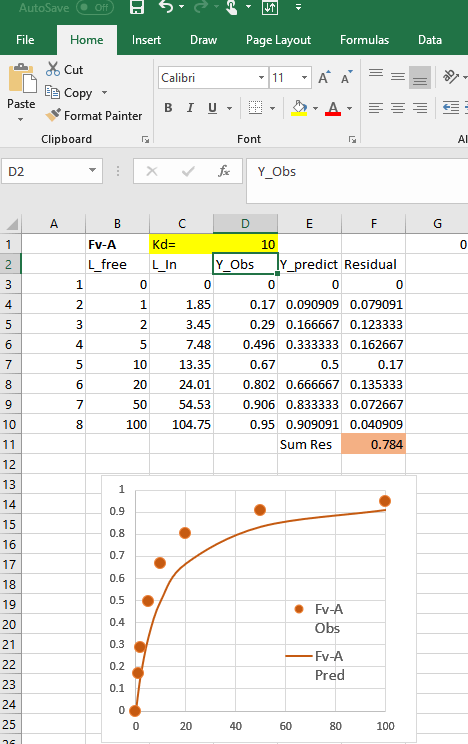
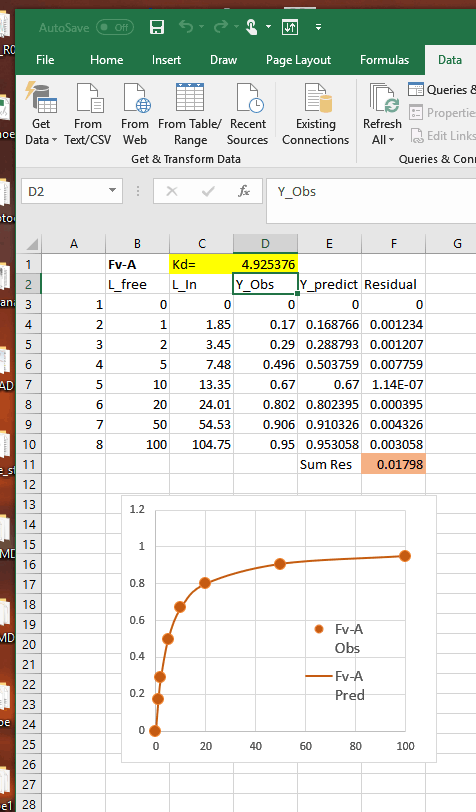
a) You will need one column of observed data (Column D)
b) You will need one column of predicted data, calculated using parameters that are contained in one or more cells. For example, if you are fitting binding data, you would calculate Y=[L]/(Kd+[L]) (column E), where Kd is contained in a cell (D1)
c) You will need to calculate the absolute values of the difference between the observed and predicted data for each data point (column F).
d) You will need to sum the differences (cell F11), solver will vary the parameter(s) of the model to minimize the sum of the differences.
3. Run Solver
a) You open solver by clicking on the "Data" tab at the top of the Excel screen and then selecting "Solver" on the far right.
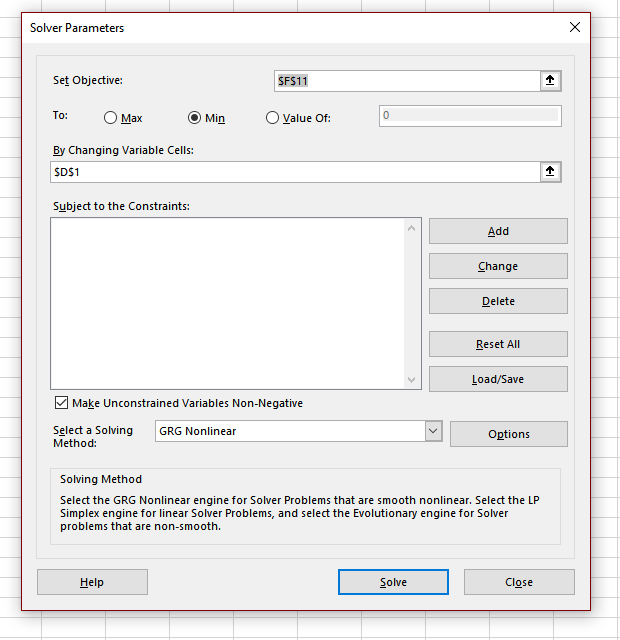
b) You need to Set the Objective to the cell that contains the sum of the residuals, $F$11 in this example.
c) You need to tell solver what parameters to change by entering them into the "By Changing Variable Cells:". In this case there is only one parameter (Kd) which is cell $D$1. For more complex models additional parameters can be added, separated by commas.
d) Check to make sure "Min" is checked.
e) Select GRG Nonlinear (other options are available)
f) Click "Solve"
Solver will find the value(s) of the parameter(s) that minimize the difference between the observed and predicted data. Note that the fit usually depends on the value of the initial guess. You may need to try different initial guesses.
You can download the spreadsheet that was used in this example:
Spreadsheet