Carnegie Mellon University
Department of Mechanical Engineering
24-352 Dynamic Systems and Control
Spring 2001
Lab 2 - Frequency Response
![]()
Overview
The objective of this laboratory is for you to analyze the frequency response of a first-order dynamic system, in this case, a filter circuit. You will learn how to measure the amplitude and phase of a frequency response function (FRF), also known as a transfer function, and to develop a physical feel for what FRF's mean.
Part I: Theory
Frequency Response Functions (FRF) have the interpretation of being the response amplitude as a function of driving frequency.
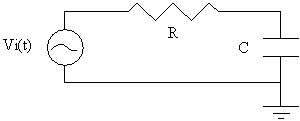
The simple circuit you will be analyzing is shown below. Its behavior is defined by the time constant t = RC:

From the standpoint of frequency response, we are interested in the steady state behavior when the input is sinusoidal
![]()
The amplitude and phase of the Frequency Response Function (FRF) when it is measured across the capacitor,
![]()
f = - ArcTan (wRC)
You can find the derivation of above relations in Appendix
Assignment:
1. Prepare the Amplitude (Vout/Vin) versus frequency (f) and Phase (f) versus frequency (f) plots. These are called Bode Plots. You will compare these plots to the experimentally obtained Bode plots, for this reason please pay attention to the following points;
2. Derive expressions for the amplitude and phase of the Frequency Response Function (FRF) when output voltage, Vout is measured across the resistor, instead of the capacitor as above. Hand in your solution with the lab report, and include it as part of the analysis section.
3. Plot the amplitude and phase expressions obtained in Question#2 by following the same instructions given in Question#1.
Submit your answers to these questions with the lab
repost, as a part of Analysis section
Part II: Measurement
1. You will need the following equipments: oscilloscope, spectrum analyzer, function generator, multimeter, printer, BNC cable, T-connector, BNC-clip cables, protoboard, a resistor, and a capacitor.
2. Using the multimeter, measure and record the resistor's value.
3. Build the simple circuit on the prototyping board, using the resistor, capacitor. Refer to the white board in the lab to see how to make common connections on the protoboard. After building the circuit make the following connections;
4. Although you can estimate the time constant from the values of R and C, we don't know C precisely. Further, there are additional sources of resistance in the probes and circuit connections. Hence, you will directly measure the circuit's time constant. Drive the circuit with a square wave input, with the square wave having a frequency of 50Hz and peak to peak amplitude of 2V. (Note: to set 2Vpp, you need to enter 1Vpp on function generator. The input to the circuit is on Channel 1 and output voltage across the capacitor is on Channel 2.
5. Switch the input to a sine wave, do not change the input amplitude. You will drive the circuit at three different frequencies: one well-below the cut-off frequency (20Hz), one near the cut-off frequency (200Hz), and one well-above the cut-off frequency (2000Hz). The objective here is to see, in the time domain on the scope, the amplitude and phase shifts that occur in the circuit's response at each of these frequencies. Start with 20Hz frequency Sine wave, display the input and output signals on the scope, measure the output amplitude and phase shift. In measuring phase shift, make sure that you set 360 degrees correctly, repeat this setting for each frequency. Make a hardcopy plot of this screen to be included in your report. Then repeat the measurements for 200Hz and 2000Hz, and print these screens too.
6. Now, you will generate Bode plot using the spectrum analyzer.
7. This time you will prepare the Bode plot when the output is measured across the resistor.
Part III: Laboratory Report
1. Determine the time constant of the circuit in following ways;
![]()
Plot the logarithm of the measured voltage values versus time. From a linear fit to the data, determine the time constant.
2. Prepare a table to compare amplitude and phase values for the three frequencies (20Hz, 200Hz, 2000Hz). In this table, list the results obtained in step 5, step 6 and predicted (numerically calculated) values. Keep in mind that amplitudes in Bode plot are in terms of Vout/Vin. Hence, the results of Step 5 (Vout measurement) should be divided to Vin to be able to compare them on the same ground. Also, are all the results same, answer both qualitatively and quantitatively, is there any difference, if so what is it and why?
3. Discuss the differences between the transfer functions in part 6 and 7, and compare them with those predicted theoretically. Basically discuss the manner in which these two filters (output across the capacitor, or across the resistor) alter an input signal with a range of frequencies.
![]()