Example (logit.sas): fitting a logistic (LOGIT) model.
This example uses data from 195 subjects in a prospective longitudinal survey. Offense convictions were recorded annually for boys from age 8 through age 32 (1 = 1 or more convictions, 0 = no convictions). The analyrogram 1 (below). The resulting output and graphs follow.
SAS program: offense
logistic model, cubic trajectories.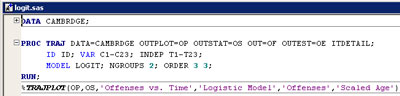
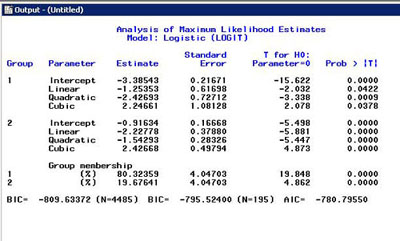
Output 1: Two-group logistic model results.
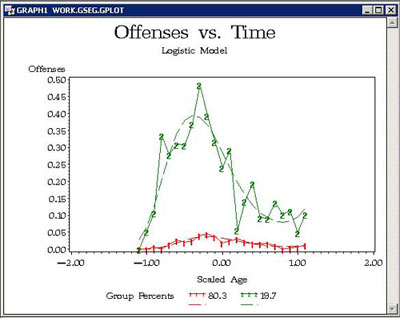
Graph 1: Average data (solid line) and mean (dashed line) trajectories.
The highest order coefficients for each group are significant (p=0.0378, p<0.00005). The resulting model looks satisfactory, so risk factors are added without using start values.
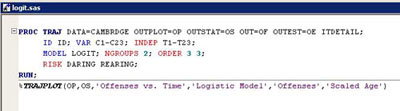
Program 2: Two-group logistic model, cubic trajectories with risk factors.
Output 2: Two-group model results with risk factors.
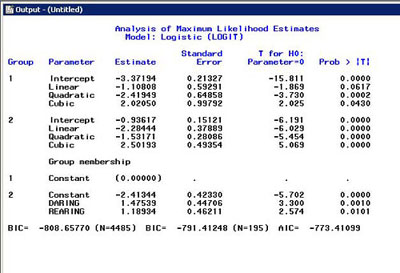
Daring and rearing are 0/1 variables. Daring is 1 for high levels of daring behavior observed in the subject. Rearing is 1 for high levels of poor rearing practices by the parents. The results show that both high levels of daring behavior (p=0.001) and poor rearing (p=0.0101) increase the likelihood of belonging in the second group of higher offending. (logit.sas)