Example (cnorm.sas): fitting a censored normal (CNORM) model.
This example uses opposition data on 138 subjects from the Montreal Longitudinal Study. Teachers assessed these students annually at ages 6 and 10-15 on an opposition scale ranging from 0 to 10. The program below shows how to fit a 3 group model with all cubic trajectories to the data. Output and graphs follow.
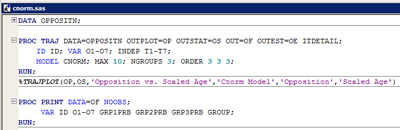
SAS program: oppositional behavior trajectory model.
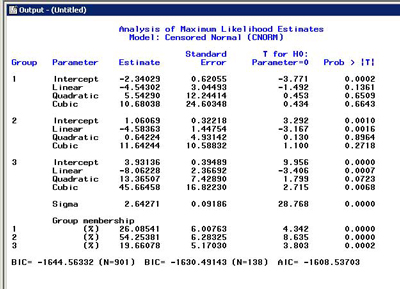
CNORM trajectory model results for oppositional behavior.
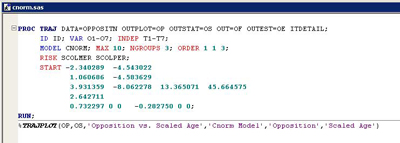
Next, RISK factors that influence the probability of belonging to a group are included. SCOLMER and SCOLPER contain measures of the amount of schooling completed by the mother and father.
SAS program: oppositional behavior trajectory model with risk factors.
CNORM trajectory model results for oppositional behavior with risk factors.
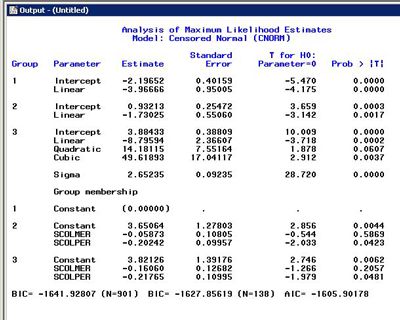
Father's schooling, (SCOLPER) p = 0.042, 0.048, appears to have a predictive effect on trajectory group but not mother's schooling, (SCOLMER) p = 0.59, 0.21. The negative sign on the effect estimates indicates that the effect is protective, with subjects where father's schooling was higher show decreased likelihood of higher oppositional behavior patterns. (cnorm.sas)