| Project
2
Postprocessing
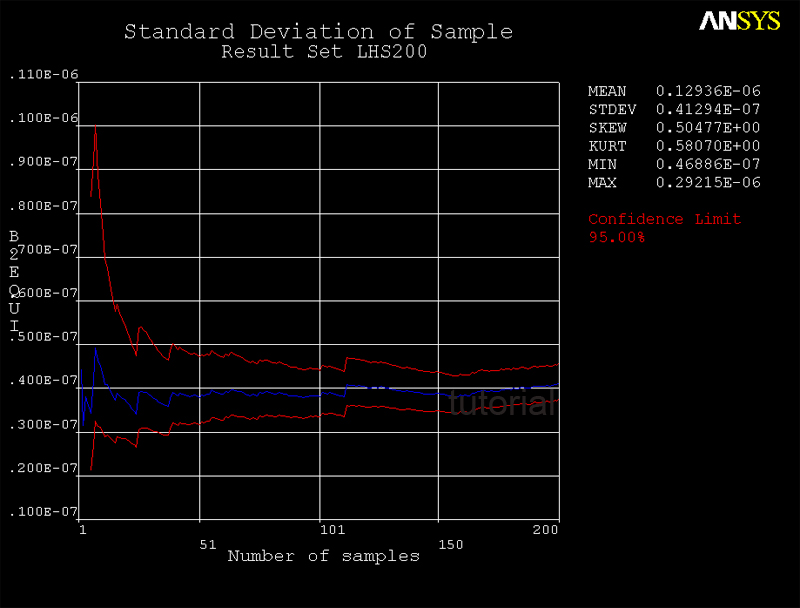
1) Mean Value and Standard Deviation of b2
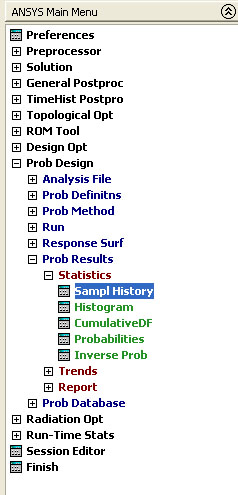
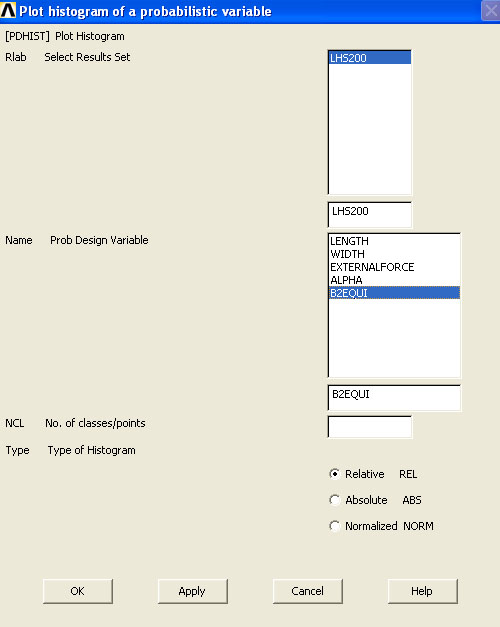
Choose the variable B2EQUI to be plotted.
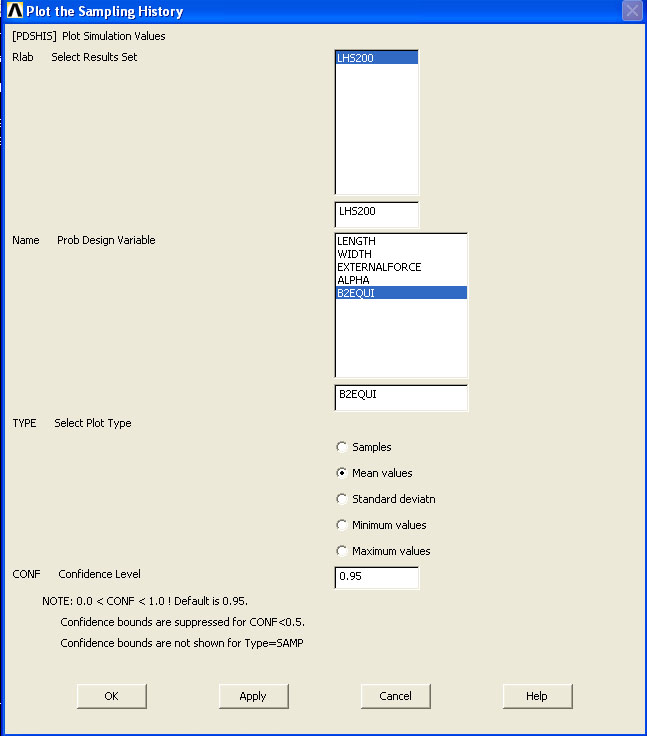
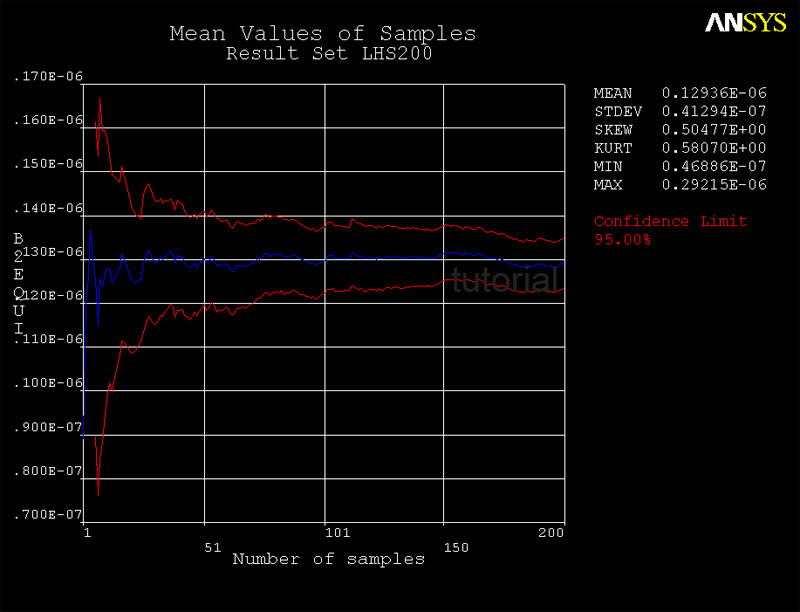
We can see that this graph shows the mean value
of b2 is about 0.129E-6.
Now click on sampl history
to plot SD. (We just plotted mean values of b2)
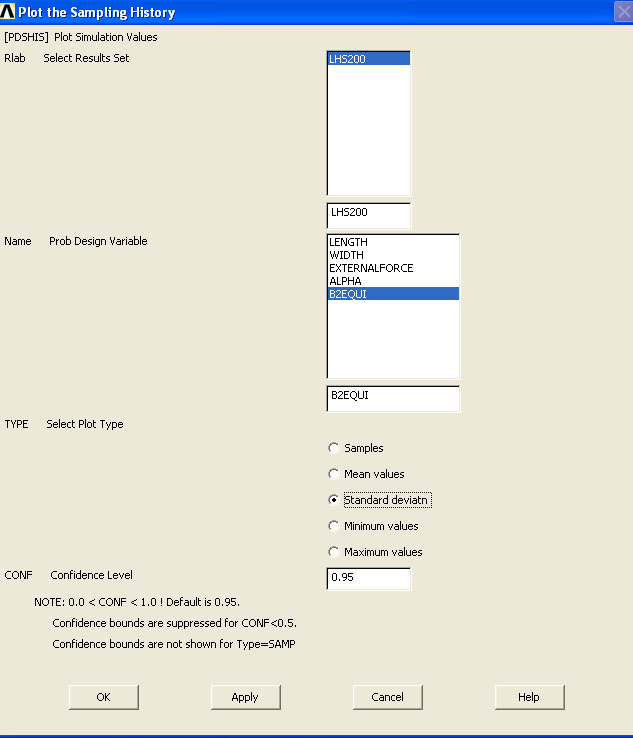
SD is about 0.413E-7.
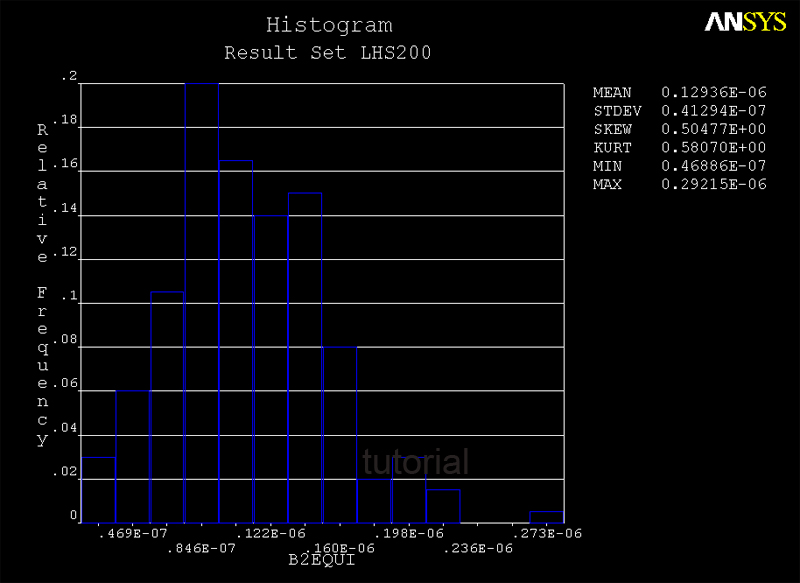
2) Histogram Plot of b2
Select b2 to be plotted.
Here is the histogram of b2 and its corresponding frequency.
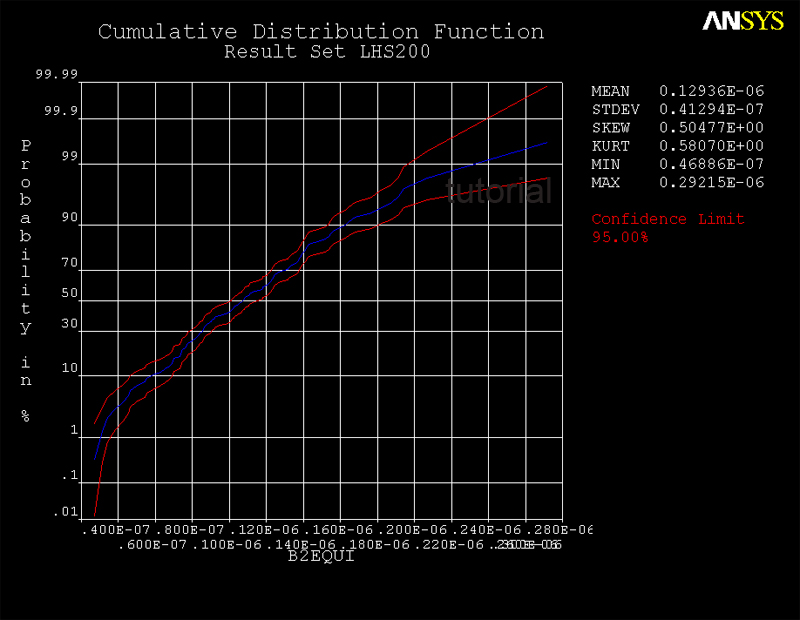
3) Cumulative Distribution
Function of b2
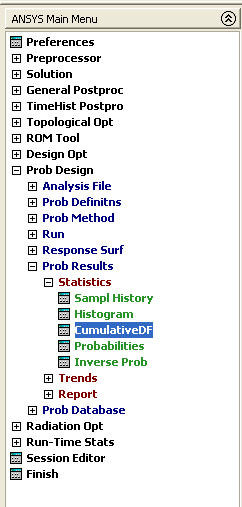
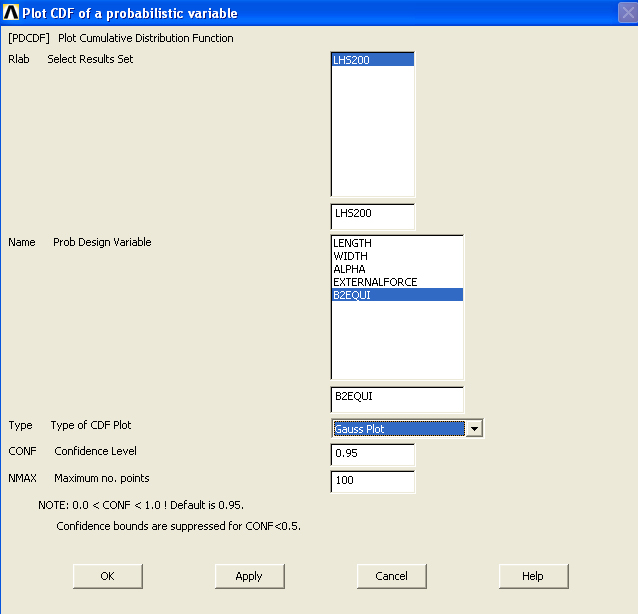
Make a gauss plot of b2.
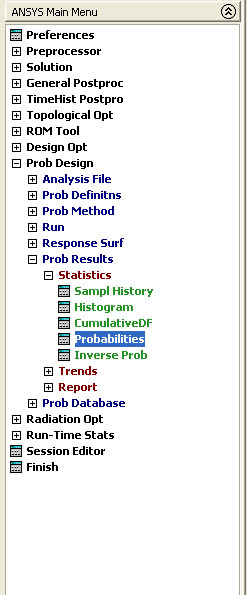
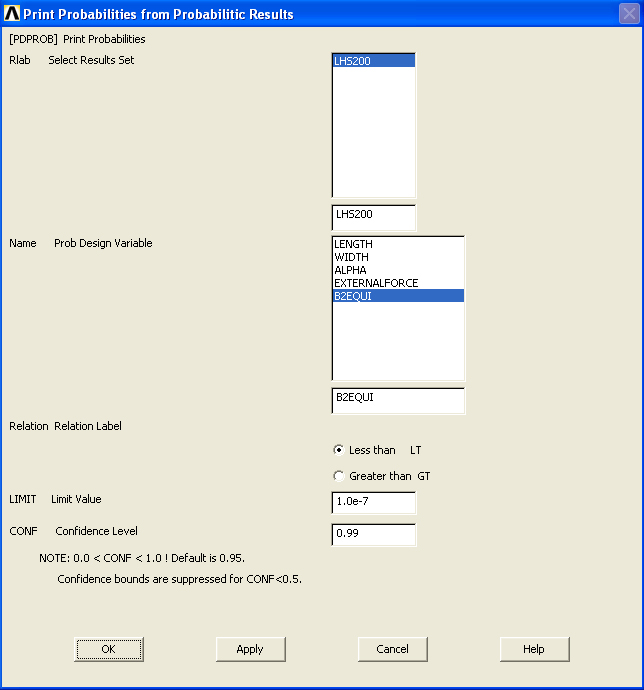
4) Outputing probabilistic results
-- Determine the probability that b2 is less than 1.0E-7
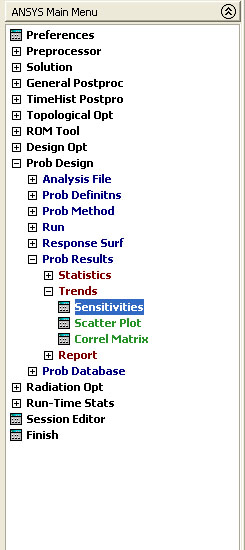
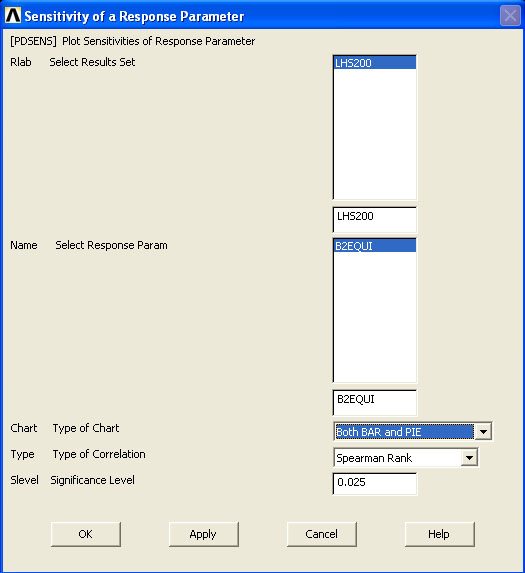
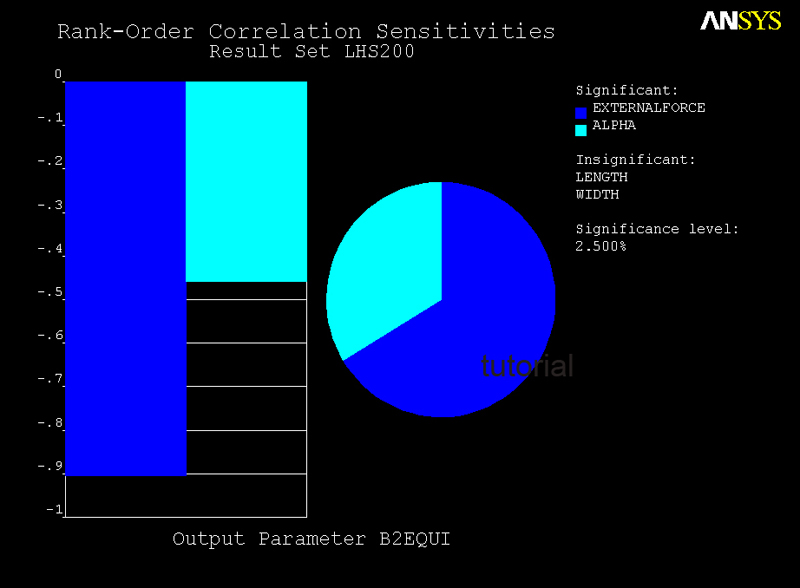
5) Sensitivity Plot
-- Determine how sensitive b2 is to the change in external force as compared to the change in alpha
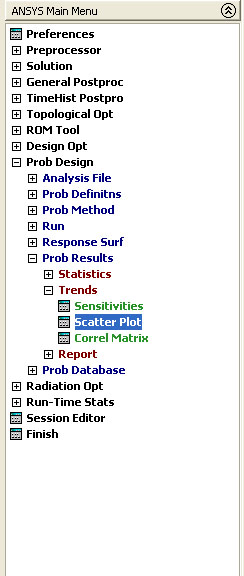
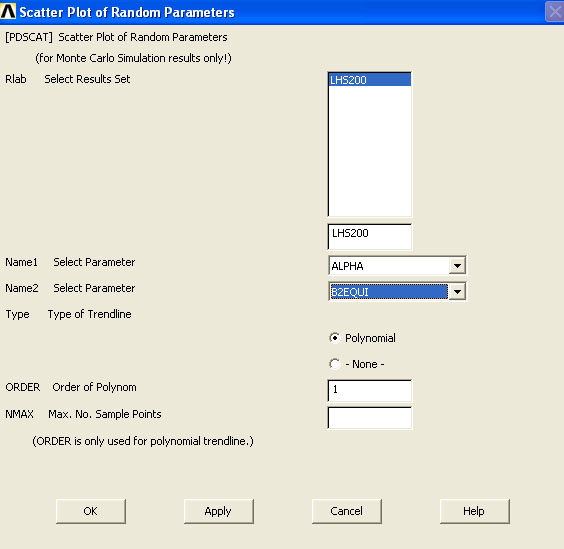
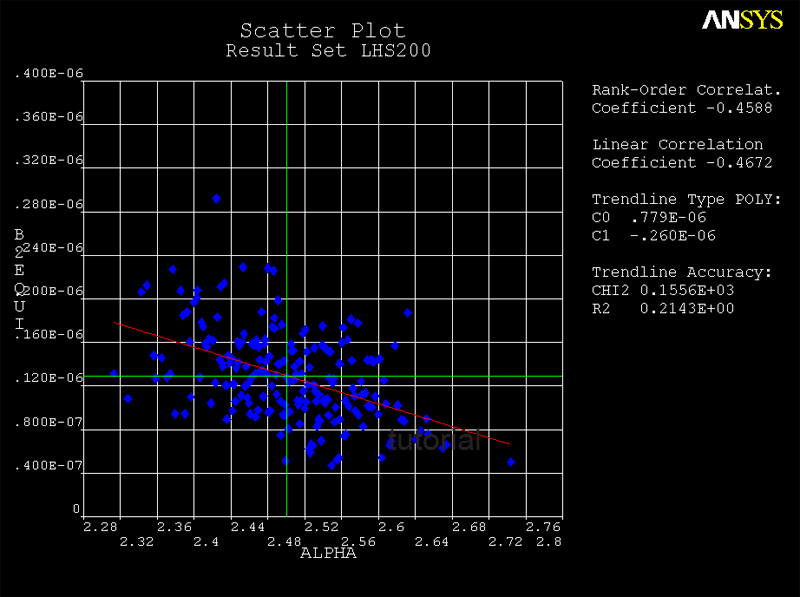
6) Scatter Plot of b2 As a Function of Alpha
|