[5 points]
In the file portrait.py, write a function portrait() that draws an abstract portrait of you on a canvas of size 300 X 400. We should be able to identify a face, at the very least. You must use
- at least one rectangle, one circle and one polygon in your portrait, although we expect you'll need a few more.
- write your name by creating a text on the canvas.
Hint:
1. you can write additional functions to draw something repetedly in order to create some visual patterns.
2. you can randomize different parameters such as outline color, fill color, width of the borders etc.
[5 points]
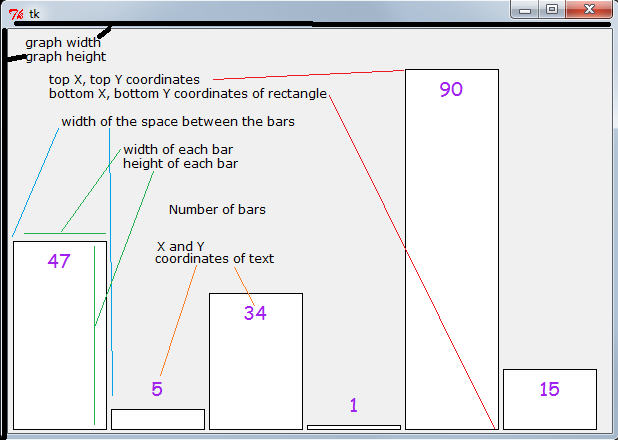
In the file bargraph.py, write a function bargraph(data_List, graph_Width, graph_Height) that takes a list of data values and displays a bar graph of these data values. The bar graph should be displayed in a canvas of the given size (graph_Width x graph_Height), and each bar should have an equal width which should be calculated according to the number of items in the list. The bottom of each bar must be anchored at the bottom of the canvas, and the height of the bar must be proportional to the data value being displayed, with the maximum height representing 100. Each of the data values is guaranteed to be in the range 1 to 100 inclusive. As shown in the sample outputs below, data values should be displayed in the graph as text and there should be a fixed space (e.g. 5 pixel) between the bars.
A few sample outputs:
>>> sampleList1= [50, 38, 47, 22, 34, 95, 28, 21, 64, 95, 78, 28, 95] >>> bargraph(sampleList1, 600, 400) 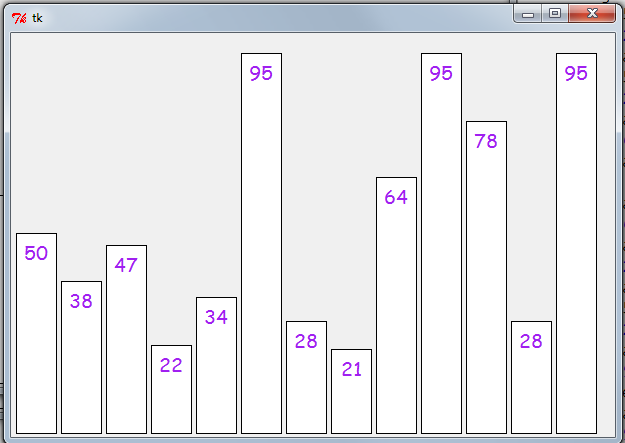
|
>>> bargraph(sampleList1, 300, 200) 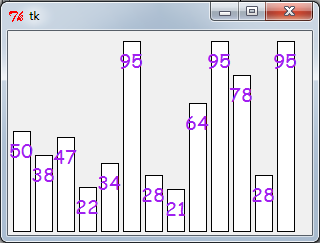
|
>>> sampleList2= [47, 22, 34, 95] >>> bargraph(sampleList2, 600, 400) 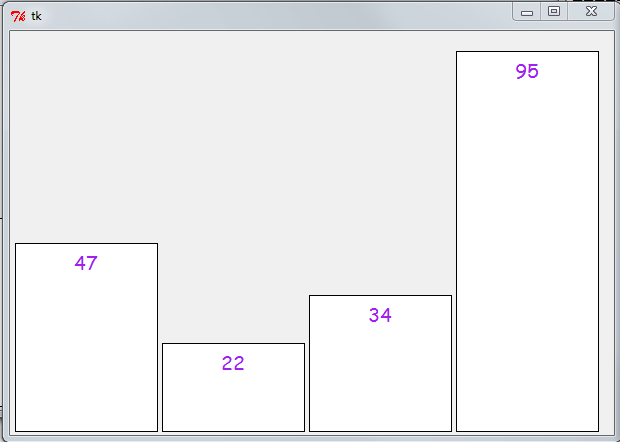
|
>>> bargraph(sampleList2, 400, 400) 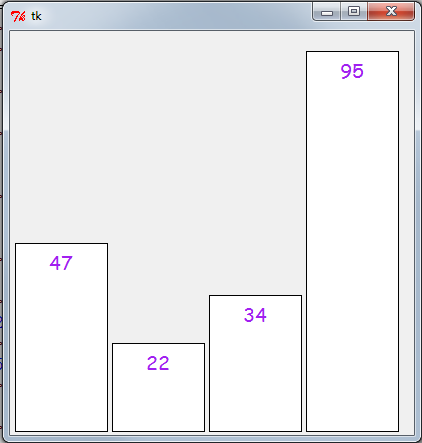
|
Think about the parameters and variables that you will need.
font=("Comic Sans MS", 14), fill="purple")
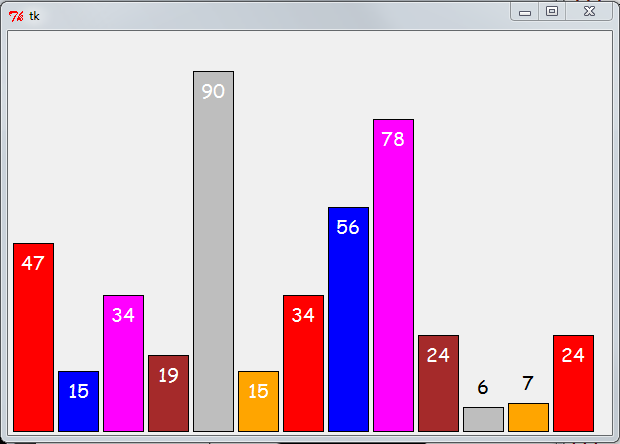
OPTIONAL (save it as bargraph2): Note that if the data was [47, 5, 34, 1, 90, 15], then the text for 5 and 1 is not seen. Just for such data can you add something to your code so that they are placed on the bar as shown below.
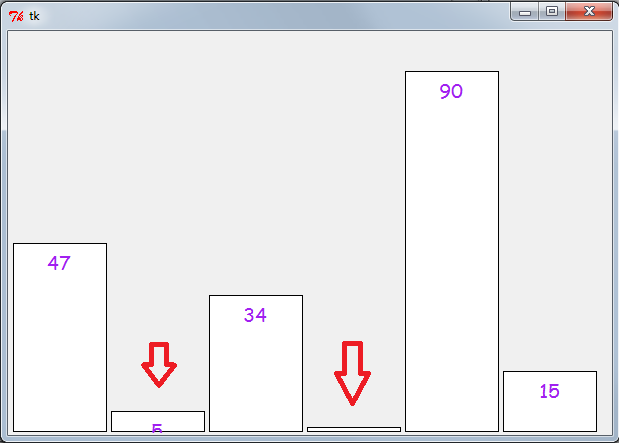 | 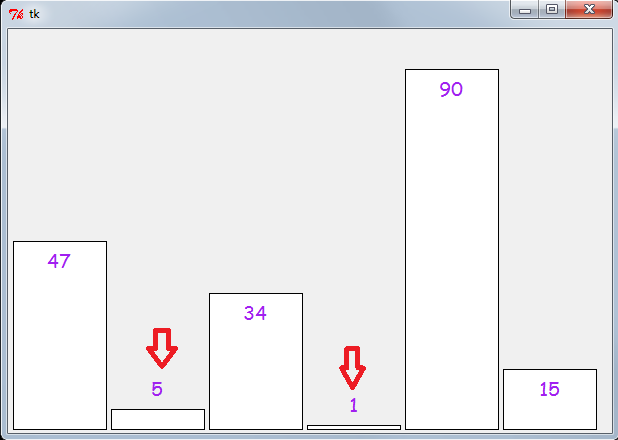 |
In addition if you wish you can make it colorful as shown below. In the sample below colors = ["red", "blue", "magenta", "brown", "gray", "orange"] are used in a specific order but it can be used randomly also.
Note that text color also changes.
>>> sampleList3= [47, 15, 34, 19, 90, 15, 34, 56, 78, 24, 6, 7, 24]
>>> bargraph2(sampleList3, 600, 400)