Lattice anisotropy determination
in 4-dimensional SU(3) gauge theory
Corresponding to Run B
| Fit results: |
L=5 | L=6 |
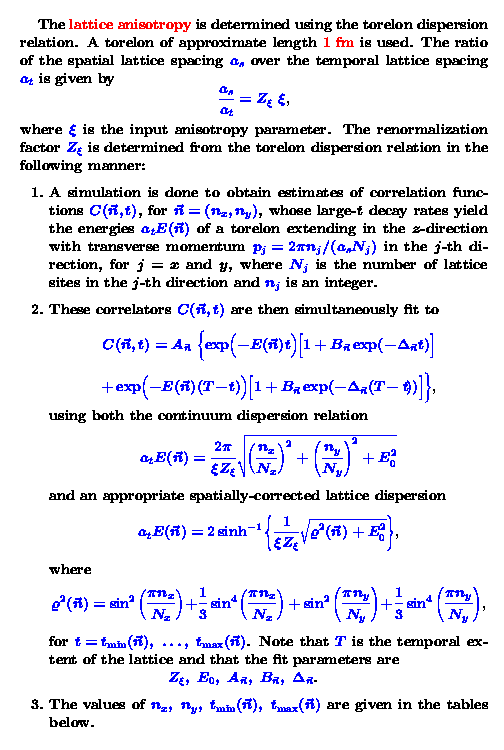
| Z_xi | 0.973(17) |
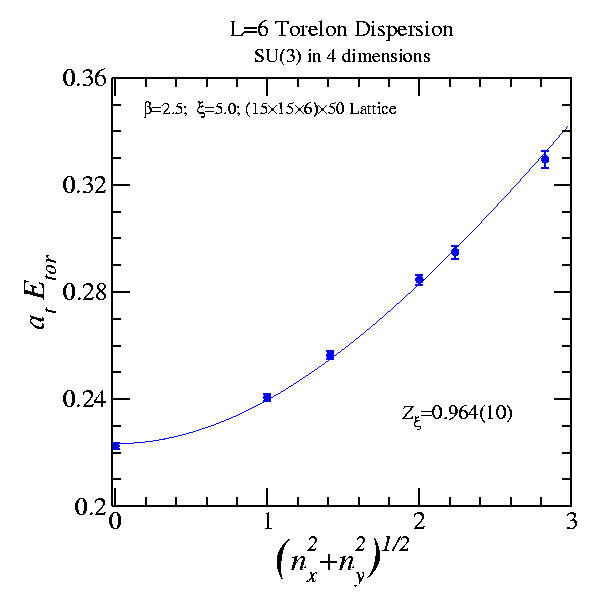
0.964(10) |
| 1/Z_xi | 1.027(18) | 1.038(11) |
| E_0 | 0.1308(27) | 0.1713(23) |
| chi-square/dof | 1.09 | 0.86 |
| goodness Q | 0.27 | 0.74 |
| |
| Improved anisotropic action |
| beta | 2.5 |
| input anisotropy a_s / a_t | 5.0 |
| input u_t | 1.0000 |
| input u_s | 0.8069 |
|
METHOD OF DETERMINATION
RUN PARAMETERS
| torelon length (in a_s) | 5 | 6 |
| transverse extent of lattice | 25 x 25 | 15 x 15 |
| temporal extent of lattice | 60 | 50 |
| Configuration updating parameters: | L=5 | L=6 |
| number of bins | 1100 | 2513 |
| number of measurements per bin | 10 | 10 |
| number of updates between measurements | 6 | 10 |
| number of Cabibbo-Marinari sweeps per update | 1 | 1 |
| number of over-relaxation sweeps per update | 6 | 6 |
| |
| Link smearing parameters: |
| number of fuzzings | 4 |
| alpha (staple weight) | 0.15 |
| initial fuzzing levels | 0 |
| increment in fuzzing levels | 3 |
| Correlator information: |
| Maximum time separation measured | 16 |
| Optimized on time slices | 1/ 0 |
|
| Momenta included in fit: |
| (n_x,n_y) | t_min | t_max |
| (0,0) | 0 | 15 |
| (0,1) | 0 | 15 |
| (0,2) | 0 | 15 |
| (1,1) | 0 | 15 |
| (1,2) | 0 | 15 |
| (2,2) | 0 | 15 |
| |
| L=5 Energies from fit: |
| (n_x,n_y) | a_t E(P) |
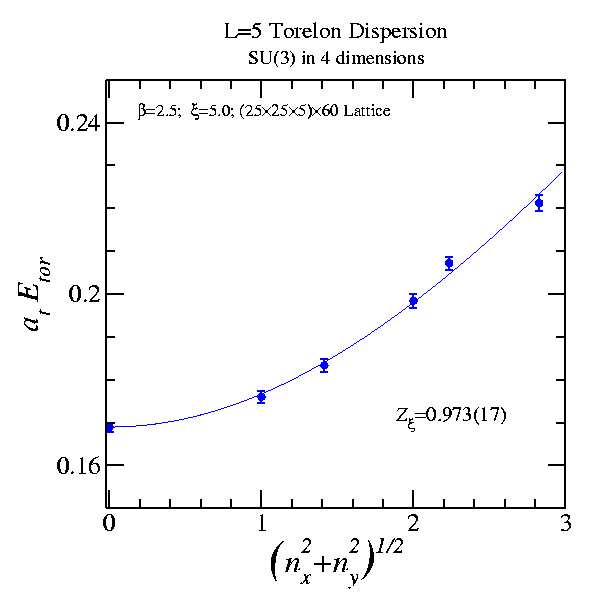
| (0,0) | 0.16894(80) |
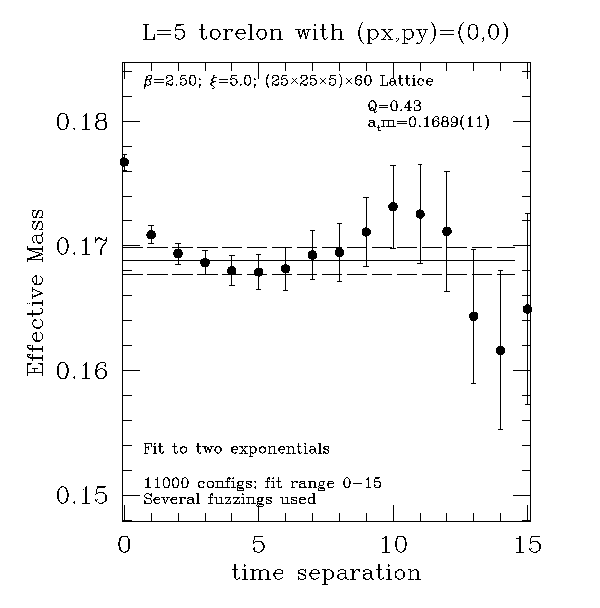
| (0,1) | 0.17666(64) |
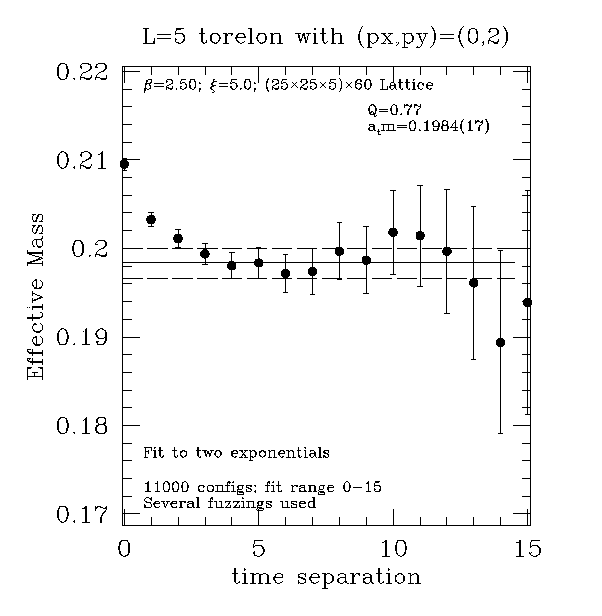
| (0,2) | 0.19802(77) |
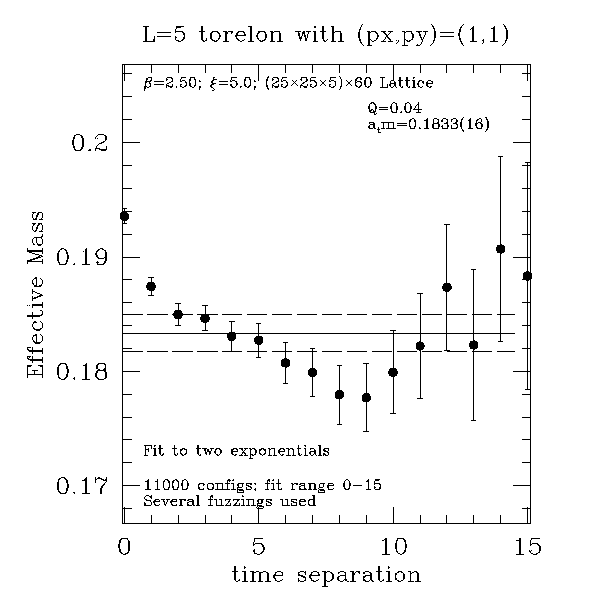
| (1,1) | 0.18405(61) |
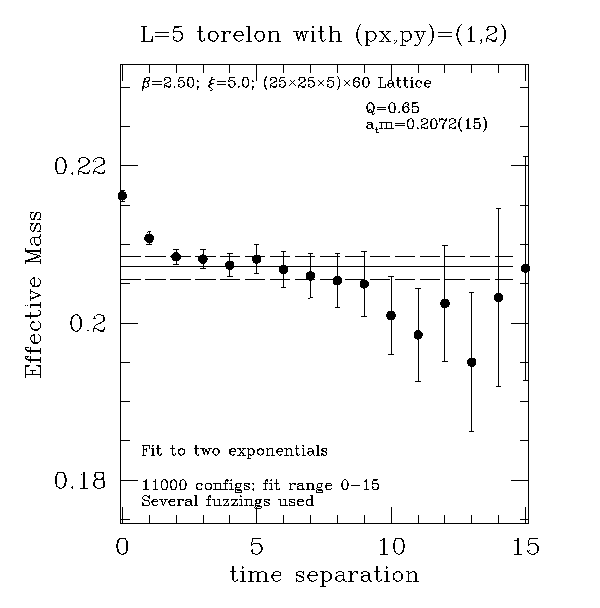
| (1,2) | 0.20464(92) |
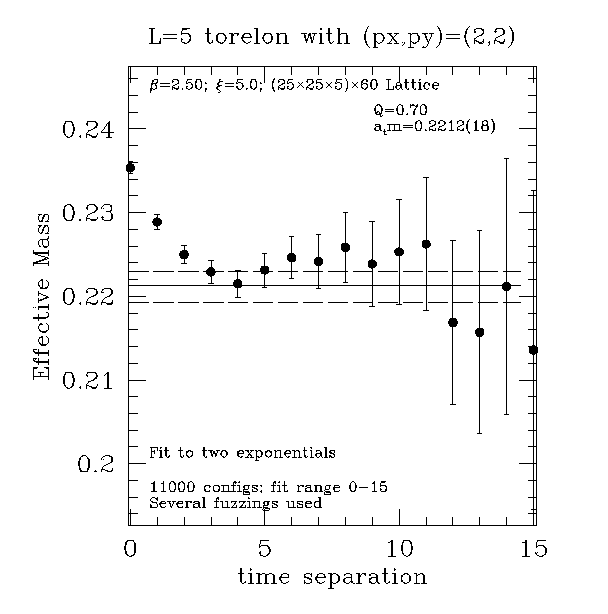
| (2,2) | 0.2233(14) |
|
EFFECTIVE MASS PLOTS (L=5)
OTHER L=5 FITS
| Continuum dispersion | Lattice dispersion |
| (n_x, n_y) values | Z_xi |
Q |
Z_xi | Q |
| (0,0) (0,1) (0,2) |
0.965(36) | 0.55 |
0.962(33) | 0.55 |
| (0,0) (0,1) (0,2) (1,1) |
0.967(34) | 0.18 |
0.964(33) | 0.18 |
| (0,0) (0,1) (0,2) (1,1) (2,2) |
0.988(19) | 0.29 |
0.985(18) | 0.29 |
| (0,0) (0,1) (0,2) (1,1) (1,2) |
0.938(23) | 0.25 |
0.935(23) | 0.25 |
| (0,0) (0,1) (0,2) (1,1) (1,2) (2,2) |
0.973(18) | 0.27 |
0.970(17) | 0.27 |
| Momenta included in fit: |
| (n_x,n_y) | t_min | t_max |
| (0,0) | 0 | 10 |
| (0,1) | 0 | 10 |
| (0,2) | 0 | 10 |
| (1,1) | 0 | 10 |
| (1,2) | 0 | 10 |
| (2,2) | 0 | 10 |
| |
| L=6 Energies from fit: |
| (n_x,n_y) | a_t E(P) |
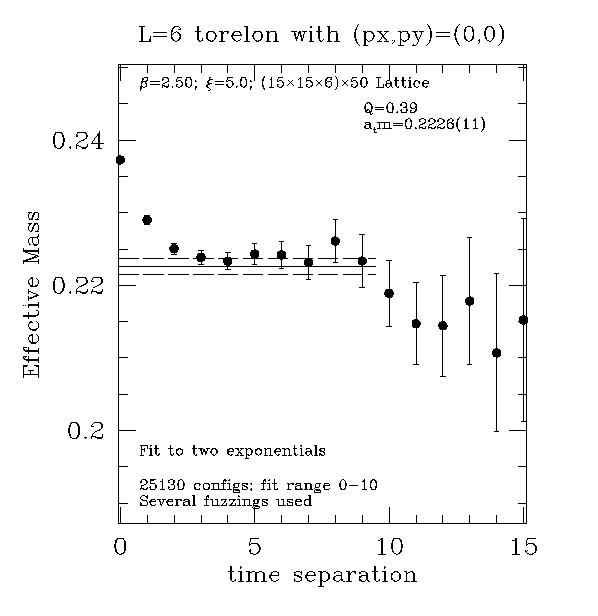
| (0,0) | 0.22335(91) |
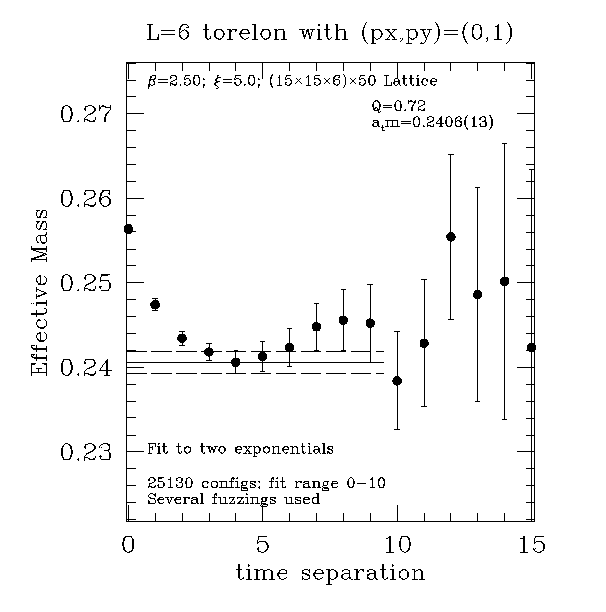
| (0,1) | 0.23967(71) |
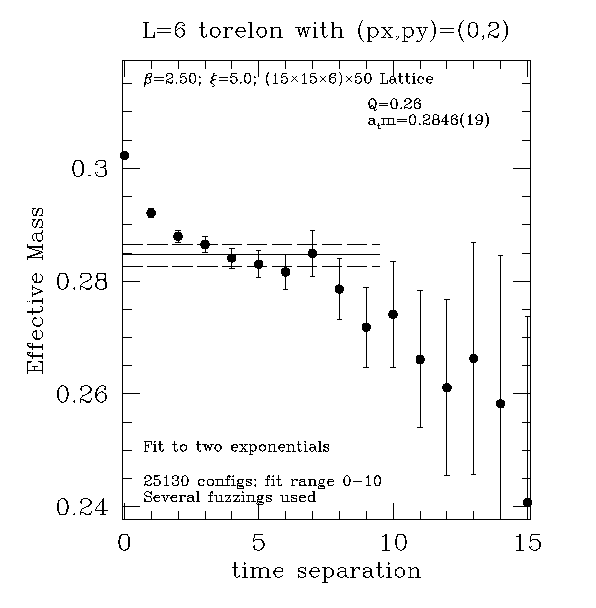
| (0,2) | 0.28305(96) |
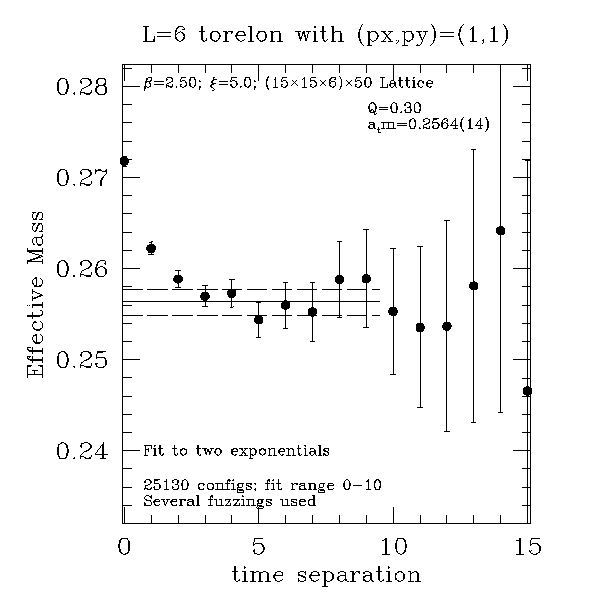
| (1,1) | 0.25495(69) |
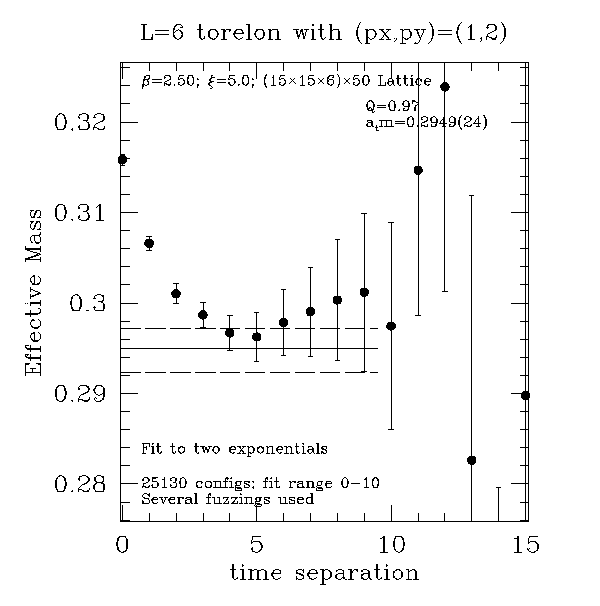
| (1,2) | 0.2961(11) |
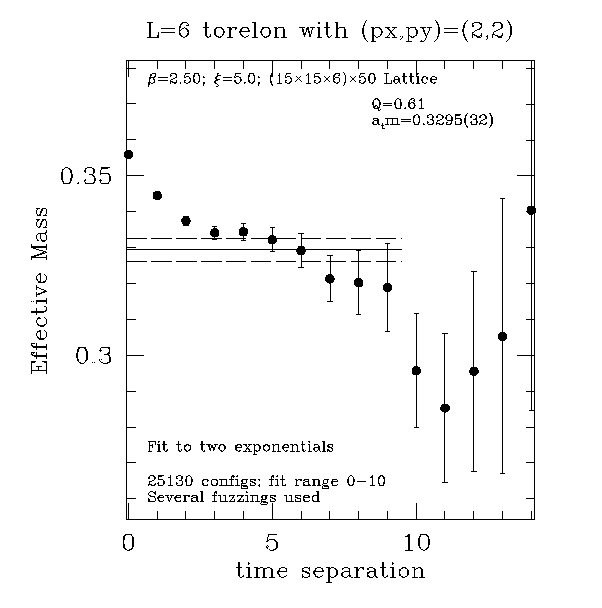
| (2,2) | 0.3322(16) |
|
EFFECTIVE MASS PLOTS (L=6)
OTHER L=6 FITS
| Continuum dispersion | Lattice dispersion |
| (n_x, n_y) values | Z_xi |
Q |
Z_xi | Q |
| (0,0) (0,1) (0,2) |
0.943(18) | 0.51 |
0.936(19) | 0.51 |
| (0,0) (0,1) (0,2) (1,1) |
0.940(16) | 0.51 |
0.933(15) | 0.52 |
| (0,0) (0,1) (0,2) (1,1) (2,2) |
0.960(12) | 0.50 |
0.952(11) | 0.52 |
| (0,0) (0,1) (0,2) (1,1) (1,2) |
0.954(13) | 0.72 |
0.946(14) | 0.73 |
| (0,0) (0,1) (0,2) (1,1) (1,2) (2,2) |
0.964(10) | 0.74 |
0.956(10) | 0.75 |

