This lab explores brokerage roles and bridge positions in social networks using both statnet and igraph packages in R. We’ll analyze communication patterns among employees during a labor dispute to identify key brokers and structural bridges.
Brokerage as Positions and Roles
In this tutorial we focus on brokers and bridges in a strike network: people who sit on critical paths, connect otherwise separated groups, or span structural holes. In the language of positions and roles, these actors occupy distinctive structural positions in the network, and those positions define characteristic roles in the flow of information, support, and influence.
Positions are sets of actors who relate to others in similar ways (structural equivalence). Role analyses and blockmodels are built on top of those positions. Here we take a complementary approach: rather than clustering everyone into positions. First, we start from concrete brokerage patterns (cutpoints, Gould–Fernandez brokerage, and Burt’s constraint) and ask:
Which actors sit in structurally powerful positions?
What role do they play in connecting groups (coordinator, liaison, gatekeeper, etc.)?
How do these roles shape the strike dynamics?
These questions allow us to connect individual-level brokerage measures to broader position and role structures in the network.
Case Study: Wood-Processing Facility Strike
The data comes from a wood-processing facility where workers rejected a new compensation package and eventually went on strike. Management hired a consultant to analyze employee communication structures, believing information wasn’t being effectively disseminated by union negotiators.
Employees indicated communication frequency on a 5-point scale, with ties defined as frequency ≥3 (at least one employee reporting discussions “several times per week” or more).
Data Setup
Code
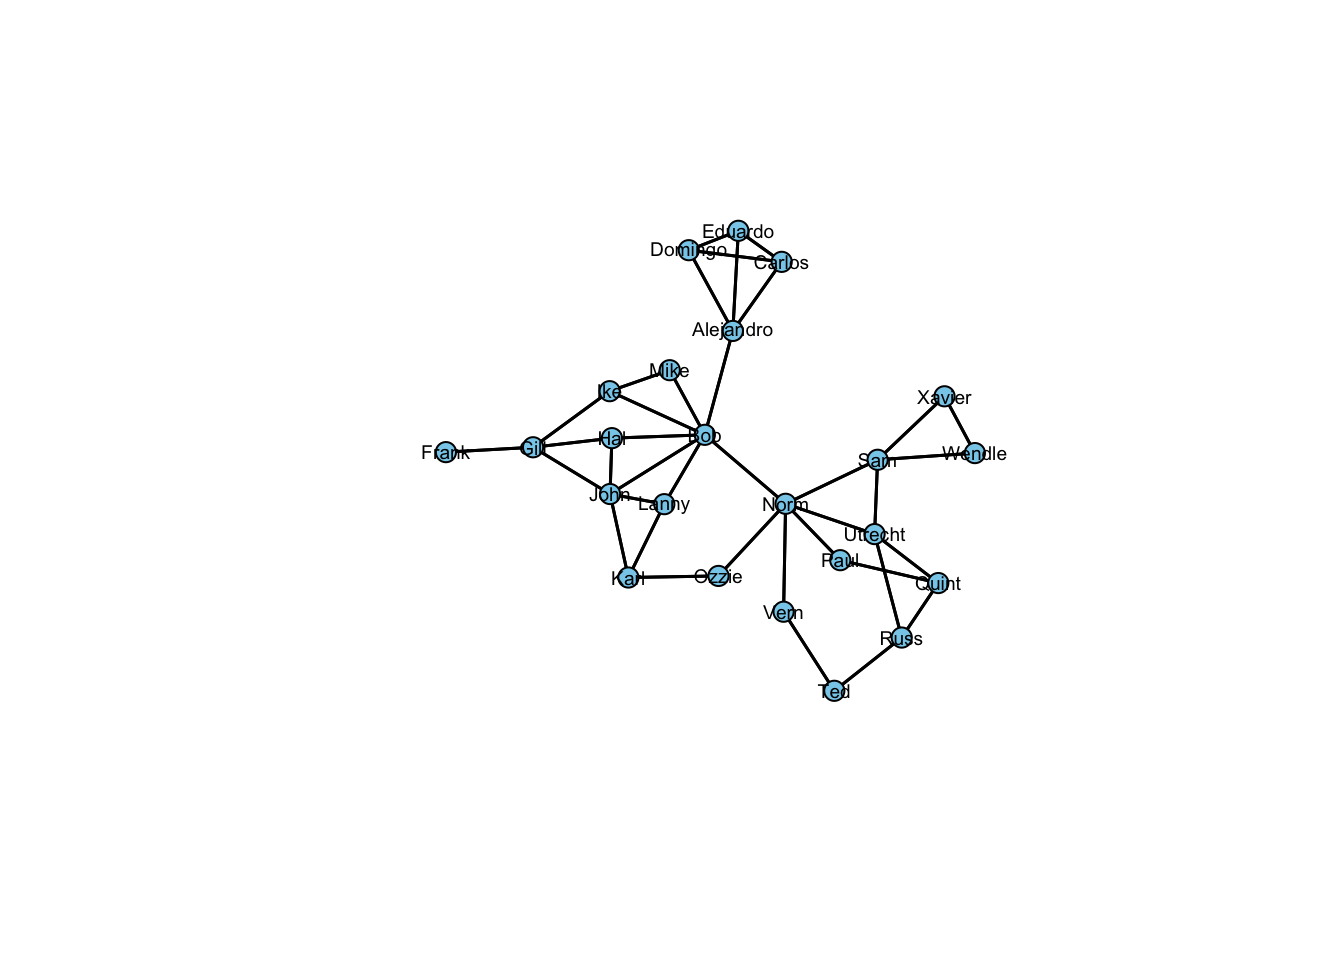
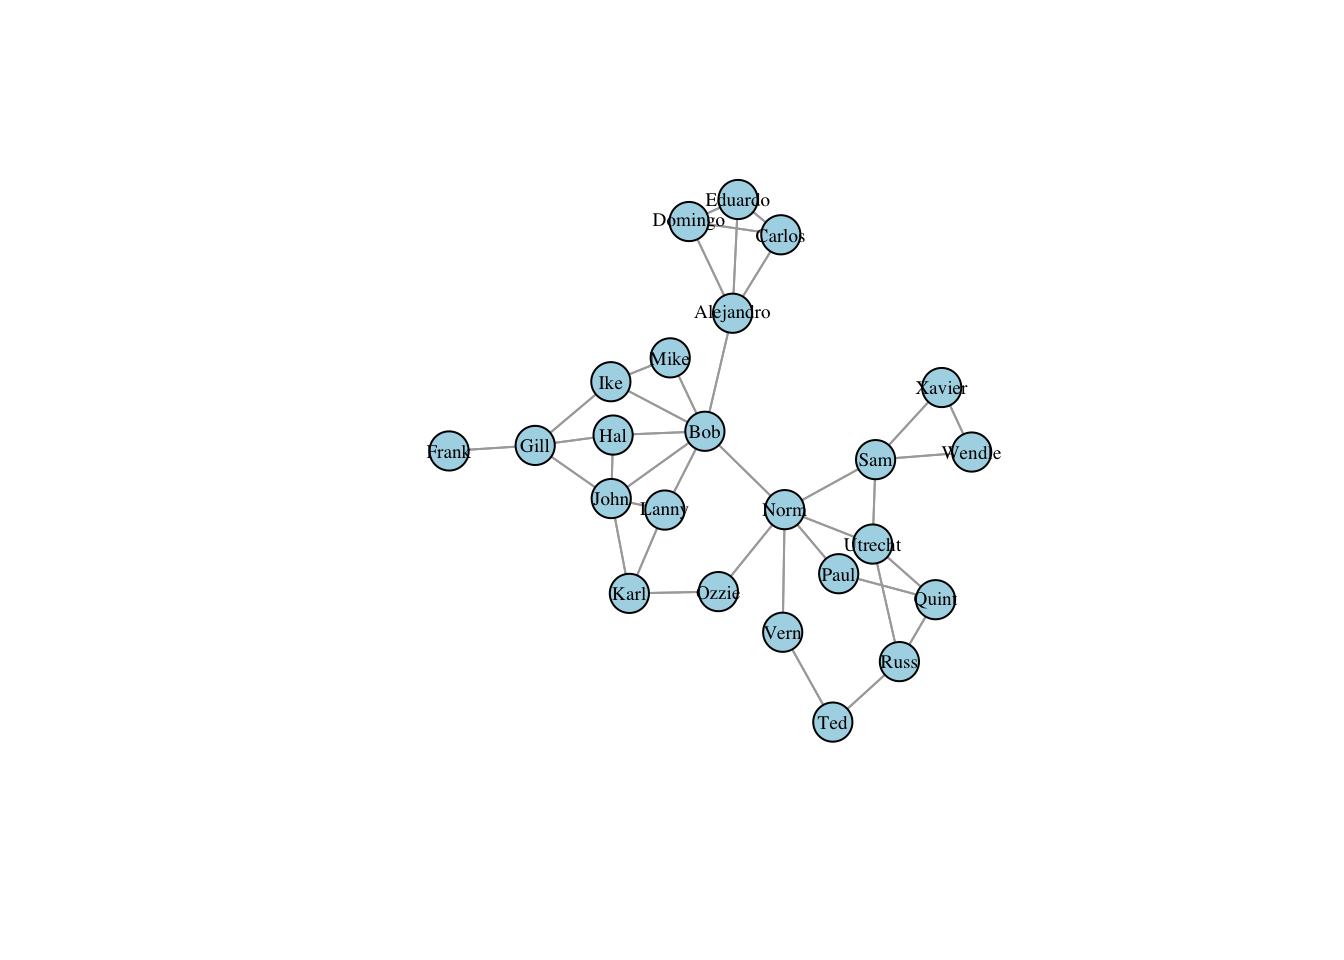
# Clear workspace and set working directoryrm(list=ls())# Read the strike network datastrike.net <-as.network(read.paj("Strike.net"), directed=FALSE)# Set coordinates for consistent plottingcoords <-gplot(strike.net, gmode="graph", label=network.vertex.names(strike.net), vertex.col="Sky Blue", label.col="black", label.cex=0.6, label.pos=5, mode="kamadakawai")
Identifying Cutpoints (Articulation Points)
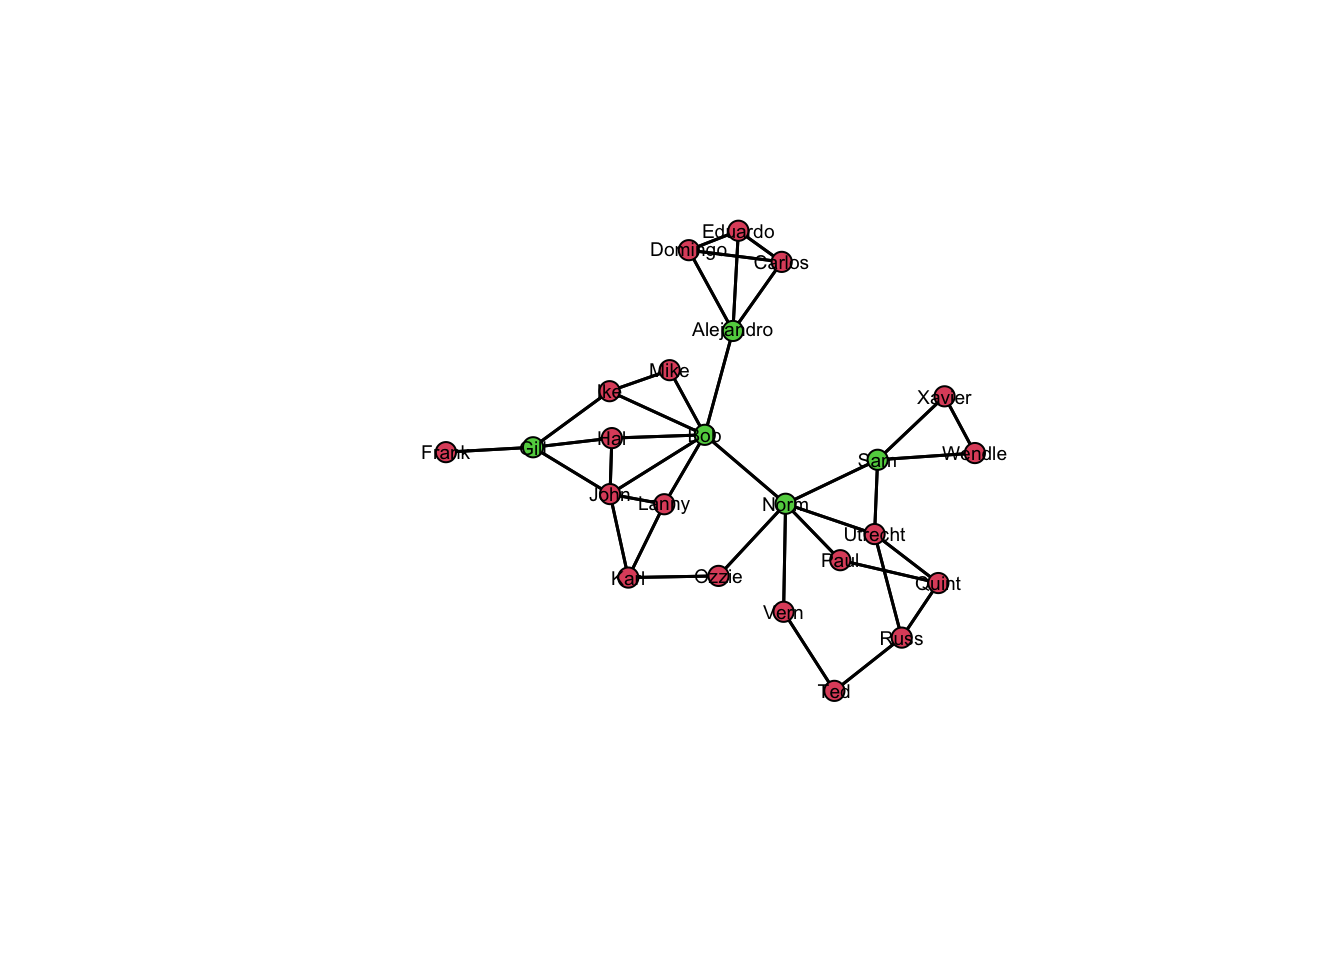
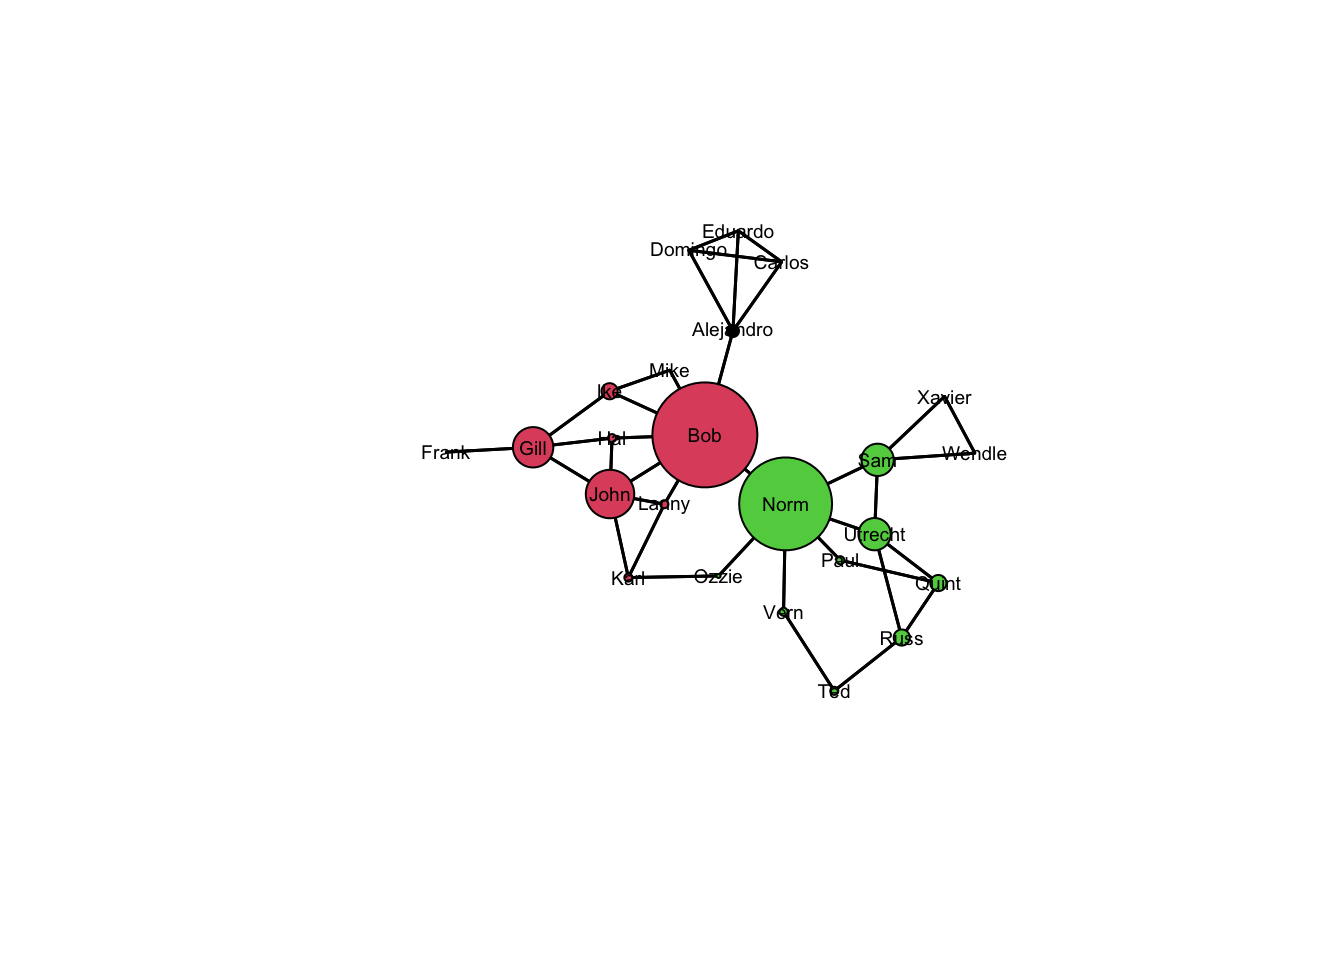
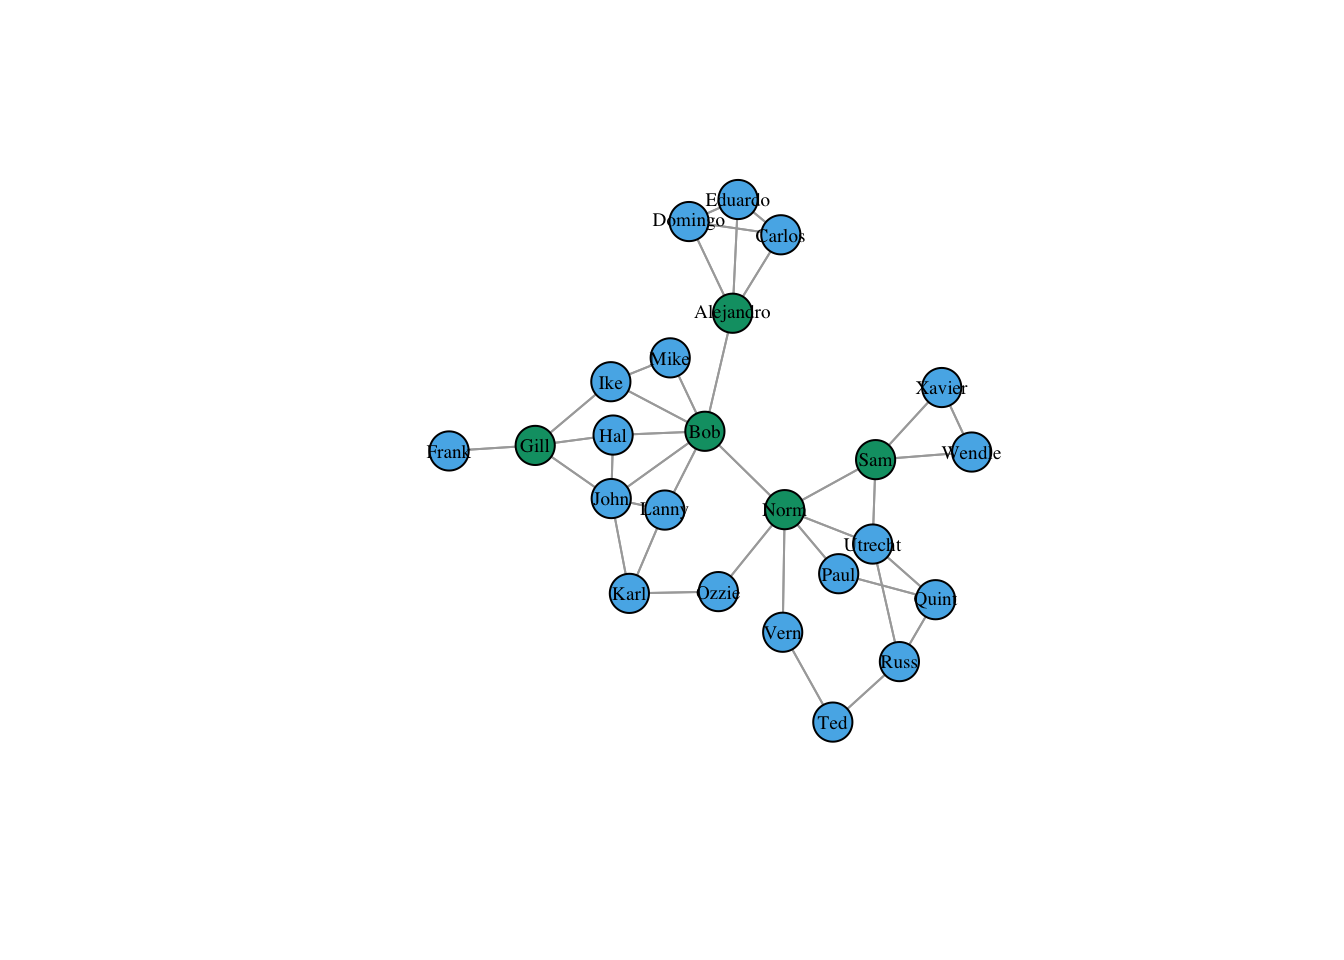
Cutpoints are nodes whose removal would disconnect the network. These represent critical bridge positions.
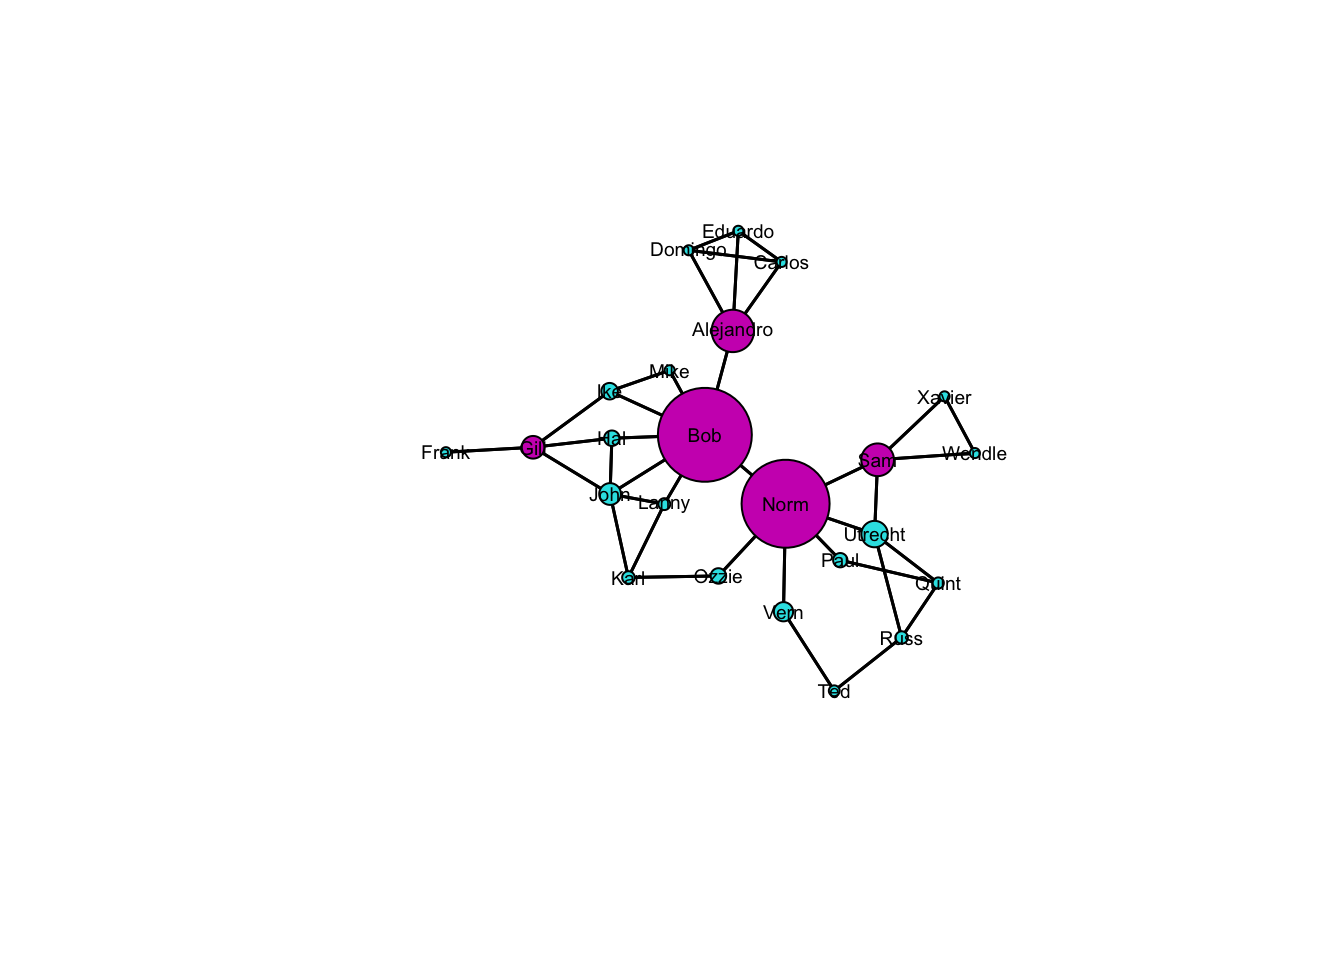
Betweenness centrality measures how often a node lies on shortest paths between other nodes. There’s typically correlation between high betweenness and cutpoint status.
Code
# Calculate betweenness centralitystrike.bet <-betweenness(strike.net)# Plot with node size proportional to betweennessgplot(strike.net, gmode="graph", label=network.vertex.names(strike.net), coord=coords,label.col="black", label.cex=0.6, vertex.col=strike.cut+5, label.pos=5,vertex.cex=(strike.bet/75+.5))
Bicomponent Analysis
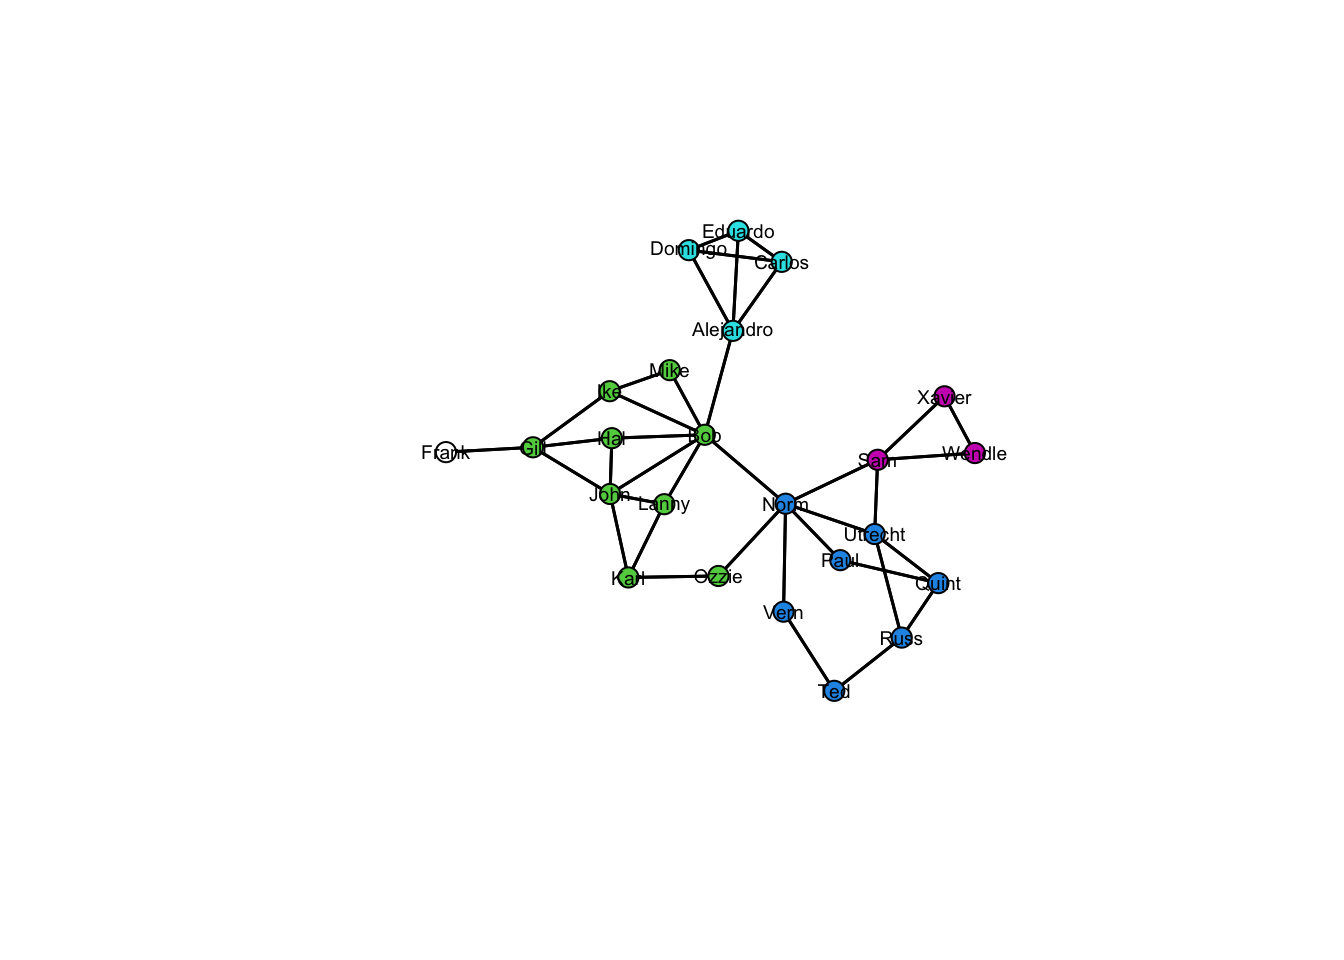
Bicomponents are maximal connected subgraphs that remain connected after removing any single node.
The Gould and Fernandez algorithm identifies five brokerage roles based on group membership:
Coordinator (w_I): Broker within same group
Itinerant (w_O): Broker outside all groups
Representative (b_I0): Broker from group to outside
Gatekeeper (b_OI): Broker from outside to group
Liaison (b_O): Broker between different groups
In practice, these five brokerage roles correspond to different role types in the larger block/role framework:
Coordinator (w_I): an actor who intermediates within their own group. They play an internal organizer role, keeping their group cohesive and coordinated.
Itinerant (w_O): an actor who brokers ties entirely outside all defined groups. They act as a free-floating specialist or consultant who operates in a liminal space, not rooted in any group.
Representative (b_I0): someone who carries information/resources from their group to outsiders. Think spokesperson or ambassador.
Gatekeeper (b_OI): someone who controls access into their group. They screen outsiders and decide what comes in.
Liaison (b_O): a pure between-group broker, connecting members of different groups. They most closely embody the “structural hole” role Burt emphasizes.
We can read these as roles embedded in positions: a given actor’s position is defined by their pattern of ties, and the Gould–Fernandez counts tell us what kind of brokerage role that position enacts when groups interact.
Code
# Read group membership datastrike.mat <-as.matrix(read.csv("Strikegroups.csv", header=TRUE, row.names=1, check.names=FALSE))# Calculate brokerage scoresstrike.gf <-brokerage(strike.net, strike.mat)# Display raw brokerage scoresstrike.gf$raw.nli
For the strike network, we can interpret the largest brokerage scores as follows: * Actors with many liaison ties are likely spanning different shop-floor factions or departments, negotiating across interests. * Actors with high gatekeeper scores sit at the boundary between management and workers or between union leadership and rank-and-file, controlling what information flows inward. * Actors with high coordinator scores may be informal leaders within a crew or shift, organizing local action.
From Brokerage Scores to Positions
The first step in a role analysis is to compute pairwise distances between rows of the adjacency matrix (or matrices), then cluster actors into positions based on structural equivalence. Actors who have ties to the same alters (even if they are not tied to one another) are treated as occupying the same position.
In this brokerage tutorial, we implicitly see positions emerging at two levels: 1. Bicomponents and cutpoints: The bicomponent analysis shows groups of nodes that are internally robust but connected through a small number of critical cutpoints. These bicomponents behave like coarse-grained positions in the network. 2. Brokerage role profiles: Each actor has a vector of brokerage counts (coordinator, itinerant, representative, gatekeeper, liaison). Actors with similar brokerage profiles are effectively playing similar roles, even if they are in different parts of the graph.
Conceptually, we could move from here to a full blockmodel, as in ch10: aggregate nodes into positions based on their brokerage profiles or structural equivalence, then examine the pattern of ties between those positions. That would let us ask questions like: * Which positions are “exporters” of influence or information? * Which positions are “importers” or sinks? * Which positions have high internal coordination but low external brokerage?
Even without building the full blockmodel in code, thinking in terms of positions helps interpret brokerage metrics as part of a larger role structure rather than as stand-alone scores.
igraph Analysis
Now let’s replicate and extend the analysis using igraph.
# Plot with cutpoints highlightedplot(strike.ig, layout=coords, vertex.label.cex=.6,vertex.label.color="black", edge.arrow.mode=0,vertex.color=(strike.cut+2))
Burt’s Constraint and Autonomy
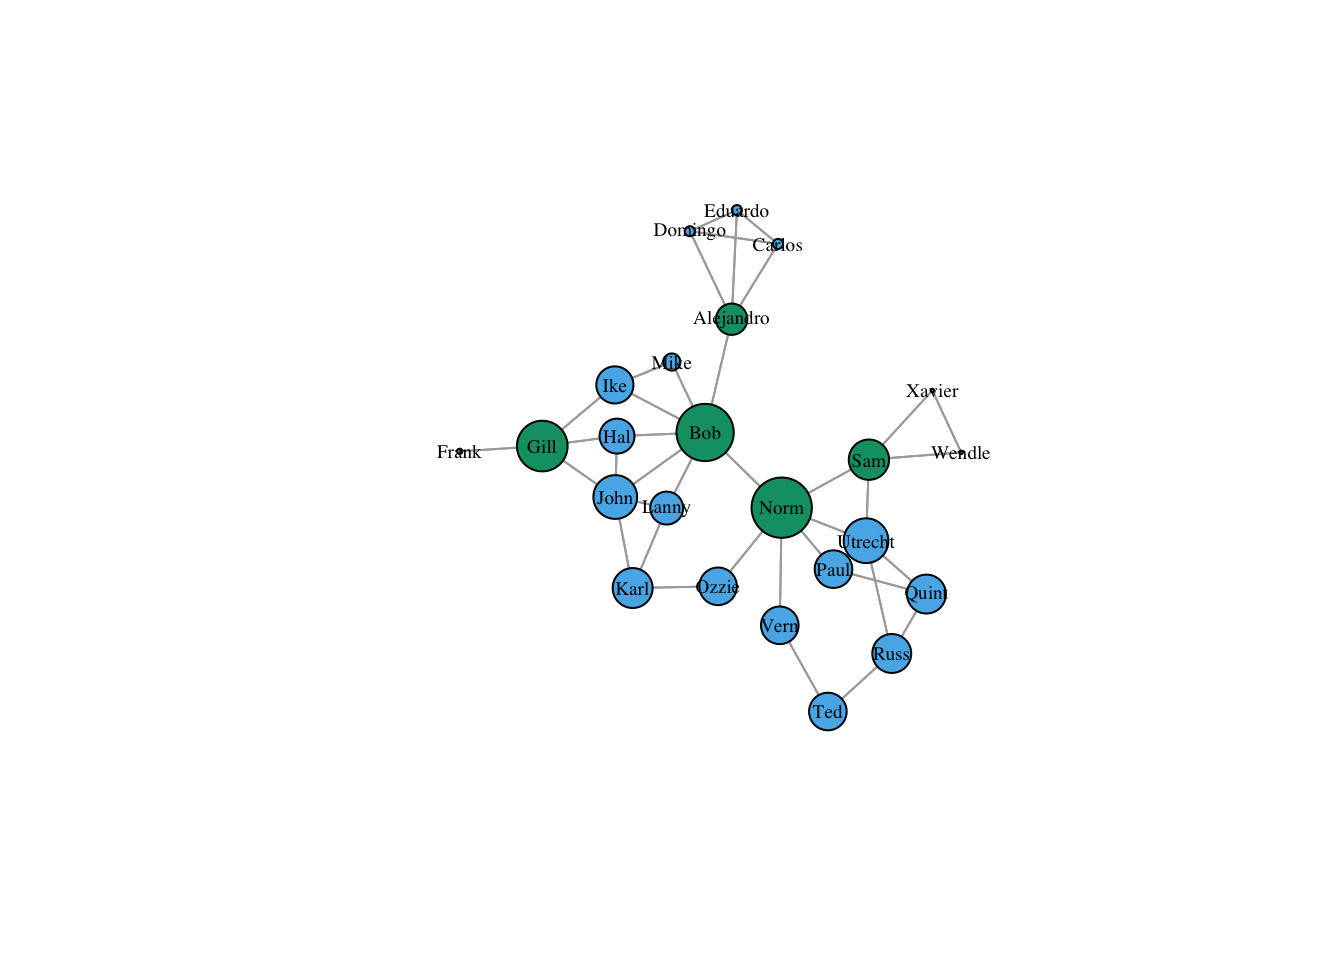
Burt’s constraint measures the extent to which a node’s contacts are connected to each other. Low constraint indicates brokerage opportunities.
Local equivalence clusters actors based on how they interact in their immediate neighborhood: which triad patterns they participate in, how often they close triangles, and so on. Actors can be locally equivalent even if they interact with different alters, as long as they have similar interaction signatures.
Burt’s constraint is closely related to this local perspective. High-constraint actors mostly sit in closed, redundant triads; low-constraint actors sit in open triads and chains that span otherwise disconnected alters. In other words: * Actors with high constraint look like local “cluster” members in the local equivalence framework. * Actors with low constraint / high autonomy look like local brokers whose triadic signatures emphasize open structures and cross-cutting ties.
Code
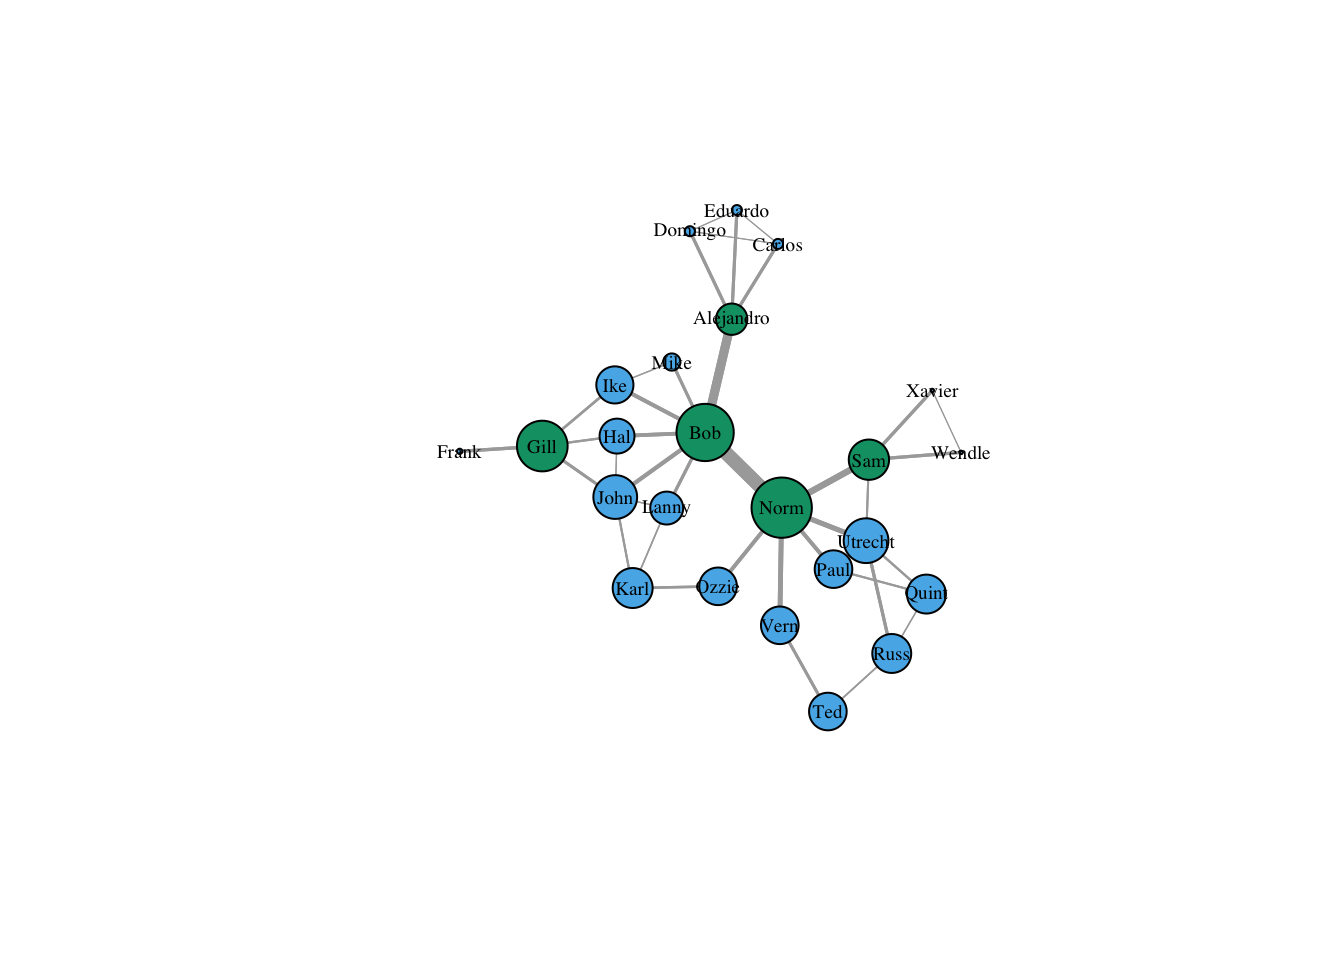
# Calculate Burt's constraintstrike.con <-constraint(strike.ig)strike.aut <-1- strike.con # Autonomy (inverse of constraint)# Plot with node size proportional to autonomyplot(strike.ig, layout=coords, vertex.label.cex=.6,vertex.label.color="black", edge.arrow.mode=0,vertex.color=strike.cut+2, vertex.size=strike.aut*30)
Edge Betweenness
Edge betweenness identifies bridges - edges that lie on many shortest paths.
Code
# Calculate edge betweennessstrike.edge <-edge_betweenness(strike.ig, directed=FALSE, weights=NULL)# Plot with edge width proportional to betweennessplot(strike.ig, layout=coords, vertex.label.cex=.6,vertex.label.color="black", edge.arrow.mode=0,vertex.color=strike.cut+2, vertex.size=strike.aut*30,edge.width=strike.edge/10+.5)
Theoretical Framework: Burt’s Structural Holes
Network Constraint
Ron Burt’s concept of network constraint measures the extent to which an individual’s network ties are redundant. High constraint occurs when your contacts are all connected to each other, limiting access to diverse information.
Key implications of high constraint:
Redundant information flows
Limited novel opportunities
Reduced autonomy and brokerage potential
Brokerage Advantages
Brokerage occurs when individuals bridge structural holes - gaps between disconnected groups. Brokers enjoy:
Information benefits: Access to diverse, non-redundant information
Control benefits: Influence over information flow between groups
Innovation advantages: Ability to synthesize ideas from different domains
Practical Applications
In organizational contexts, identifying brokers and bridges helps:
Improve information dissemination
Enhance innovation through cross-group connections
Identify critical employees in change management
Optimize organizational restructuring
Conclusion
This lab demonstrated multiple approaches to identifying brokers and bridges in social networks:
Cutpoint analysis identifies critical nodes whose removal disconnects the network
Betweenness centrality reveals nodes controlling information flow
Gould-Fernandez brokerage categorizes specific brokerage roles
Burt’s constraint quantifies brokerage potential
Edge betweenness identifies critical connections
These measures provide complementary perspectives on network structure and the strategic positions individuals occupy within social systems. It demonstrates how to build positions and roles by clustering actors based on equivalence and then constructing blockmodels. The brokerage tools here can be viewed as diagnostics that highlight which positions are likely to matter most for coordination, information flow, and power in the network.
References
Burt, R.S. (1992). Structural Holes: The Social Structure of Competition. Harvard University Press.
Burt, R.S. (2004). Brokerage and Closure: An Introduction to Social Capital. Oxford University Press.
Gould, R.V., & Fernandez, R.M. (1989). Structures of Mediation: A Formal Approach to Brokerage in Transaction Networks. Sociological Methodology, 19, 89-126.
Newman, M. (2010). Networks: An Introduction. Oxford University Press.