S.
Klepper, Economics 73-100, Fall 2010
Solutions to Exam II
1. If the government training program is implemented, the total variable cost of production at every level of output will fall by 10%. This implies a fall in the marginal and average variable cost of production of 10% at every level of output and a smaller percentage fall in average total cost at every level of output, as total and hence average fixed costs at every level of output will not change. If average variable cost declines by 10% at every level of output then the minimum price at which producers will produce in the short run will decline by 10%, which could cause some firms to begin producing again (if their minimum average variable cost fell below the world price).
The amount that firms will produce that produced before the implementation of the program is pictured below.
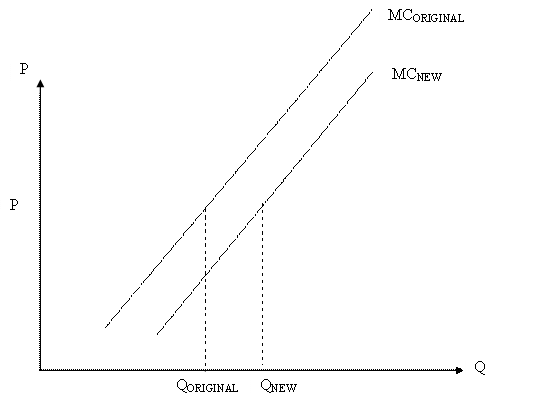
As the figure illustrates, the firm continues to produce an output where marginal cost equals price. The quantity produced will rise, but the extent of the increase need not be 10% (this is how much marginal cost falls at each level of output but not how much output rises). Without knowing how much output rises, it is not possible to determine if the quantity of labor employed by the firm rises or falls. Since the price has not changed, the marginal cost of production (of the marginal unit) is the same as before the program.
Based
on this discussion, the answers to the individual questions, with the points
allotted to them in brackets, are:
[4]
1. True
[4]
2. False
[4]
3. True
[5] 4. False
[6]
5. False—not necessarily.
[7]
6. True
2. If the tax is imposed only on producers that produce five or more units of output, then there will be no change in the total labor cost required to produce one, two, three, or four units of output. Consequently, there will be no change in the marginal, average variable, or average total cost of production of the first four units of output.
The tax will increase the total cost of labor required to produce five or more units of output. To illustrate, suppose the tax rate was 10%. In rounds 1-3, this will cause the total cost of labor to shift as follows, with the same percentage shifts also applying in rounds 4-6 when the price of labor was $10 per unit:
|
Output |
Original Total Labor Cost |
New Total Labor Cost |
|
|
|
|
|
0 |
0 |
0 |
|
1 |
6 |
6 |
|
2 |
10 |
10 |
|
3 |
12 |
12 |
|
4 |
16 |
16 |
|
5 |
22 |
24.20 |
|
6 |
30 |
33 |
|
7 |
39 |
42.90 |
|
8 |
50 |
55 |
|
9 |
63 |
69.30 |
This
causes the marginal and average variable cost at each level of output to shift
as follows:
|
Output |
Original Marginal Cost |
New Marginal Cost |
|
|
|
|
|
1 |
6 |
6 |
|
2 |
4 |
4 |
|
3 |
2 |
2 |
|
4 |
4 |
4 |
|
5 |
6 |
8.20 |
|
6 |
8 |
8.80 |
|
7 |
9 |
9.90 |
|
8 |
11 |
12.10 |
|
9 |
13 |
14.30 |
|
Output |
Original Average Variable Cost |
New Average Variable Cost |
|
|
|
|
|
1 |
6 |
6 |
|
2 |
5 |
5 |
|
3 |
4 |
4 |
|
4 |
4 |
4 |
|
5 |
4.4 |
4.84 |
|
6 |
5 |
5.50 |
|
7 |
5.6 |
6.13 |
|
8 |
6.25 |
6.875 |
|
9 |
7 |
7.7 |
The marginal and average variable cost both rise at output levels of five and above. The marginal cost increases most, and by more than 10%, at five units of output because the producer must pay a tax on the labor used to produce all five units of output and this additional amount is added to the marginal cost of the fifth unit. On the sixth and higher units of output, marginal cost is 10% higher than in the version of the experiment conducted in class because the additional labor needed to produce the marginal unit of output now costs 10% more due to the tax. The average variable cost increases by 10% at five and higher units of output because the tax is levied on all the units of labor hired to produce five and higher units of output. Any other tax rate between 5% and 10% would have comparable effects.
The average total cost will also rise beginning with the fifth unit of output, but since the rise in total labor cost cannot be greater than 10% and fixed costs have not changed, the rise in average total cost of units five and above must be less than 10%. Therefore, at every level of output the average total cost of production rises by less than 10%.
The minimum price required to produce a positive level of output equals the minimum average variable cost of production. This is still $4 regardless of the tax rate. Hence the minimum price required to produce is unchanged. Since the price of output in each round is unchanged, this implies that producers will continue not to produce any output in rounds 1 and 4 and will produce a positive level of output in rounds 2, 3, 5, and 6. However, if the tax rate is 10%, the change in marginal cost will alter the amount of output producers will supply in some of the rounds in which they will produce a positive level of output. It will not change the amount supplied in rounds 2 and 4 because at the prices of $5.15 and $44 in rounds 2 and 4 respectively, the profit maximizing level of output is still 4. In round 3, however, the marginal cost of the fifth unit of output of $8.20 is less than the price of $8.40 but the marginal cost of the sixth unit is now $8.80, which exceeds the price of $8.40. Therefore, in round 3 producers would produce only five, not six, units of output as in the version of the experiment conducted in class. Similarly, in round 6 producers will produce four units of output rather than the five units they produced in the version of the experiment conducted in class.
Since nothing is changed in rounds 1, 2, 4, and 5 at the highest possible tax rate of 10%, regardless of the tax rate the total profits earned by producers will be the same as in the version of the experiment conducted in class.
Based on this discussion, the
answers the individual questions, with the points allotted to them in brackets,
are:
[4]
7. True
[7]
8. False
[6]
9. True
[5] 10. True
[5]
11. False
[5]
12. False
[6]
13. False
[6]
14. False
3. In
the analysis in class, the increase of 40% in the income of China, India, and
the Middle East resulted in an increase in world demand for gasoline and hence
oil of 6.4% (40% times an income elasticity of 1 times .16, which equals the
fraction of world demand in 2002 attributable to China, India, and the Middle
East). If world supply did not change
between 2002 and 2006 and world demand outside
6.4% decrease in world demand for gasoline = 0.25 *
(0.4 * percentage increase in the world price of oil) = 0.1 * percentage
increase in the world price of oil,
which
yields a percentage increase in the world price of oil equal to 64%.
Consider
how the rise in the world price of oil would have been affected if the price
elasticity of demand for gasoline was 0.4 rather than 0.25. Then, according to the above calculation, the
percentage increase in price needed to bring about a decrease in the world
demand for gasoline would have been even smaller than 64%. Hence this could not explain the rise in the
world price of oil by 98%.
Suppose
the income elasticity of demand for gasoline in China, India, and the Middle
East was 1.4 rather than 1. Then, the
40% growth in income in these countries would have caused world demand for oil
and gasoline to rise by 40% * 1.4 * .16 = 8.96%. Therefore, the percentage increase in the
price of oil would have had to satisfy:
8.96% = 0.1 * percentage increase in the world price
of oil,
which
yields a percentage increase in the price of oil of 89.6%. Hence this could not explain the 98% rise in
the world price of oil.
If
the price of oil accounted for only 30% of the price of gasoline, then the
percentage increase in the price of oil would have had to satisfy:
6.4% decrease in world demand for gasoline = 0.25 *
(0.3 * percentage increase in the world price of oil) = 0.075 * percentage
increase in the world price of oil
Solving,
the percentage increase in the world price of oil would then be 6.4%/0.075 =
85.3%, which is still not sufficient to explain the 98% rise in the world price
of oil.
Suppose
that in addition to the rise in income in China, India, and the Middle East, income
of the rest of the world rose by 4% from 2002 to 2006 and the income elasticity
of demand for gasoline in the rest of the world was 0.5. Then the increase in the demand for gasoline
outside of
8.4% = 0.1 * percentage increase in
the world price of oil,
which
yields a percentage increase in the world price of oil equal to 84%. Expressed
alternatively, even a further increase in world demand of 2% would only have
required the price of oil to rise further by 2%/0.1 or by 20%, which added to
64% is not enough to explain the percentage increase in the price of oil of
98%.
If
the world supply was 3% less in 2006 than 2002, then the increase in the price
of oil would have had to induce a fall of 9.4% in world demand for oil to
balance supply and demand in 2006. This
would have required an additional percentage increase in price (above 64%) of
3%/0.1, or 30%, which when added to 64% is still not enough to explain the 98%
rise in price (it explains only a 94% increase in price).
Last,
if speculators caused the world demand for oil to rise by 4% over its 2002
level, then the increase in the price of oil would have had to satisfy:
10.4% = 0.1 * percentage increase in the world price
of oil,
which
yields a percentage increase in the price of oil of 104%. Hence this, coupled with the rest of the
developments, could explain the 98% rise in the world price of oil.
Based on this discussion, the answers to the
individual questions, with points allotted in brackets, are:
[3]
15. False
[4] 16. False
[4]
17. False
[5] 18. False
[5]
19. False
[5]
20. True