|
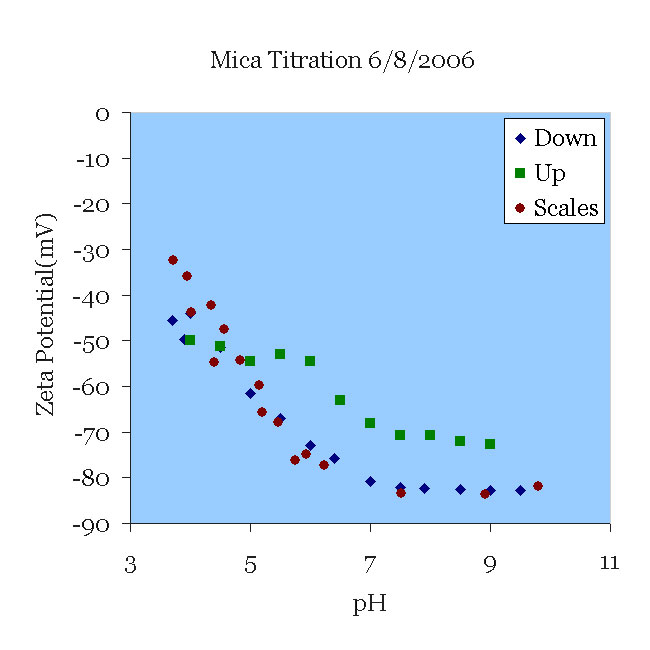 |
08 JUN06 A mica sample that had been titrated the day before was placed in a 100 μS/cm KCl solution (approximately 0.66 mM) and pH 9.5. The solution was titrated from pH 9.5 to pH 3.5 and then from 3.5 to 9 without changing the solution. Note the excellent agreement with the data of [Scales90] for their experiments in 1 mM solution. Note also the deviation from their results as the pH rises. This can probably be traced to two sources. First, the titration itself certainly increased the ionic strength, which tends to decrease the magnitude of zeta. More importantly, perhaps, titration to acid conditions leaches aluminum from the mica, which then might be re-deposited as the pH rises. Now the surface might present alumina oxides to the solution, which have a isoelectric point higher than silica.
|
|
|
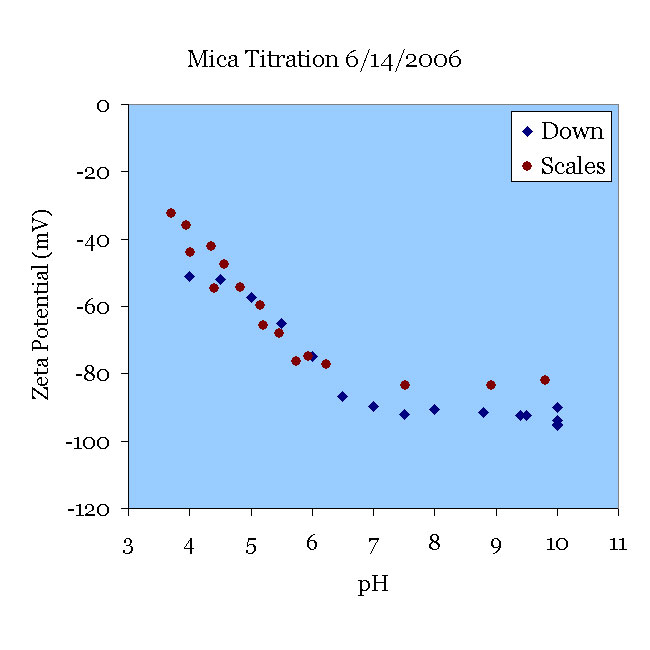 |
14JUN06 A fresh-cleaved mica sample was pre-treated in pH 10 KOH solution for 30 minutes and tested in 138 μS/cm KCl solution. The solution was titrated from pH 10 to pH 3.5. This ZetaSpin data agrees well with the data of [Scales90] at pH < 6 with some deviation at the higher pH. Fresh samples of mica exhibit somewhat higher zeta potentials until they have been aged overnight in contact with solutions, as one can see from the 08JUN graph above.
TOP |
|
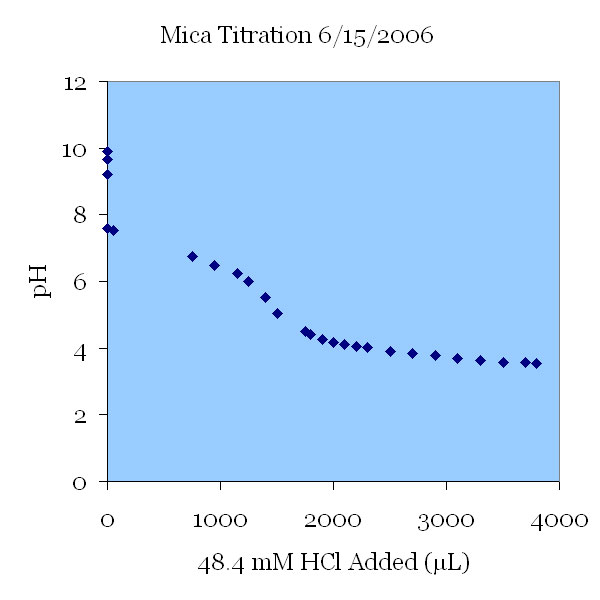 |
15JUN06 The pH change of a 115 μS/cm KCl solution. The solution was titrated down from pH 10 to a pH of 3.5. The initial change in pH was not caused by the addition of titrant; this pH drop was thought to be the effect of carbon dioxide introduced with air bubbles by the strong stirring action. In the next graph, a nitrogen purge was used to prevent these uncontrolled pH changes.
TOP |
|
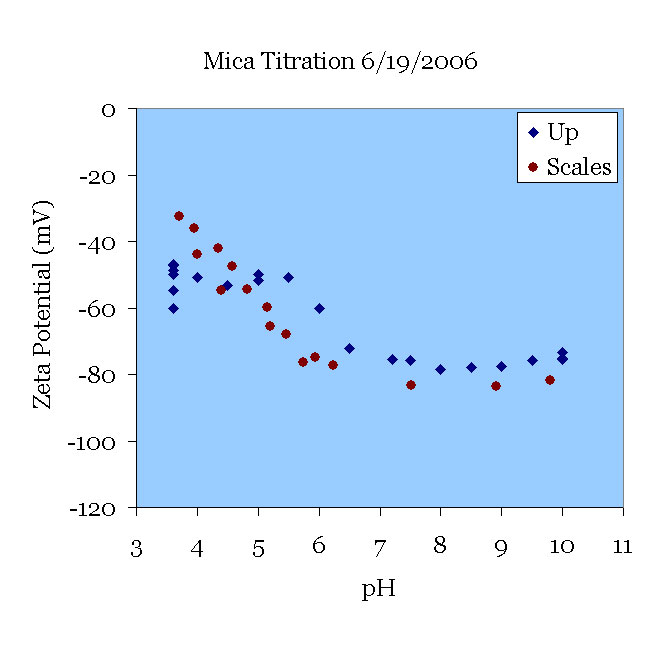 |
19JUN06 A fresh mica sample was pretreated in pH 11 KOH solution for 30 minutes and used in a 198 μS/cm KCl solution starting at pH 3.5. The solution was titrated from pH 3.5 to pH 10. Note the deviation from the data of [Scales90] and the similarity to the data of the 08JUN06 experiment once the pH was increased. There is a plateau when 3 < pH < 5 and then a typical increase in the magnitude. See comments to the 08JUN06 results. This experiment successfully used a nitrogen purge to avoid variations in pH due to entrained air bubbles.
TOP
|
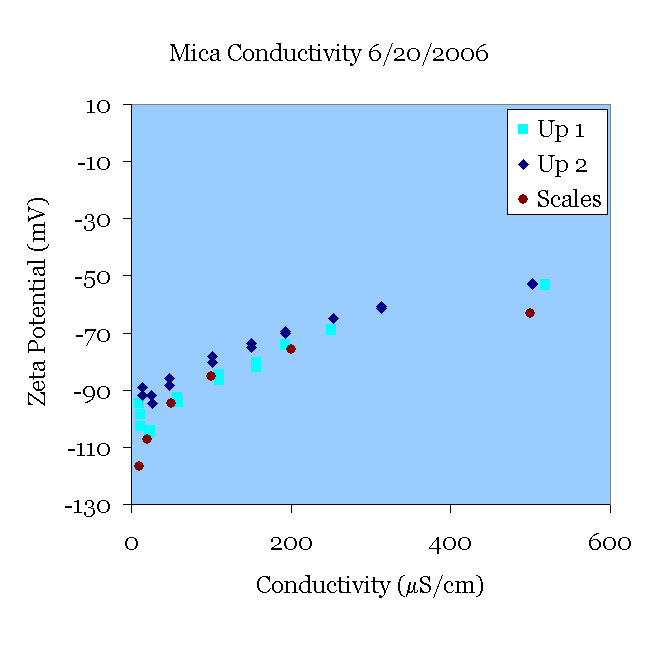 |
20JUN06 A fresh mica sample was pre-treated in pH 11 solution for 30 minutes and placed in an initially 10 μS/cm KCl solution at pH 5.5. The conductivity of the solution was then increased to 500 μS/cm (Up 1). Using the same mica sample, the procedure was repeated with a fresh solution of KCl (Up 2). Both experiments agree reasonably well with the data of [Scales90].
TOP |
|
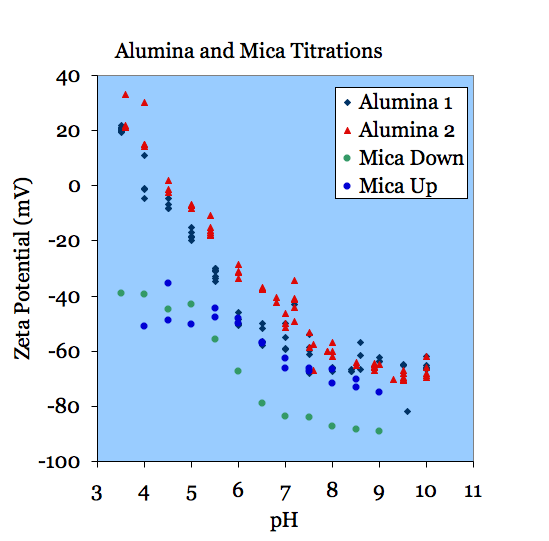
| This is a plot of titrations of alumina and mica, showing that the zeta potential of mica depends on its history. In this case the mica was titrated from pH 9 to pH 3.5 and then back up to 9 in the same solution. Note the hysteresis in the measurement. The results for mica resemble the results for the alumina disk as the pH is increased without changing the solution. See [Scales90] and the background discussion on mica for possible reasons. |