![]()
2B.
Contour Plot
![]()
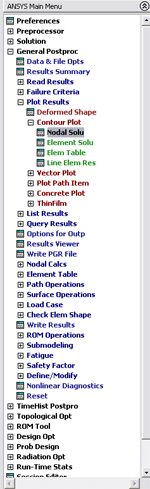
MAIN MENU -> General
Postproc
GENERAL POSTPROC -> Plot
Results
PLOT
RESULTS -> Contour Plot-Nodal solu...
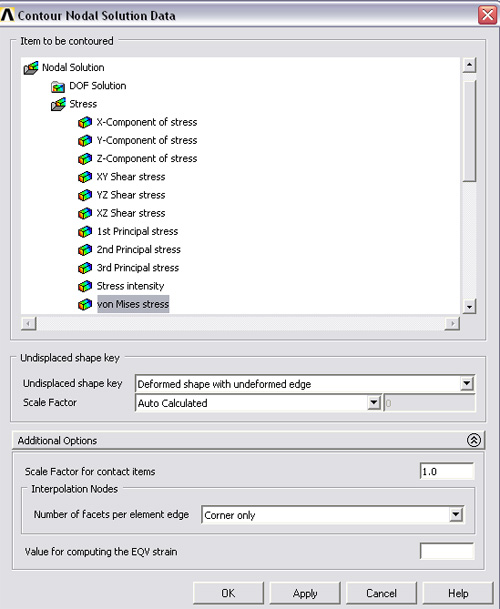
CONTOUR
NODAL SOLUTION DATA ->
Item
to be contoured -> Highlight Stress -> Von Mises SEQV
Items to be plotted -> Def +
undeformed
COUNTOUR NODAL SOLUTION DATA -> OK.
This
displays the results data as contoured lines across the model. You should
now have a color representation of the von mises stress in your plate similar
to the Figure below.
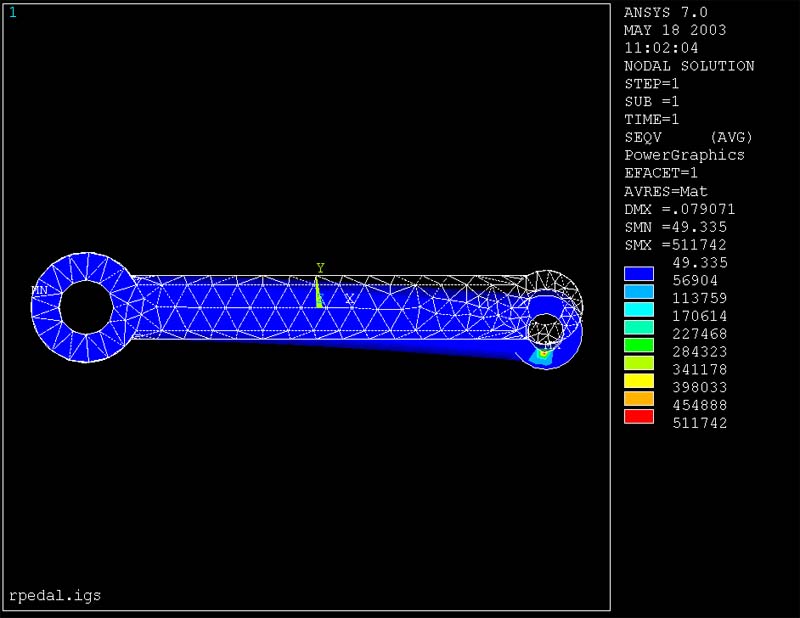
Close PLOT RESULTS window.
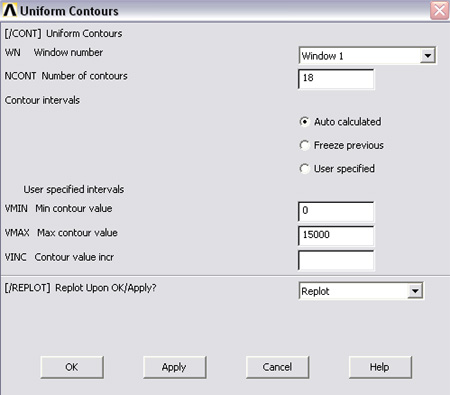
The stress
contour values in the previous plot were auto-scaled by the ANSYS package,
based on the minimum and maximum stress values in the model. This has resulted
n a rather poor plot if you are interested in stress results anywherer away
from tghe location of the concentrated load on the right end of the model.
To obtain stress contours in the middle of the model (where the results are
valid) you need to set contour scales yourself.
MAIN
MENU --> PlotCtrls
PlotCtrls
--> Style
Style
--> Contours --> Uniform Contours
Then you should see the following window. Enter
maximum and minimum values you want the plot to display.