Lab 2: PWM & Filtering
The purpose of this lab is to introduce the use of the Arduino's PWM outputs to control systems with a pseudo-analog signal, and to introduce you to the filters you've been learning about to demonstrate that a low pass filter has the effect of averaging a PWM signal. You will be using your NScope, an Arduino, and some common componets to do this.
Before starting the lab please be sure that you have a working development environment as well as the NScope software (which you can download here).
Part List:
(1) 330 Ω Resistor
(1) 100 μF Capacitors
(1) Potentiometer
(1) LED
Connecting wires
Part 1: NScope
Connect the NScope to the Arduino breadboard and connect the Arduino and NScope to your PC serial ports as in Figure 1.

Figure 1: NScope Connection. Be sure to connect the NScope power and ground to your board.
Low Pass Filter Performance
We will begin the lab by connecting building a low pass filter and studying the filter's performance using the NScope.
1. Connect one of your 330 Ω resistors to NScope Pin A1 and connect one of the provided 100 μF capacitors in series with the resistor to ground. This builds the low pass filter.
2. Connect the NScope Pin A1 to NScope Ch 2 with a wire. This allows the NScope's source signal to be visible on the display.
3. Connect the connection point between the resistor and capacitor to NScope Ch 1 with a wire. This will measure the low pass filter output.
The completed connections are shown in Figure 2.
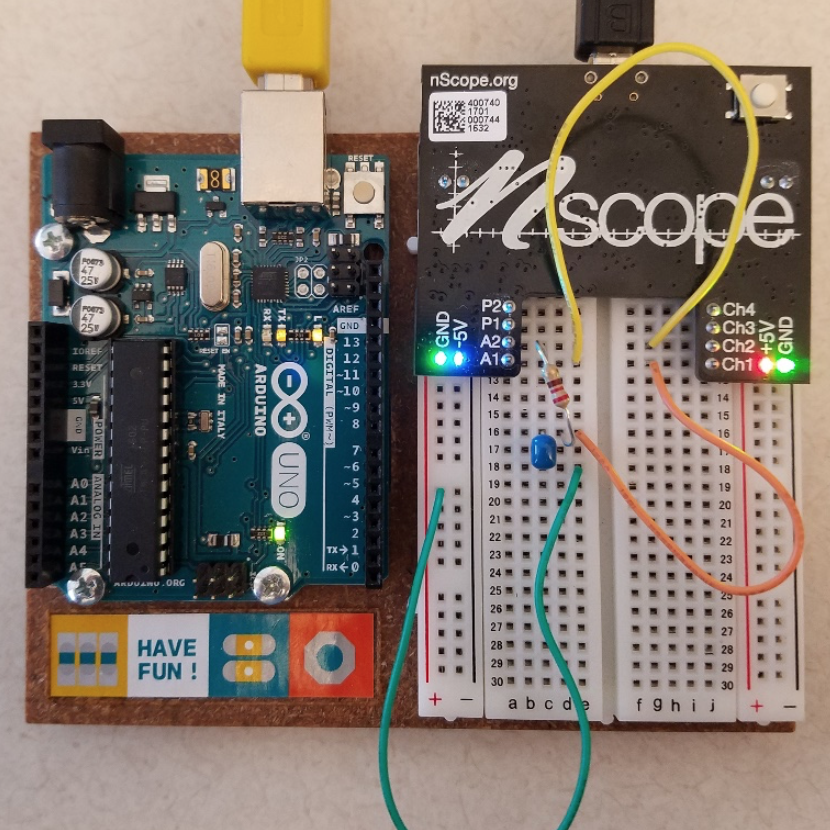
Figure 2: NScope Low Pass Filter Connections
Open the NScope software and turn Ch2 On. Now turn the analog output A1 On, set the amplitude to 4.75 V and the frequency to 1 Hz. Adjust the time scale so that the sine waves are clearly visible. You should have something that looks like Figure 3.
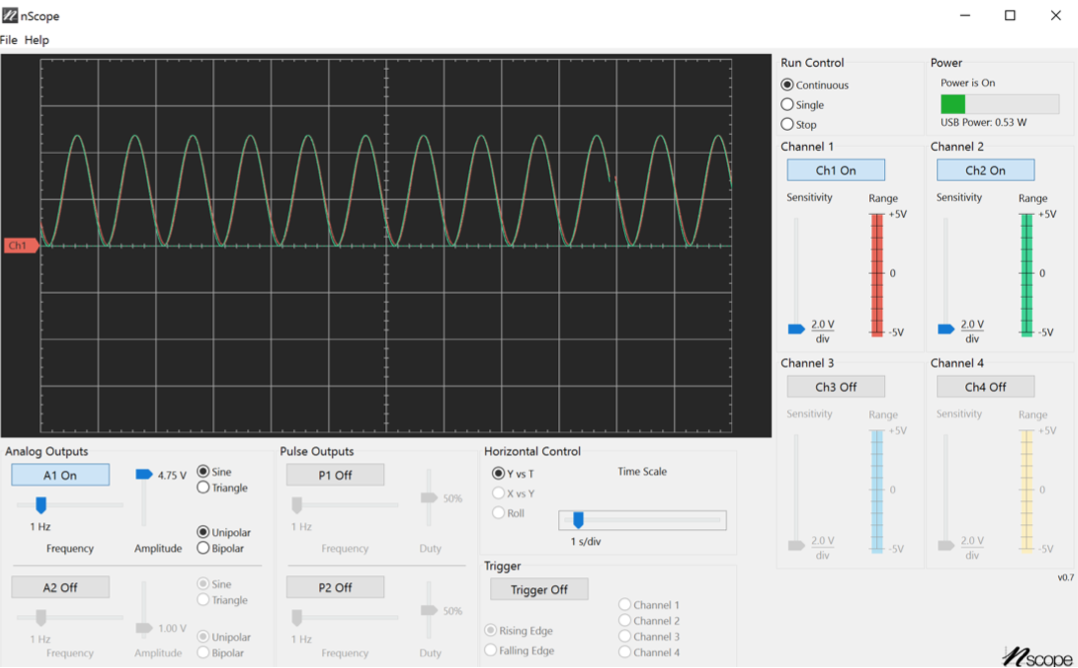
Figure 3: LPF 1 Hz Input
The low pass filter has a bandwidth of
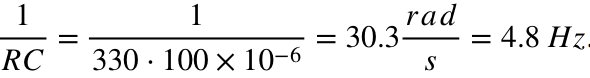 The response at 1 Hz is below the bandwidth, and hence the LPF output closely matches the input waveform.
Now adjust the input frequency to 5 Hz and observe the results, adjusting the time scale to keep the waveform visible. At 5 Hz the magnitude should change slightly and a noticeable phase shift should develop. Increasing the frequency to 50 Hz shows a much decreased output that is shifted approximately 90 degrees in phase. This is what you should expect based on what we've studied in class!
Increasing the frequency to a much higher range shows that the output changes to a constant that is equal to the average value of the sine wave (~2.5 V for a 4.75 V unipolar sine wave input).
Your turn...
Modify the circuit so that it is a high pass filter. Pass sine waves of various frequencies through the filter and observe the response on the NScope display. Change the waveform from sine to triangle and observe the effects over frequency. What happens to the average value?
Part 2: NScope + Arduino
Load the provided Lab 2 code to the Arduino. The code outputs a PWM value to pin 11 that gradually increases and then decreases over time.
Reconfigure your circuit such that the lowpass filter input and NScope Ch 2 are connected to Arduino pin 11. Zoom in in time until you can see the duty cycle changing as in Figure 4. Now turn Ch 1 off and zoom out in time until you see the average waveform, which is a triangle wave as in Figure 5.
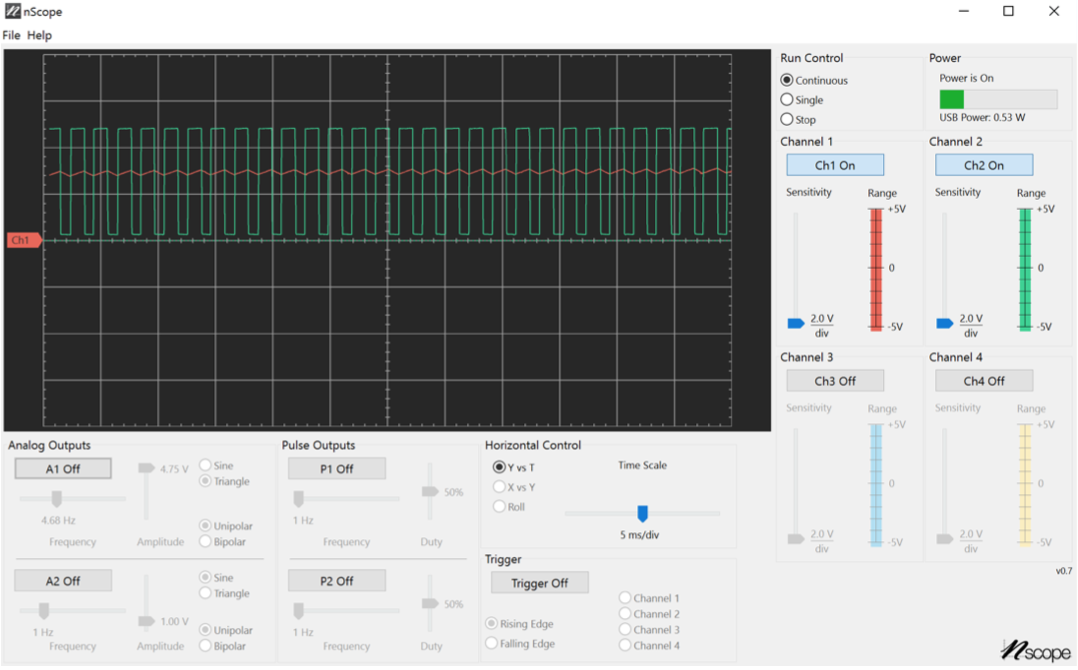
Figure 4: PWM Waveform Zoom In.
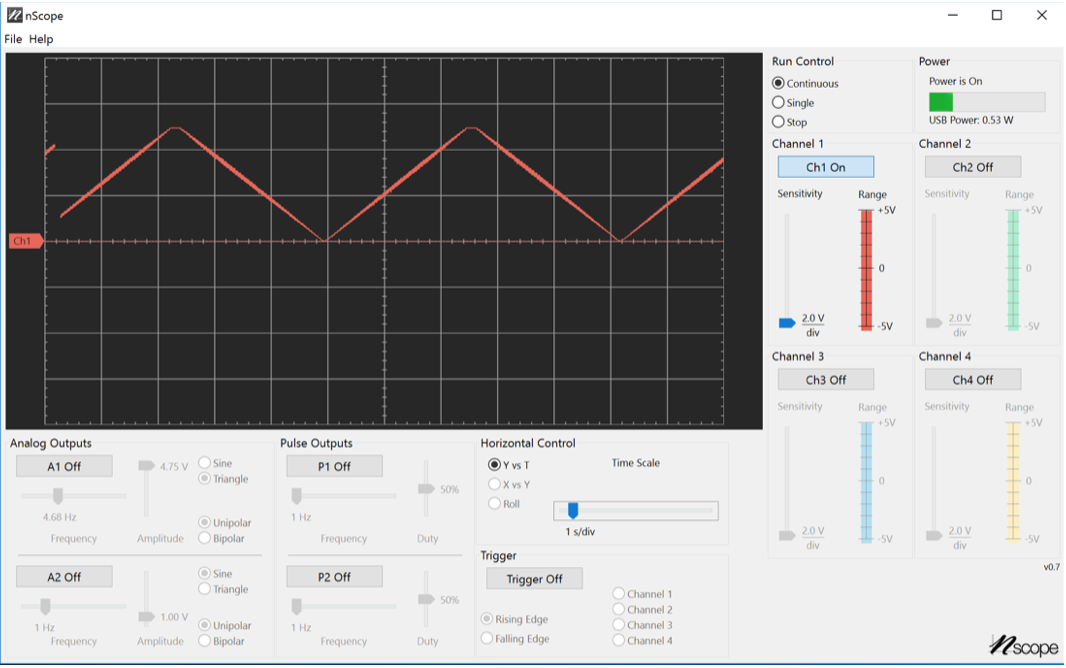
Figure 5: Triangle Wave Average Waveform
Your turn...
The fact is that the systems we're trying to control with PWM act like a low pass filter, and that's why it works. If they don't act like a low pass filter (or if the bandwidth is too high), the fundamental premise breaks down. That's why most decent PWM's operate in the Khz range, not 490 Hz as on the Arduino pin 11. Do the following:
1] Switch the code to operate PWM on pin 5 in addition to 11.
2] Connect pin 5 to NScope Ch3.
3] Turn off Ch 1 in the NScope software and visually compare Ch 2 with Ch 3.
What's the difference? It might be easiest to run it in Single mode (under Run Control) to see this.
Part 3: Arduino
Your turn...
Using what you learned in Lab 1, connect a potentiometer and LED to the Arduino, and modify the example code so that the LED brightness is controlled by the position of the potentiometer.
Think about the following: The LED is perfectly capable of turning on and off at the PWM frequency, so what low pass filter is causing the brightness to look like it's changing?
1] When you're done thinking, take a look at what seemed to be randomly bolded words/letters at the top of the lab for the answer.
2] Show your system to the TA.
3] That's it!