1. Exploring Loss Functions
I fit each shape for 100,000 steps. Final loss: voxel 1.01×10⁻⁷, point 1.93×10⁻⁴, and mesh 3.04×10⁻⁴.
1.1 Voxel fitting


1.2 Point-cloud fitting


1.3 Mesh fitting


The mesh starts as a sphere. Its fixed topology makes thin legs and holes hard to fit.
2. Reconstructing 3D from a Single View
| Representation | Precision@0.05 | Recall@0.05 | F1@0.05 |
|---|---|---|---|
| Voxel | 67.34 | 48.68 | 52.85 |
| Point cloud | 80.33 | 79.75 | 78.90 |
| Mesh | 67.27 | 74.49 | 70.30 |
Point cloud works best because each point can move freely. Mesh is smooth but has fixed connectivity. Voxels lose thin parts at 32³ resolution.
2.1 Image to voxel grid
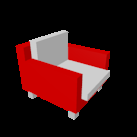
F1@0.05: 52.85
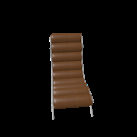
Three test examples


2.2 Image to point cloud
F1@0.05: 78.90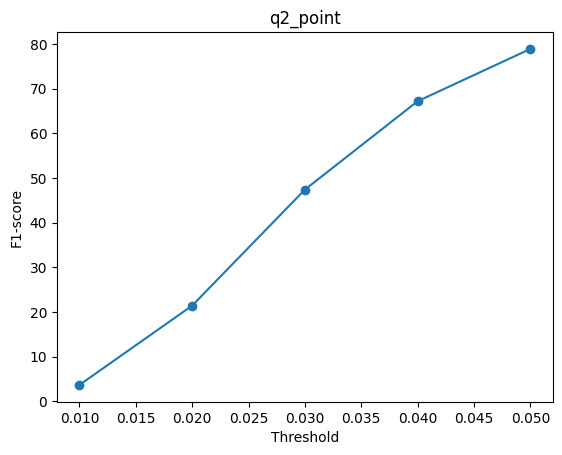
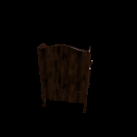
Three test examples
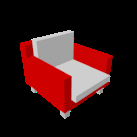


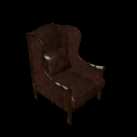


2.3 Image to mesh
F1@0.05: 70.30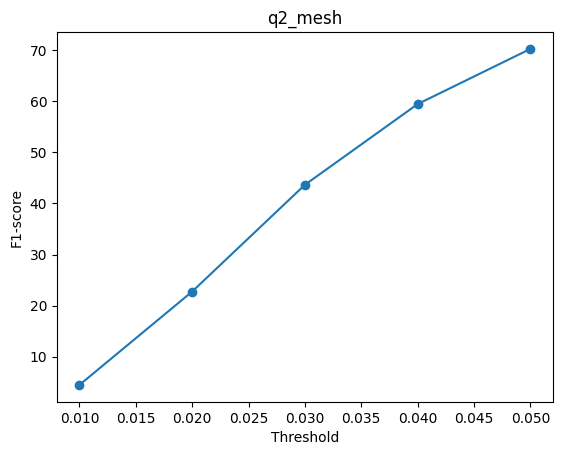
Three test examples


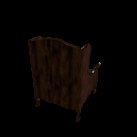


2.4 Effect of Mesh Smoothness Weight
I changed only the mesh smoothness weight. Each model trained for 10,000 steps.
| Smoothness weight | Precision@0.05 | Recall@0.05 | F1@0.05 |
|---|---|---|---|
| 0.0 | 74.00 | 77.14 | 75.03 |
| 0.1 | 70.83 | 76.28 | 73.13 |
| 1.0 | 69.00 | 71.98 | 70.09 |
A larger smoothness weight gives a lower F1 score. It makes sharp chair parts harder to fit. Weight 0.0 works best here.
2.5 Interpreting the Models
I computed the gradient of the loss with respect to the input. Each plot shows the 20 pixels with the largest gradient.
Voxel
Mean gradient 3.80×10⁻⁴; max 6.61×10⁻³.
Point
Mean gradient 1.23×10⁻⁵; max 3.13×10⁻⁴.
Mesh
Mean gradient 4.72×10⁻⁵; max 8.09×10⁻⁴.
The points form small groups around useful image regions. The voxel model has the largest gradients because it predicts a dense grid.
3. Additional Architectures and Data
3.1 Implicit occupancy decoder
F1@0.05: 44.41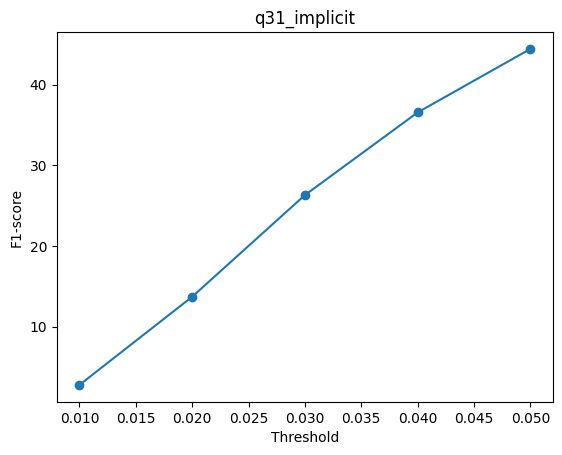
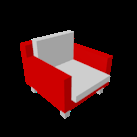
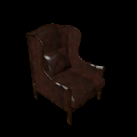
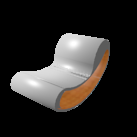
The implicit model has 68.12 precision and 39.15 recall. It misses many occupied cells. Some outputs are empty, so its F1 is lower than the voxel model.






3.2 Parametric point decoder
F1@0.05: 72.52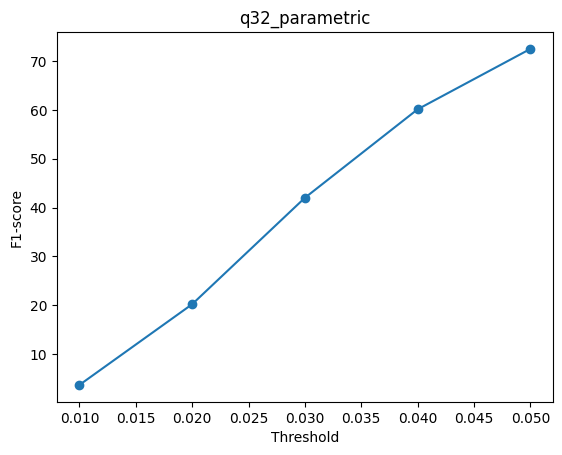
This model maps 2D samples to 3D points. Its F1 is 72.52. The normal point decoder is better because its points can move more freely.




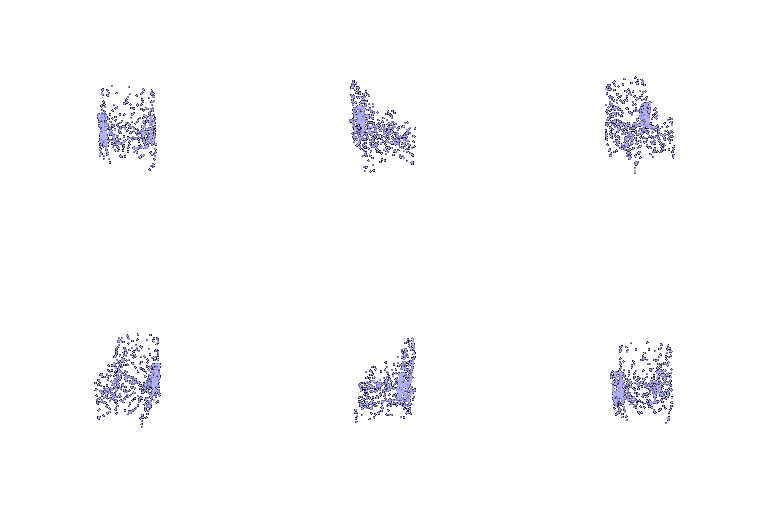

3.3 One class versus three classes
| Training/evaluation setting | F1@0.05 |
|---|---|
| Chair-only model → chair test | 79.238 |
| Three-class model → same chair test | 79.218 |
| Three-class model → full test | 87.528 |
| Three-class airplane / car / chair | 96.122 / 92.995 / 79.427 |

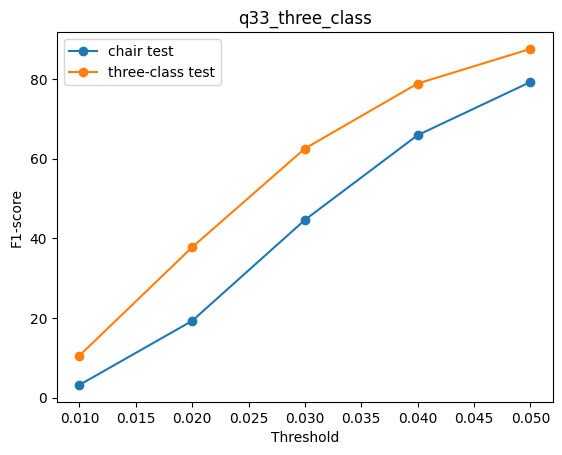
The chair score changes from 79.238 to 79.218. The change is very small. Training on three classes learns cars and planes without hurting the chair result.
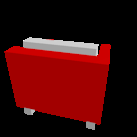
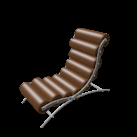
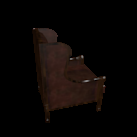
Qualitative chair examples