
Name: Yu-Rou Tuan
Andrew ID: yurout
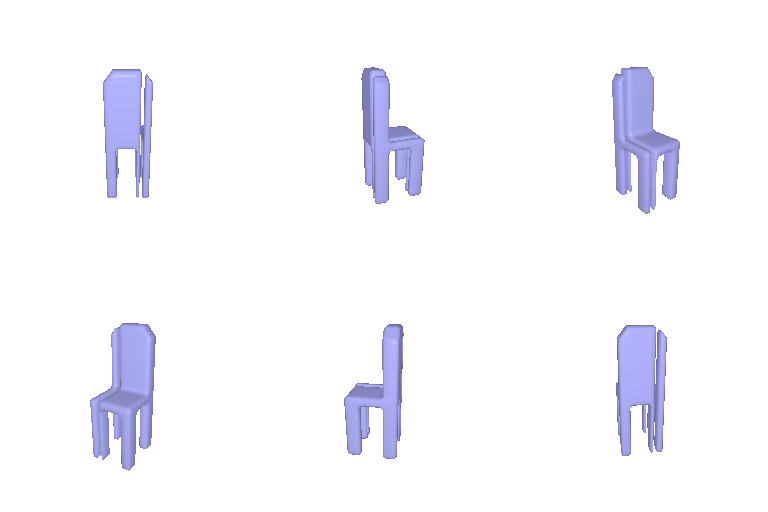
| Optimized | Ground truth |
|---|---|
| |
Each voxel is occupied or not, so I used binary cross entropy on the logits xi with pi = σ(xi):
LBCE = − (1/N) ∑i [ yi log pi + (1 − yi) log(1 − pi) ]
| Optimized | Ground truth |
|---|---|
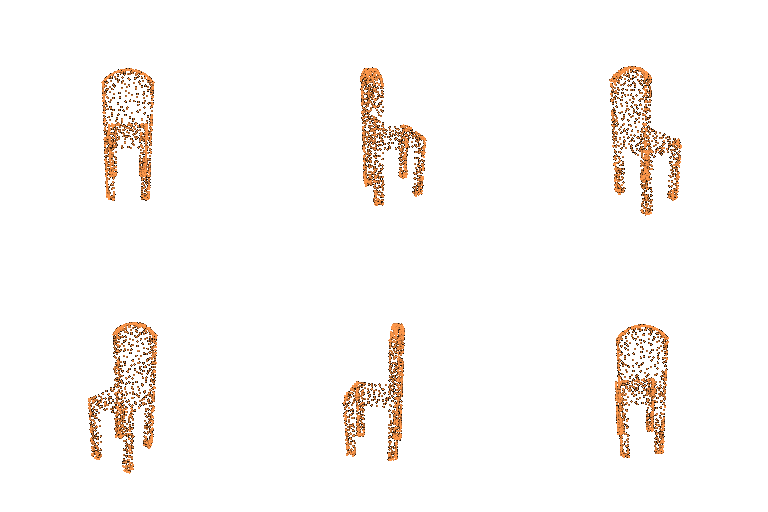 |  |
Chamfer distance, nearest neighbor in both directions:
LCD(P, Q) = (1/|P|) ∑p∈P minq∈Q ‖p − q‖2 + (1/|Q|) ∑q∈Q minp∈P ‖q − p‖2
The first term keeps predicted points close to the target, the second makes sure the whole target gets covered.
| Optimized | Ground truth |
|---|---|
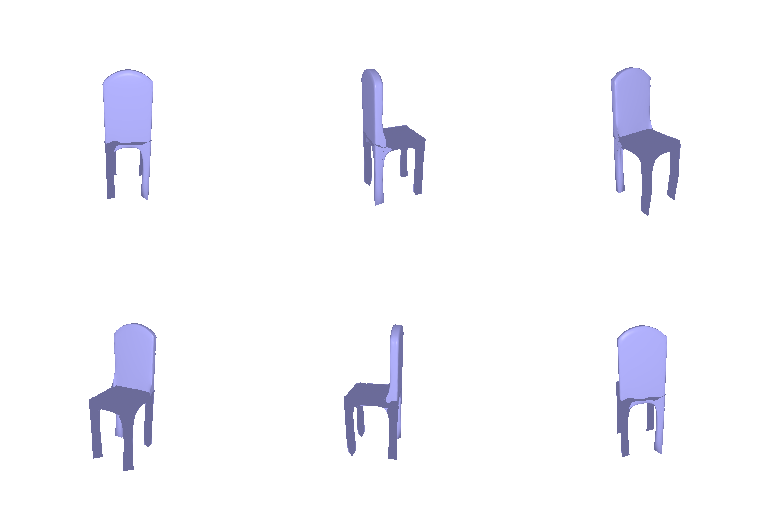 |  |
Chamfer on points sampled from both meshes, plus a uniform Laplacian smoothing term that pulls each vertex toward the mean of its neighbors:
Lsmooth = (1/|V|) ∑i ‖ (1/|N(i)|) ∑j∈N(i) vj − vi ‖, L = LCD + 0.1 Lsmooth
The mesh needed a lot more iterations than voxels and points (40k vs 20k). Before that it still had spikes between the legs. When I tried a much bigger smoothness weight the legs never separated.
All models use the pretrained ResNet18 encoder (fine-tuned), Adam with lr 4e-4 and cosine decay, batch size 32. F1 is on the 678 test chairs.
Decoder: a linear layer to a 256×4×4×4 grid, then three 3D transposed convs (each with BatchNorm + ReLU) to upsample to 323, and a final conv to one logit per voxel. Trained with BCE for 20k iterations.
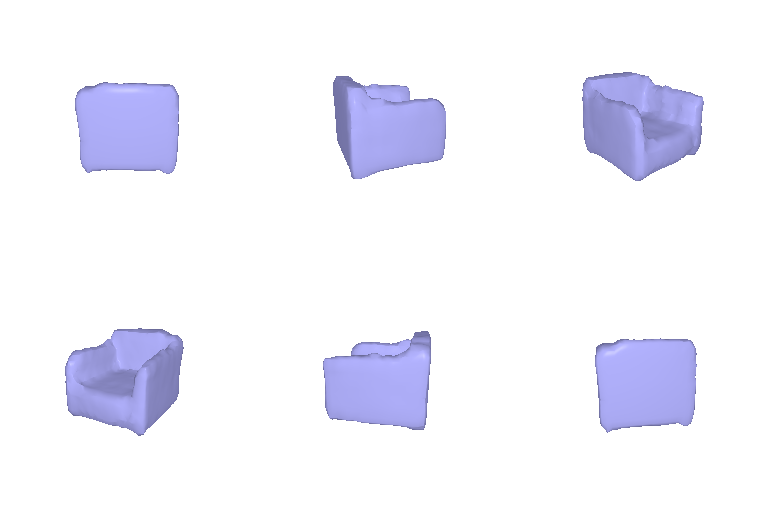
| Input | Prediction | Ground truth |
|---|---|---|
 |  |  |
 |  |  |
 |  |  |
F1@0.05 = 70.8

Decoder: MLP 512 → 1024 → 1024 → 1000×3 with ReLU, trained with Chamfer loss for 10k iterations. I first had BatchNorm in the MLP and got only 71, some test images gave exploded predictions in eval mode. Removing it fixed that.
| Input | Prediction | Ground truth |
|---|---|---|
 |  |  |
 |  |  |
 |  |  |
F1@0.05 = 80.9
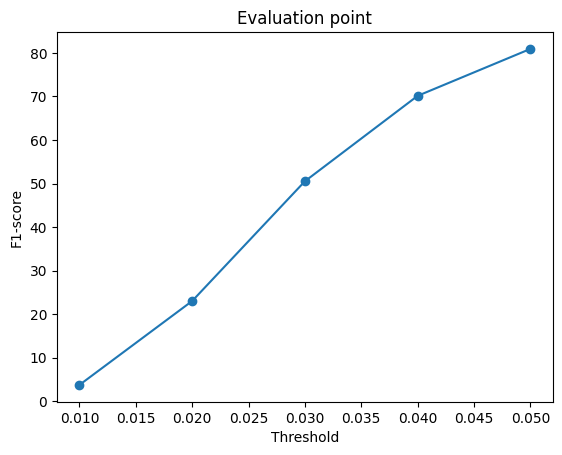
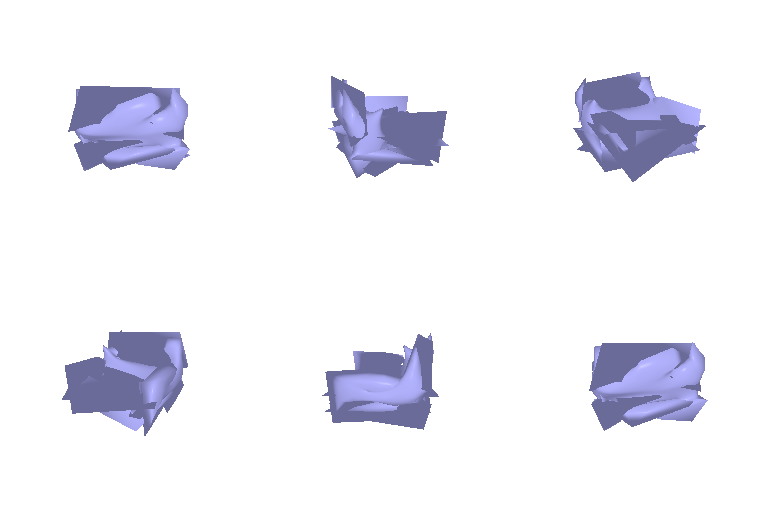
Decoder: MLP 512 → 1024 → 1024 → 2562×3 that predicts an offset for every vertex of a level-4 icosphere. I initialized the last layer to zero so training starts from the sphere. Loss is Chamfer + 0.1 × smoothness, 10k iterations.
| Input | Prediction | Ground truth |
|---|---|---|
 |  |  |
 |  |  |
 | 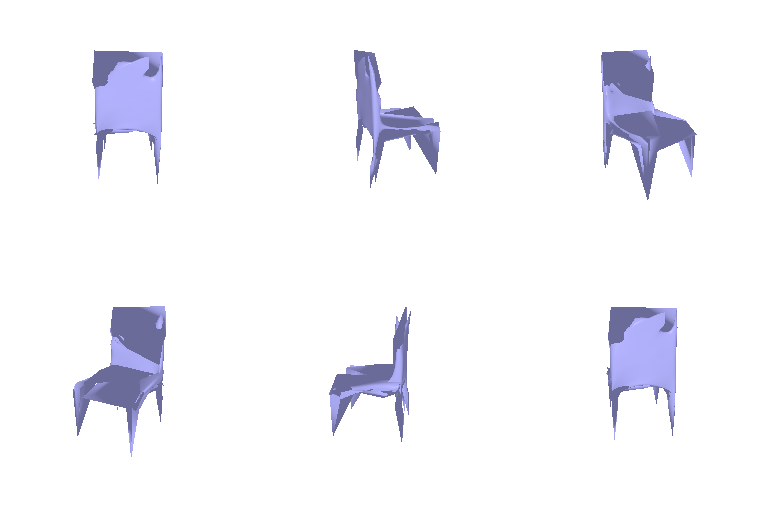 |  |
F1@0.05 = 74.5
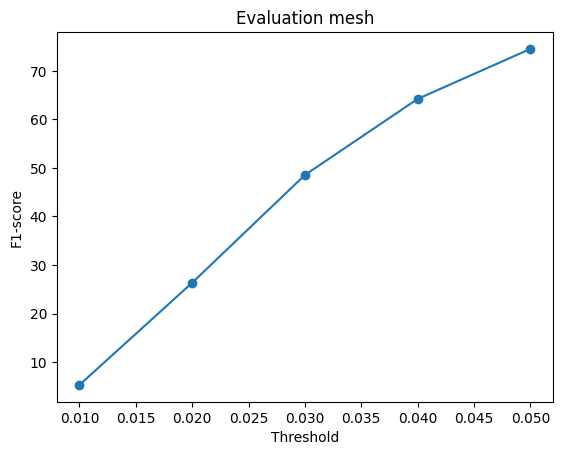
Comparison:
| F1@0.05 | |
|---|---|
| Point cloud | 80.9 |
| Mesh | 74.5 |
| Voxel | 70.8 |
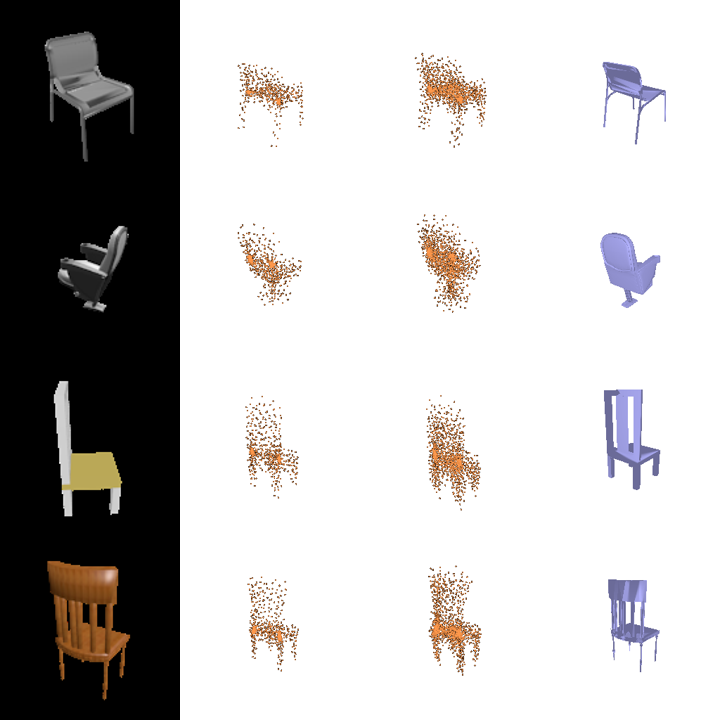
Input / voxel / point / mesh / GT:

Point clouds do best because the Chamfer loss is basically the same thing F1 measures, and the points have no other constraint, so even when the model is unsure it can spread points around the right area. The mesh is stuck with the sphere's topology, so it can't make holes between the legs and covers them with thin sheets and spikes instead. Voxels are limited by the 323 resolution: thin legs are about one voxel wide and mostly get predicted as empty. (Just feeding the GT voxels through the eval only gives around 80.) All three fail on the bench in the last row.
n_points for the point cloud model (same training otherwise):
| n_points | F1@0.05 |
|---|---|
| 1000 | 80.0 |
| 5000 | 87.5 |
Input / 1000 / 5000 / GT:
5000 points give a fuller shape, but not all of the improvement is the model. F1 itself goes up when you sample more points: the same mesh model went from 73.4 to 77.7 just by evaluating with 5000 points instead of 1000. So F1 numbers should only be compared at the same n_points.
w_smooth and number of sampled points for the mesh:
| Points, w_smooth | F1@0.05 |
|---|---|
| 1000, 0.1 | 74.5 |
| 5000, 0.3 | 74.0 |
Input / (1000, 0.1) / (5000, 0.3) / GT:

I expected more samples and more smoothing to give cleaner meshes, but it didn't really. F1 is about the same, and when I ran the same comparison earlier (with constant lr) the visual result went the other way. So in this range the randomness between runs matters more than these two settings.
Other things that made a big difference: removing BatchNorm from the point MLP (72.0 → 79.3), and for the voxel model switching from a constant lr to cosine decay and training longer (53.7 → 70.8).
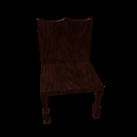
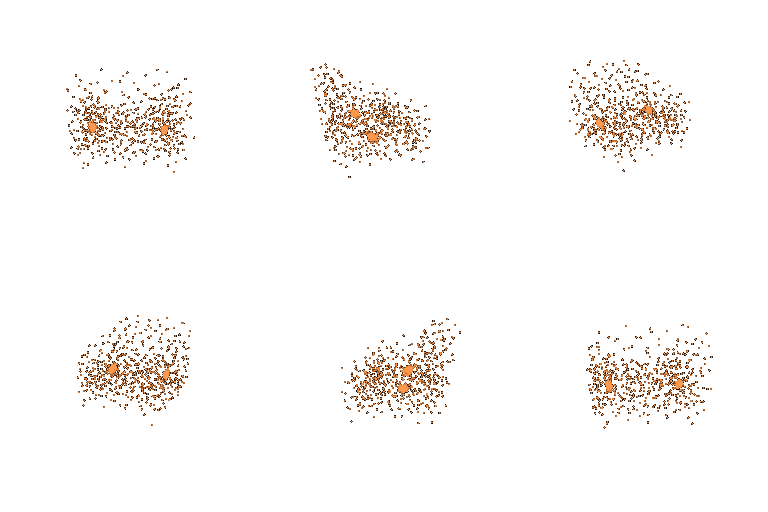
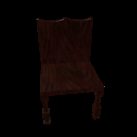
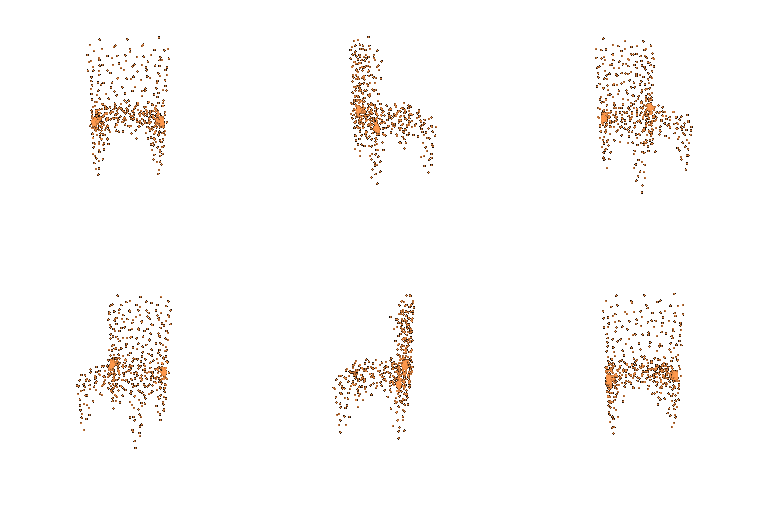
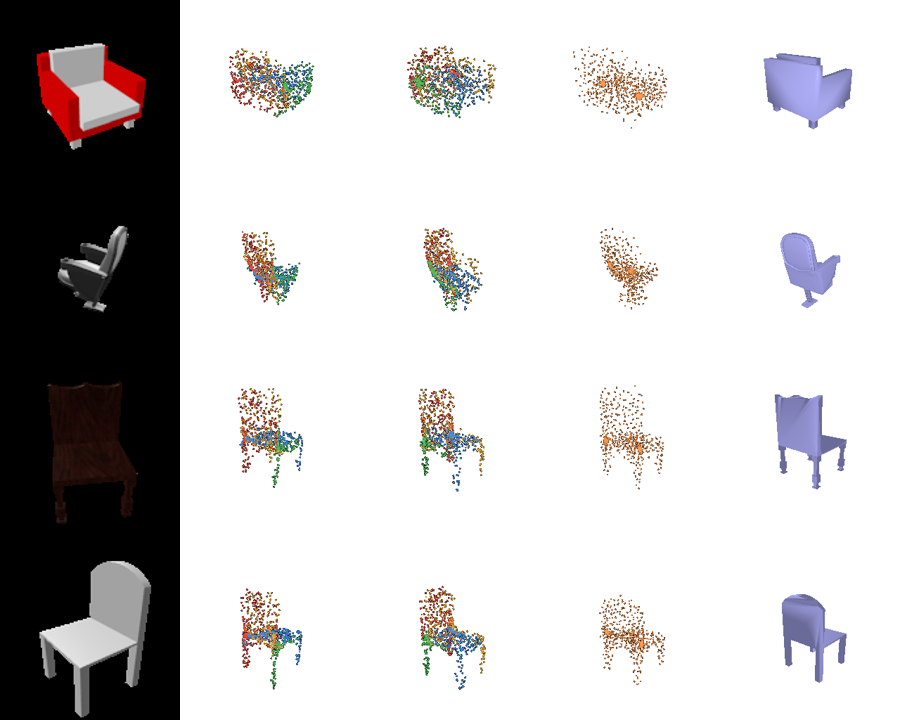
Where does each output point go? The point decoder always outputs points in the same order, even though Chamfer doesn't care about order. I colored each output index by its average position over the whole test set and used the same colors for every chair. Last column is the same with shuffled colors.
Input / colored by index (2 views) / shuffled:

The colors come out in the same smooth pattern on every chair, so each output point is basically responsible for a fixed part (e.g. the legs are always the pink/red ones). On average a point only moves about 9% of the chair size between different chairs. So the model learned something like a template chair that it deforms a bit, which also explains why weird chairs like benches fail.
Which parts of the image matter? I slid a black square over the input and measured how much the predicted point cloud changes. Red = big change.
Input / sensitivity / overlay:

Covering the background does nothing. The important regions are the top of the backrest, the front of the seat and the legs, which are basically the parts that tell how tall and deep the chair is. That fits with the template idea above.
An MLP takes the image feature z and a 3D point x and outputs an occupancy logit. I query it on a 323 grid in (−1, 1)3 and train with BCE like the voxel model. The coordinates go through a positional encoding first:
γ(x) = ( x, sin(2kπx), cos(2kπx) ), k = 0, …, 5
MLP size: (512 + 39) → 512 → 512 → 256 → 1, 10k iterations.
| Input | Prediction | Ground truth |
|---|---|---|
 |  |  |
 |  |  |
 |  |  |
F1@0.05 = 58.5 (45.3 without the positional encoding)
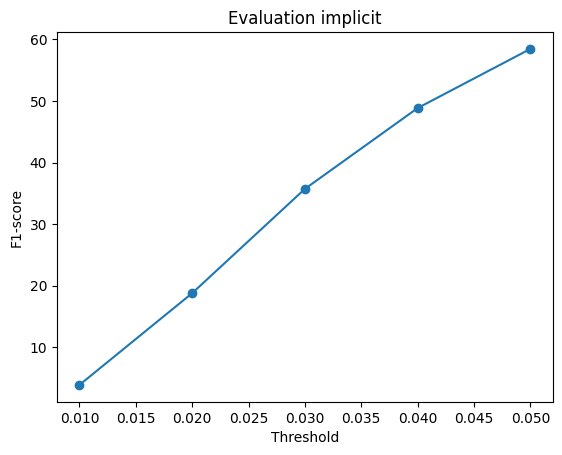
Input / no encoding / with encoding / voxel decoder / GT:

Without the encoding the MLP gives really blobby shapes and many empty predictions, since an MLP on raw xyz has a hard time learning sharp boundaries. It's still worse than the conv voxel decoder, probably because every query only sees the same global feature and nothing is shared between neighboring points. The nice part is that it could be queried at a higher resolution without retraining.
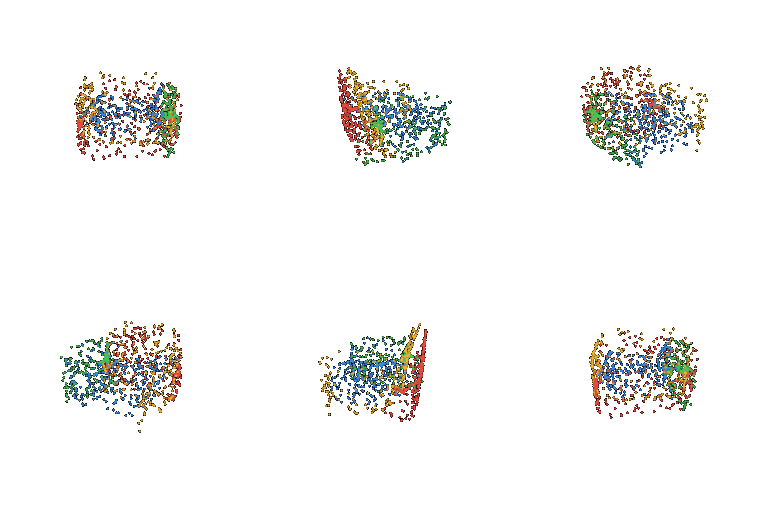
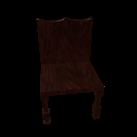
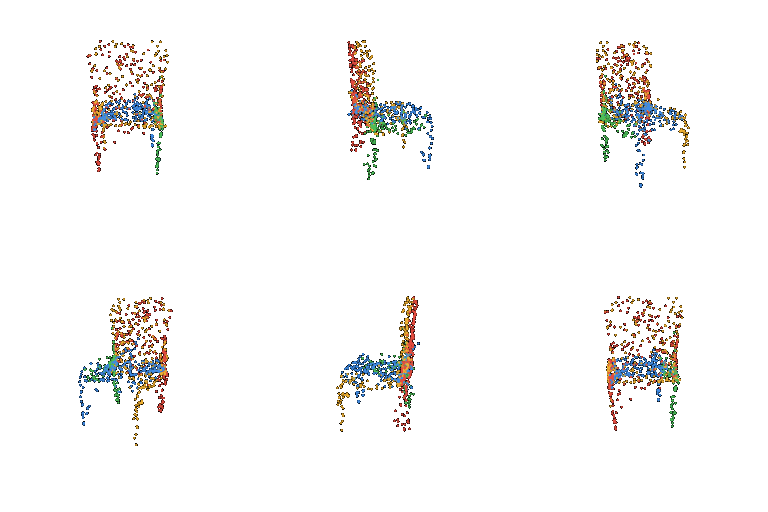
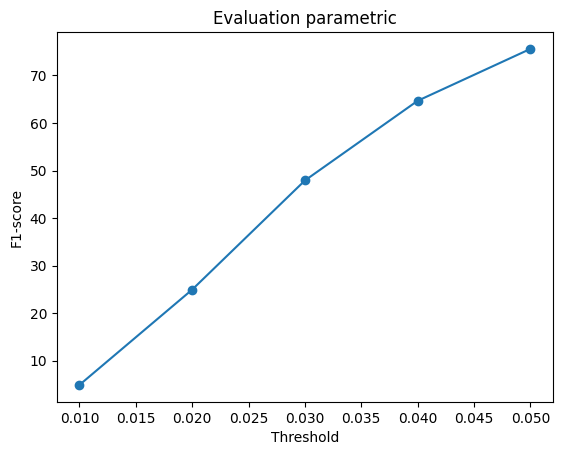
AtlasNet style with 4 patches. Each patch is an MLP gk(z, u) that maps a 2D point u in [0, 1]2 to 3D, (512 + 2) → 512 → 256 → 128 → 3. Every step I sample 250 random u per patch, so 1000 points in total, and train with Chamfer for 10k iterations.
| Input | Prediction (color = patch) | Ground truth |
|---|---|---|
 |  |  |
 |  |  |
 |  |  |
F1@0.05 = 75.6
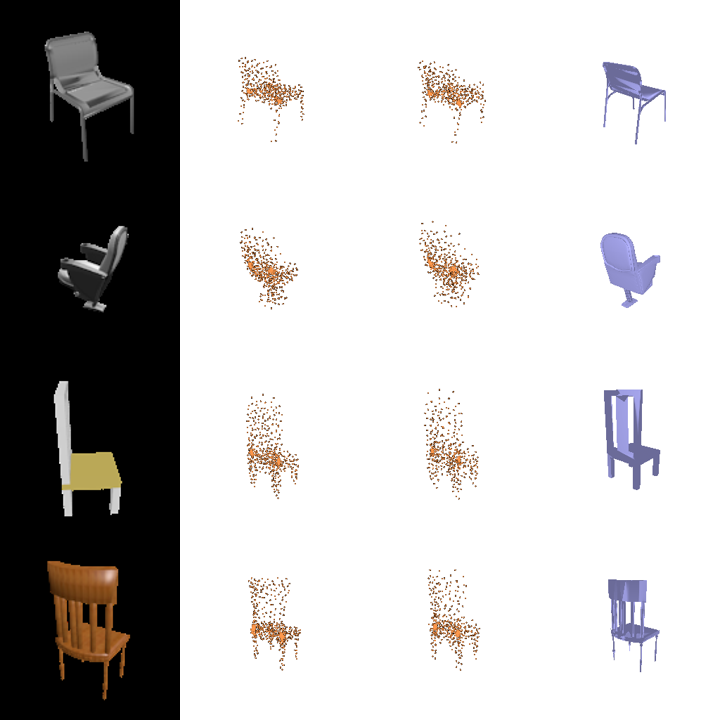
Input / parametric (2 views) / point decoder from 2.2 / GT:
The patches split the chair into parts, e.g. one takes the backrest and others take the legs. The results actually look sharper than the plain point decoder (you can see separate legs), but F1 is a bit lower. My guess is the points aren't spread evenly: some areas of a patch get squeezed and others stretched, so parts of the surface end up with few points.
I trained the point cloud model from 2.2 on chairs + cars + planes with the same settings and tested both models on the same chair test set.
| Trained on | F1@0.05 on chairs |
|---|---|
| Chairs only | 80.9 |
| 3 classes | 81.2 |
On the full 3-class test set it gets 96.4 on planes, 93.6 on cars and 80.7 on chairs.
Input / chairs only / 3 classes / GT:
3-class model on planes and cars:

On chairs the two models are basically the same (the 0.3 difference is around the eval noise), even though the 3-class model saw only about half as many chairs in the same number of iterations. The predicted chairs also look almost identical. The model clearly figures out the class first: planes get wings, cars are flat boxes. But inside a class there isn't much variety, all the cars look pretty much the same. Planes and cars still score higher than chairs because their shapes vary less, so an average shape is already close to most of them.