

Yuan Su (yuansu)
Binary cross-entropy on logits. Optimised for 10 000 steps; the fit reaches an IoU of 1.000 against the target grid.
| optimised | ground truth |
|---|---|
|
|
Chamfer distance by using knn_points.
| optimised | ground truth |
|---|---|
 |
 |
Adding smoothing over chamfer.
| optimised | ground truth |
|---|---|
 |
 |
All three models use the same frozen 512-d ResNet18 feature and were trained for 10 000 steps at batch size 32 with the default learning rate of 4e-4.
A linear layer to a 2³ volume followed by four transposed 3D
convolutions to 32³. The decoder emits logits; the evaluation applies a
sigmoid before marching cubes. I am reporting results using
pos_weight = 2.5 to make the F1 score higher, because most
of the cells are empty. Section 2.4 explains more.
| input | ground truth | prediction |
|---|---|---|
 |
 |
 |
 |
 |
 |
 |
 |
 |
Predicting (N, 3) points, where 3 means x, y, z, with a
tanh as activation.
| input | ground truth | prediction |
|---|---|---|
 |
 |
 |
 |
 |
 |
 |
 |
 |
Instead of predicting positions, predicting offsets for each point here.
| input | ground truth | prediction |
|---|---|---|
 |
 |
 |
 |
 |
 |
 |
 |
 |
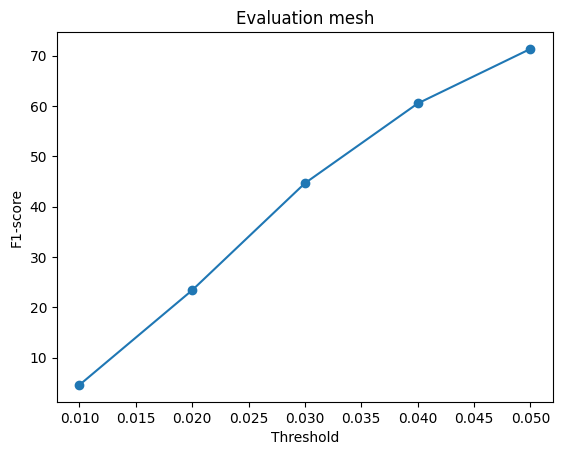
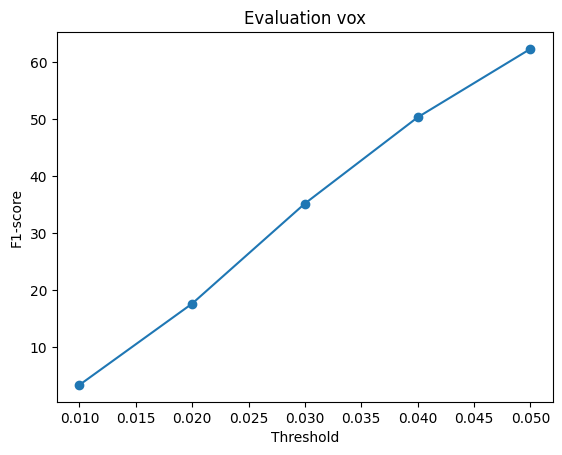
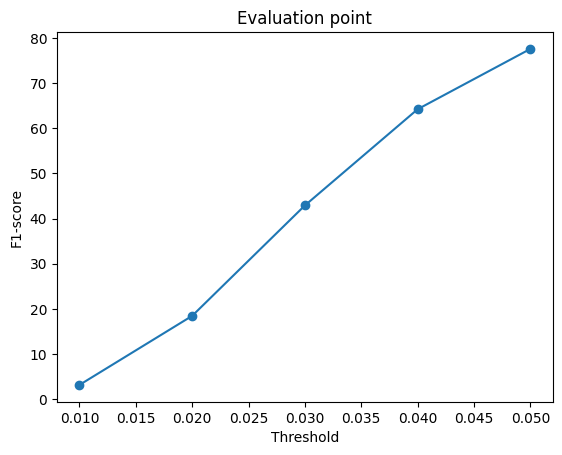
| representation | F1@0.05 | decoder parameters |
|---|---|---|
| point cloud | 77.56 | 8.8M |
| mesh | 71.35 | 18.4M |
| voxel grid | 62.28 | 1.2M |
At a glance I originally thought the point cloud was the best, because it has the highest F1 score. But when I plotted a comparison panel, the voxel output is interestingly more similar to the ground truth, in my opinion. To understand this:

Points win because nothing constrains them. A free point only has to land near the surface, so the cloud can cover the chair without ever forming one.
Meshes are held back by topology, not by placement. The prediction is a deformed sphere, so it cannot open the gaps between the legs and has to stretch a closed surface through them instead.
Voxels are held back by resolution and by the loss. A chair leg is about one cell wide on a 32³ grid, and the unweighted loss made the representation look worse than it really is until the positive term was re-weighted.
Only about 4% of the cells in a ground-truth grid are occupied, so an
unweighted BCE is minimised by predicting mostly-empty.
pos_weight re-weights the positive term. All runs are 10
000 steps, identical in every other respect.
pos_weight |
F1@0.05 | predicted occupancy | empty (200 sampled) |
|---|---|---|---|
| 1 (plain BCE) | 42.26 | 2.03% | 12% |
| 2.5 | 62.28 | 4.83% | 0% |
| 5 | 49.36 | 8.32% | 0% |
| 25 (2 500 steps only) | 14.47 | — | 0% |
| ground truth | — | 4.0% | — |
I tried with different weighted loss to penalize the model and using 2.5 is actually the best, with a F1 score of 62.28. The predicted occupancy is also the closest to GT distribution.
I followed the implementation here: https://github.com/autonomousvision/occupancy_networks/. Since implicit need query to evaluate the result and evaling all of the points is not feasible on my local compute, I decide to randomly evaluate points to construct loss term during training. In prediction, I eval all possible points to make the mesh. One thing on the implementation side is that without the ResNet block the model is struggle predicting a lot. And by using nearly identical framework as autonomousvision did the F1 score increase to near 60%.
| input | ground truth | prediction |
|---|---|---|
 |
 |
 |
 |
 |
 |
 |
 |
 |

| implicit (3.1) | explicit voxel (2.1) | |
|---|---|---|
| decoder parameters | 0.23M | 1.21M |
| F1@0.05 | 58.91 | 62.28 |
| empty predictions | 11 / 678 | 4 / 678 |
use_full_dataset = True in
dataset_location.py. The same voxel decoder was trained for
the same 10 000 steps on the three-class split (12 886 models: 6 100
chairs, 3 640 planes, 3 146 cars) and evaluated twice.
| training set | evaluated on | F1@0.05 |
|---|---|---|
| chairs only | 678 chairs | 42.26 |
| chairs + planes + cars | the same 678 chairs | 32.08 |
| chairs + planes + cars | all 1 451 test objects | 41.08 |
Both arms of this experiment use the unweighted BCE
(pos_weight = 1), so they are comparable with each other
and with the 42.26 baseline, not with the 62.28 headline number.

Qualitatively the three-class predictions are rounder and lose more structure: the armchair collapses into a single lobe, and the thin wooden chair goes from a few leg fragments to one solid slab.
I think it is somewhat expected as the original decoder is small, and by training with more classes it needs to allocate more weights to fit all possible answers. Plus the newly intorduced sets are very different from chairs, which is the reason why performance on chair degrades even with more diverse samples.
python fit_data.py --type vox   --max_iter 10001
python fit_data.py --type point --max_iter 1000 --lr 1e-2
python fit_data.py --type mesh  --max_iter 1000 --lr 1e-2

python train_model.py --type <vox|point|mesh|implicit> \
    --max_iter 10001 --save_freq 2500 --load_feat --num_workers 8
python eval_model.py  --type <...> --load_checkpoint --load_feat --vis_freq 250
--max_iter 10001 rather than 10000 so that the final
step lands on a checkpoint save; the training loop does not save after
it exits.
Compute. Everything was trained and evaluated on a
CPU-only Apple Silicon machine, so every result reported here used
--load_feat and --device cpu: the models are
trained on the pre-computed ResNet18 features shipped with the dataset
and the image encoder stays frozen.