Assignment 2: Single View to 3D
Fitting voxels, point clouds and meshes with 3D losses, then predicting each representation (plus an implicit and a parametric decoder) from a single RGB image of a ShapeNet chair.
All models use the ResNet18 image encoder trained end to end; I never used
--load_feat. Hyperparameters were always chosen on 300 training chairs held out
for validation, never on the test set. Every test chair is shown from one view picked with a
fixed seed, so all models see the same images. Each render below turns 360° in 60
frames.
1. Exploring loss functions
1.1 Fitting a voxel grid
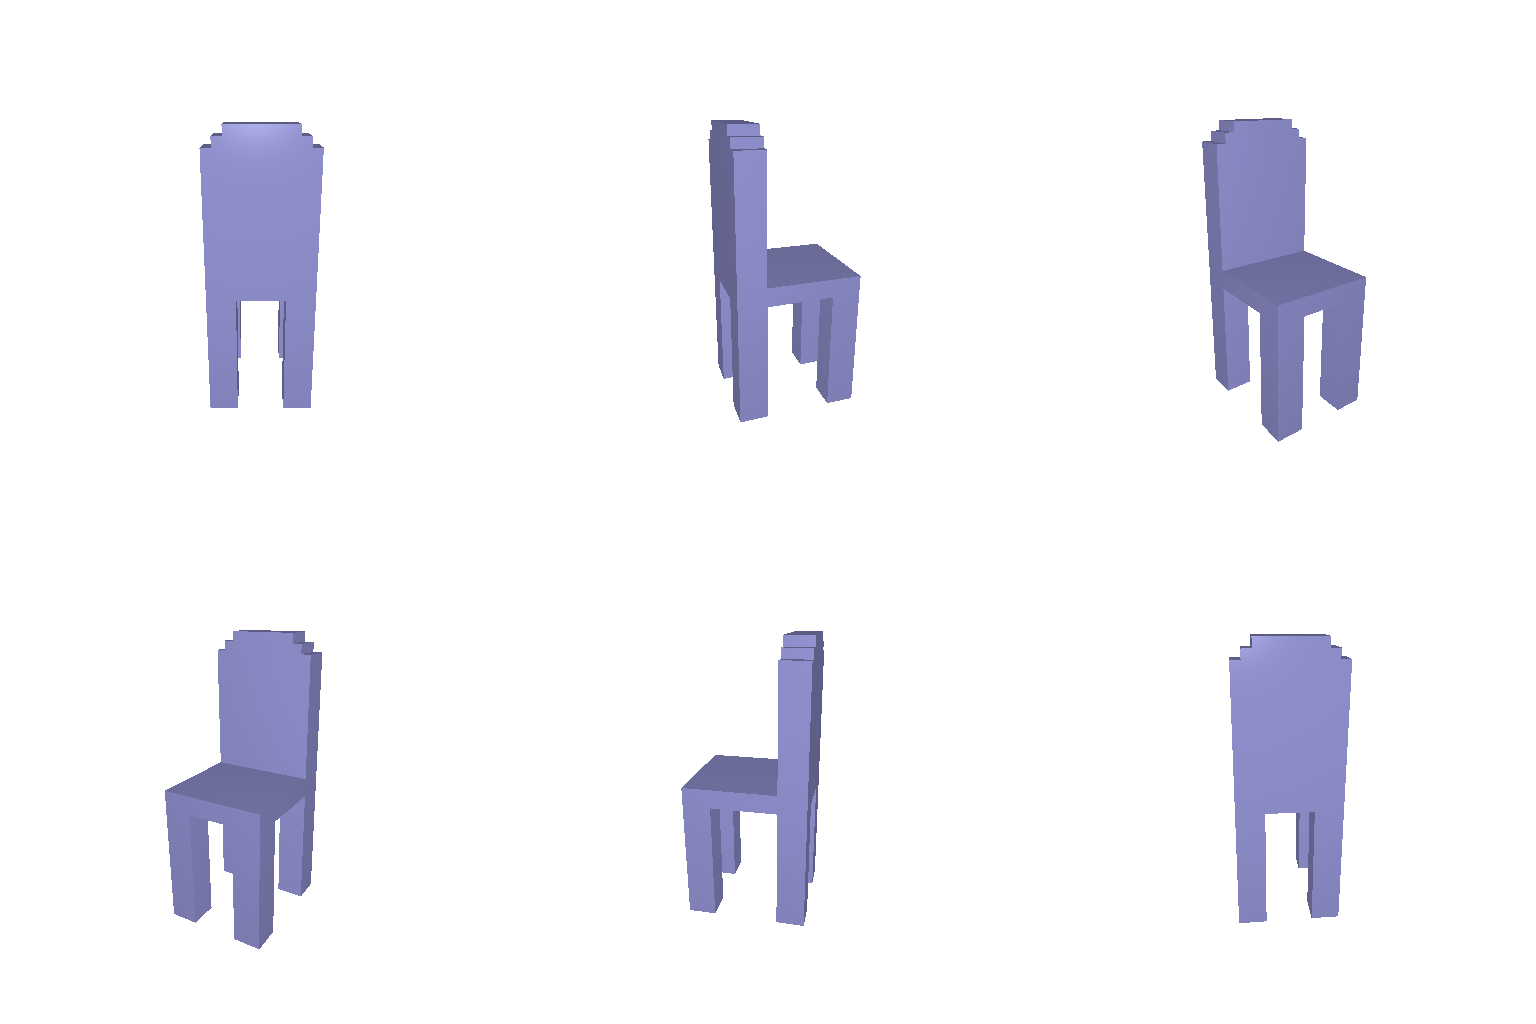
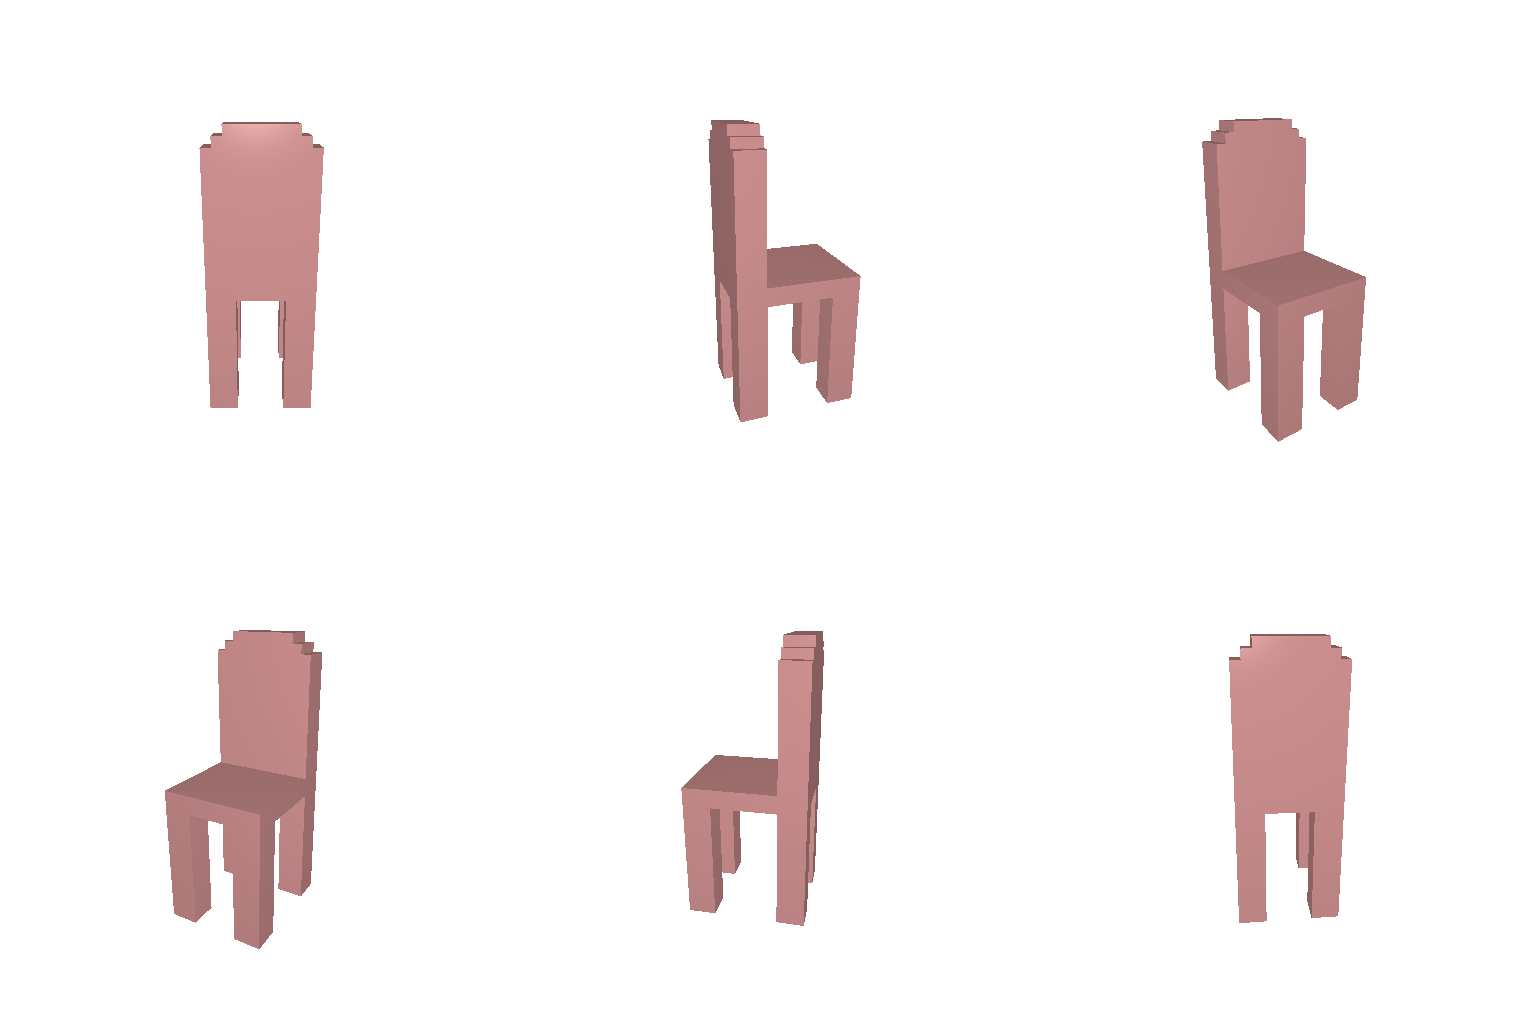
Raw 32³ voxels: every cell with occupancy above 0.5 is drawn as a cube.
Loss
voxel_loss = F.binary_cross_entropy_with_logits(voxel_src, voxel_tgt)
Evaluation
I also scored the grids against the ground-truth mesh with the Q2 metric
(compute_sampling_metrics, F1@0.05), sampling points from the marching-cubes
surface of each grid at occupancy 0.5:
| Comparison | Metric | 1,000 points (Q2 default) | 10,000 points |
|---|---|---|---|
| Fitted grid vs. GT voxel grid | IoU | 1.000 | |
| Fitted surface vs. GT mesh | F1@0.05 | 91.0 | 96.9 |
- The fitted grid matches the target exactly, so the missing F1 against the mesh is the cost of 32³ resolution, not of the loss.
- F1@0.05 also depends on the sample count: sparser samples make nearest-neighbor distances longer, so the same shape scores about 6 points higher with 10,000 points.
Voxel alignment fix
The provided R2N2 binvox grids are rotated 90° about the up axis relative to the
ShapeNet meshes. The loader now maps binvox (x, y, z) to mesh
(z, y, −x) before aligning bounding boxes, which raises voxel-to-mesh
F1@0.05 from 0.695 to 0.999.
1.2 Fitting a point cloud
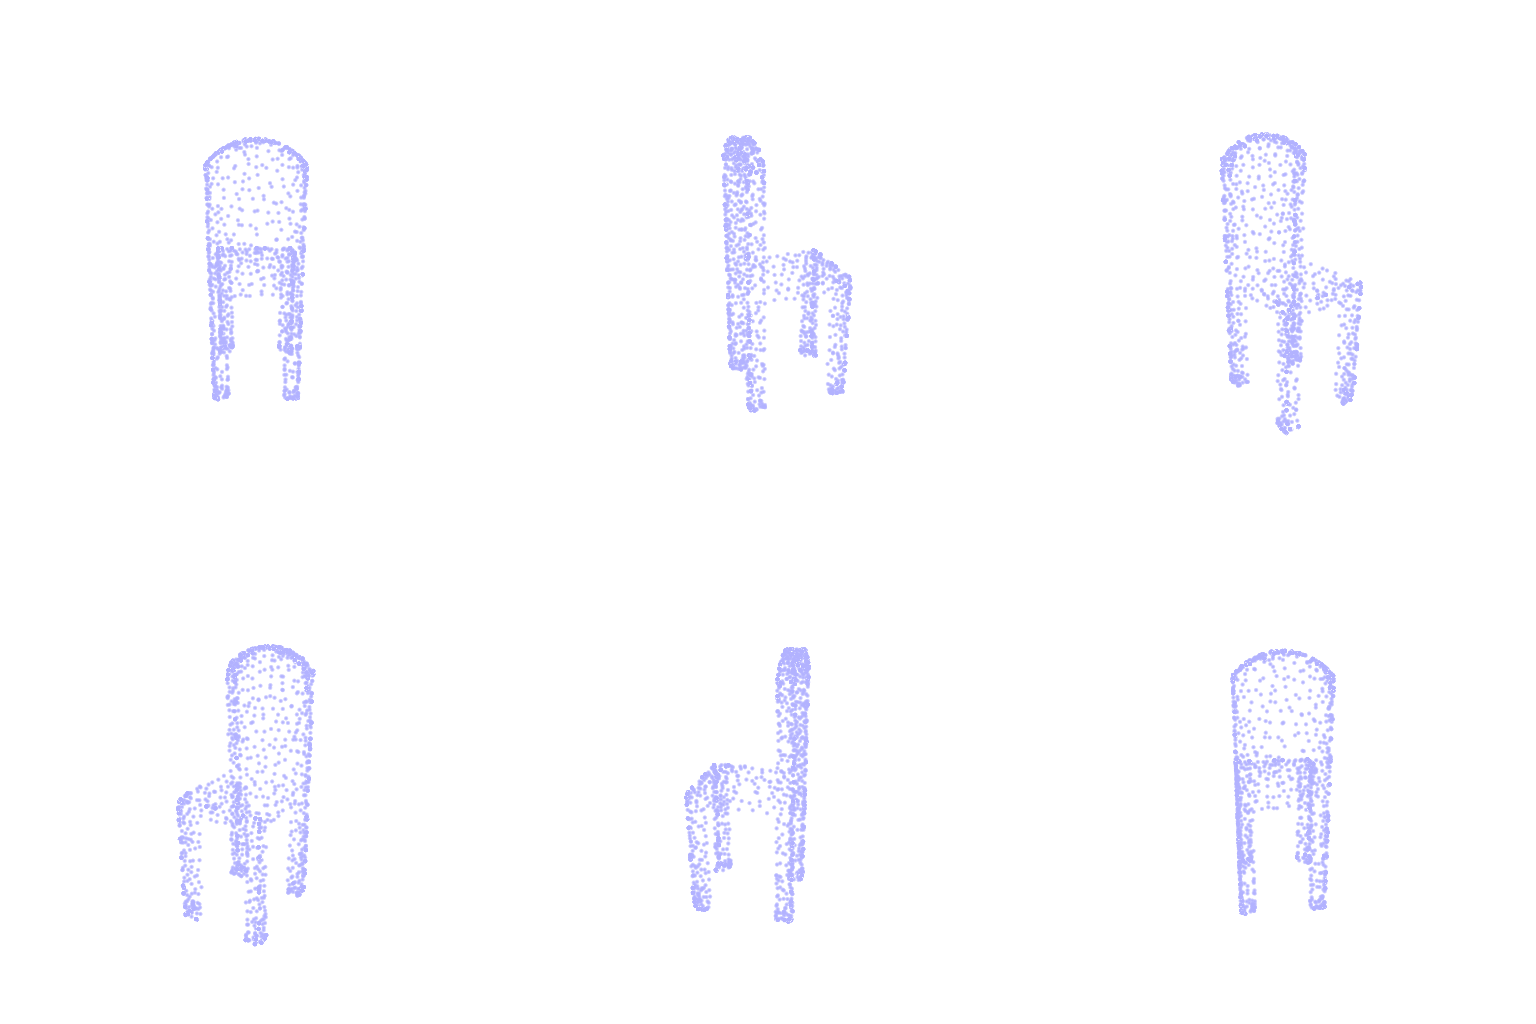
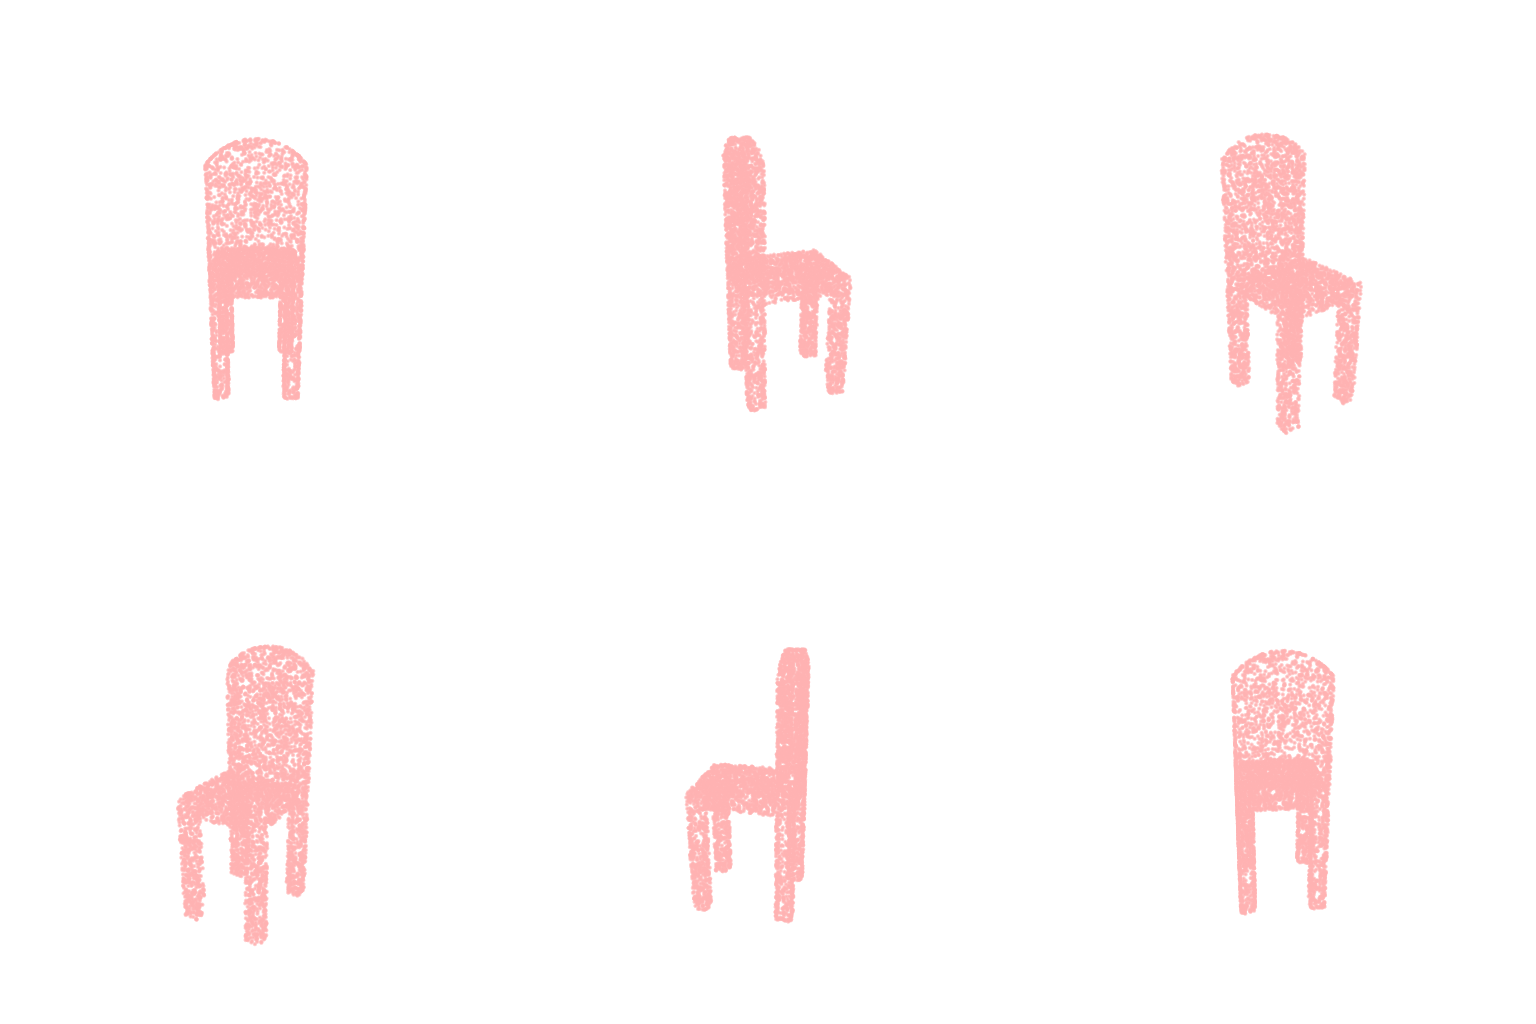
5,000 points each. The source starts as Gaussian noise; the target is sampled from the ground-truth mesh.
Loss
The squared distance from each point to its nearest neighbor in the other cloud
(knn_points, K = 1), averaged in both directions and summed:
chamfer_loss = meanp∈S minq∈T ‖p − q‖² + meanq∈T minp∈S ‖p − q‖²
Evaluation
After 30,000 Adam steps (lr 4e-4) the fitted cloud scores F1@0.05 = 100.0 against 5,000 points sampled from the mesh. 10,000 steps were not enough: a few Gaussian samples start about 4 units away, and Adam moves each point by roughly the learning rate per step.
1.3 Fitting a mesh
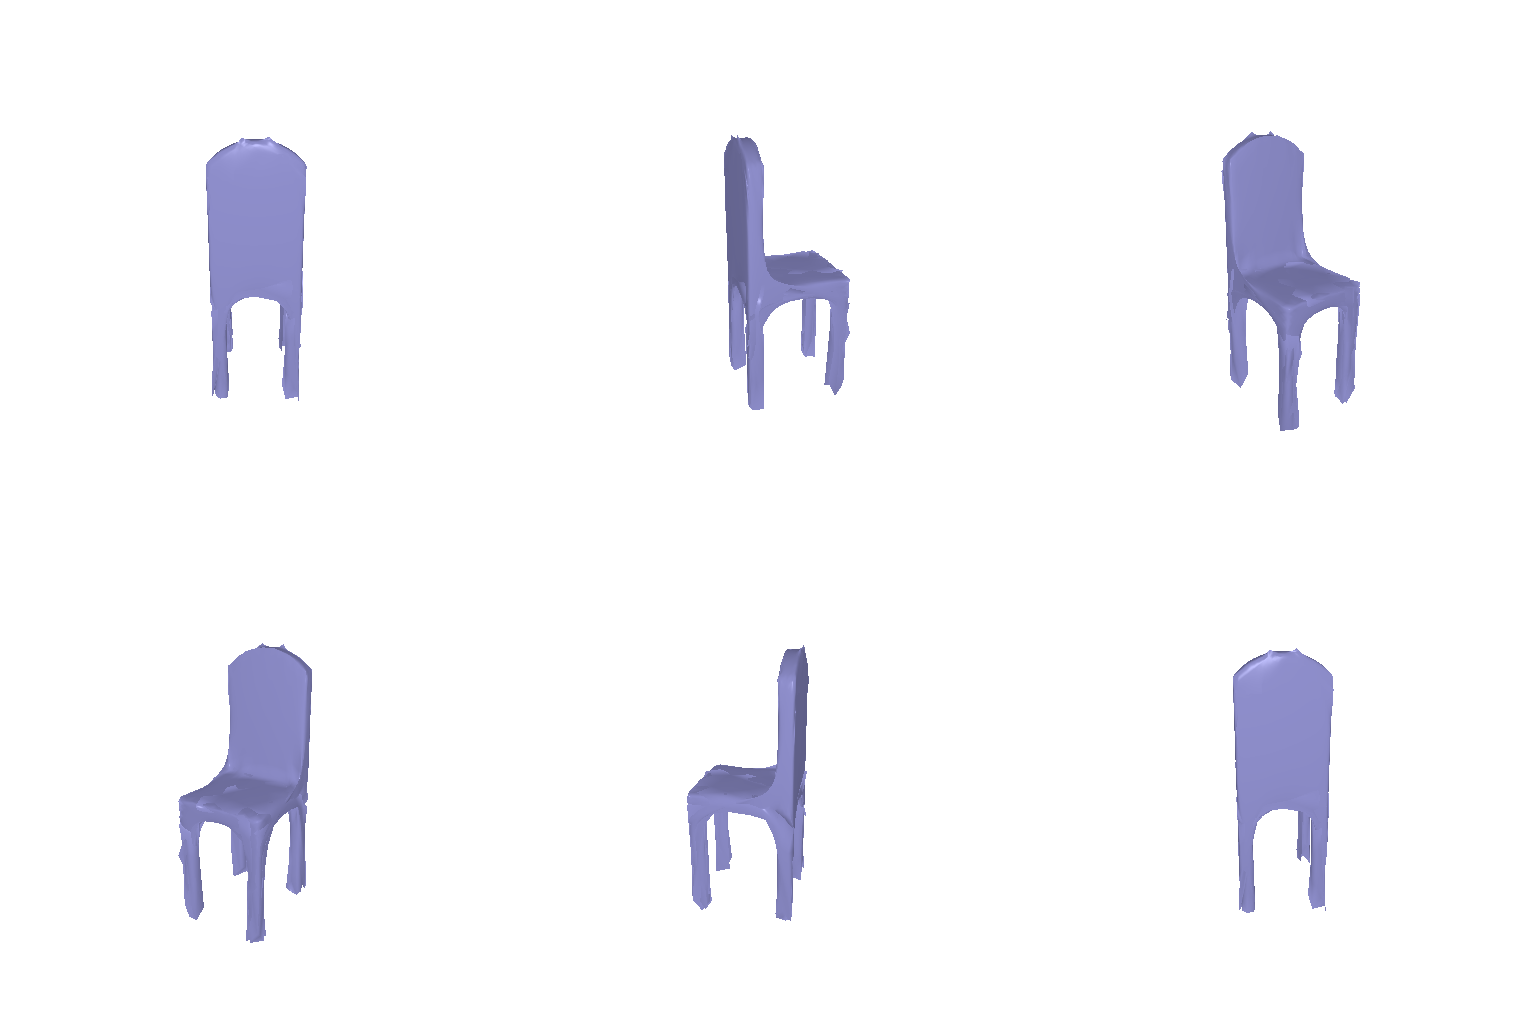
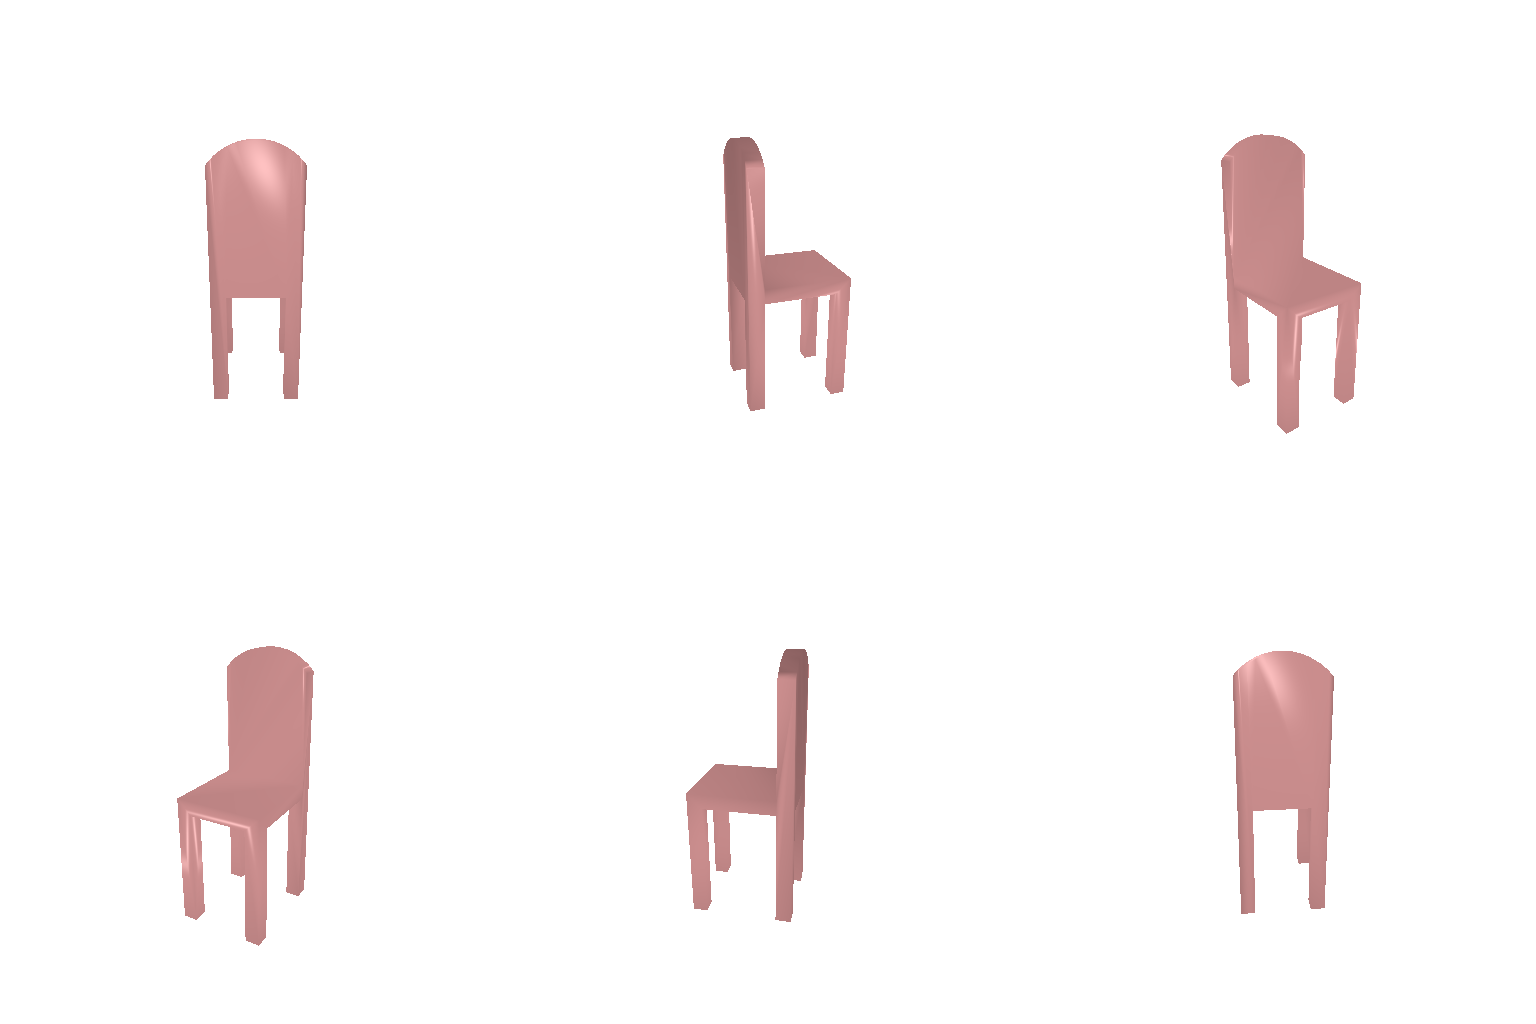
The source is a level-4 ico-sphere (2,562 vertices) deformed by a learned offset per vertex.
Loss
loss = w_chamfer · chamfer_loss + w_smooth · smoothness_loss (w_chamfer = 1.0, w_smooth = 0.1)
The chamfer term compares 5,000 points sampled from each mesh at every step.
smoothness_loss is the uniform Laplacian: the distance from each vertex to the
mean of its edge neighbors, averaged over all vertices.
Evaluation
The fit reaches F1@0.05 = 100.0 with both 1,000 and 10,000 points. The surface is still bumpier than the ground truth: the leg tips are uneven and the chair's sharp edges and flat faces are rounded off.
Comparing the three representations
| Voxel | Point cloud | Mesh | |
|---|---|---|---|
| Loss | BCE | Chamfer | Chamfer + Laplacian |
| Strength | Regular structure, simplest loss | Lightweight and precise | Continuous surface, renders directly |
| Weakness | Resolution limited by the grid | No surface, only scattered points | Topology fixed by the initial shape; needs regularization |
2. Reconstructing 3D from a single view
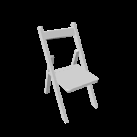
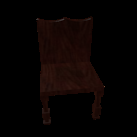
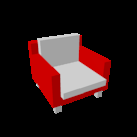
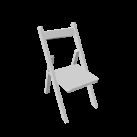
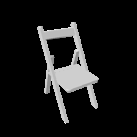
All Q2 decoders take the 512-d ResNet18 feature of one 137×137 view and train for 10,000 steps (unless noted) with batch size 32 and Adam at lr 4e-4, showing each chair from one random view out of its 10. The three test chairs below (an armchair, a folding chair and a wooden chair) and their input views are the same in every section.
2.1 Image to voxel grid
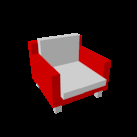
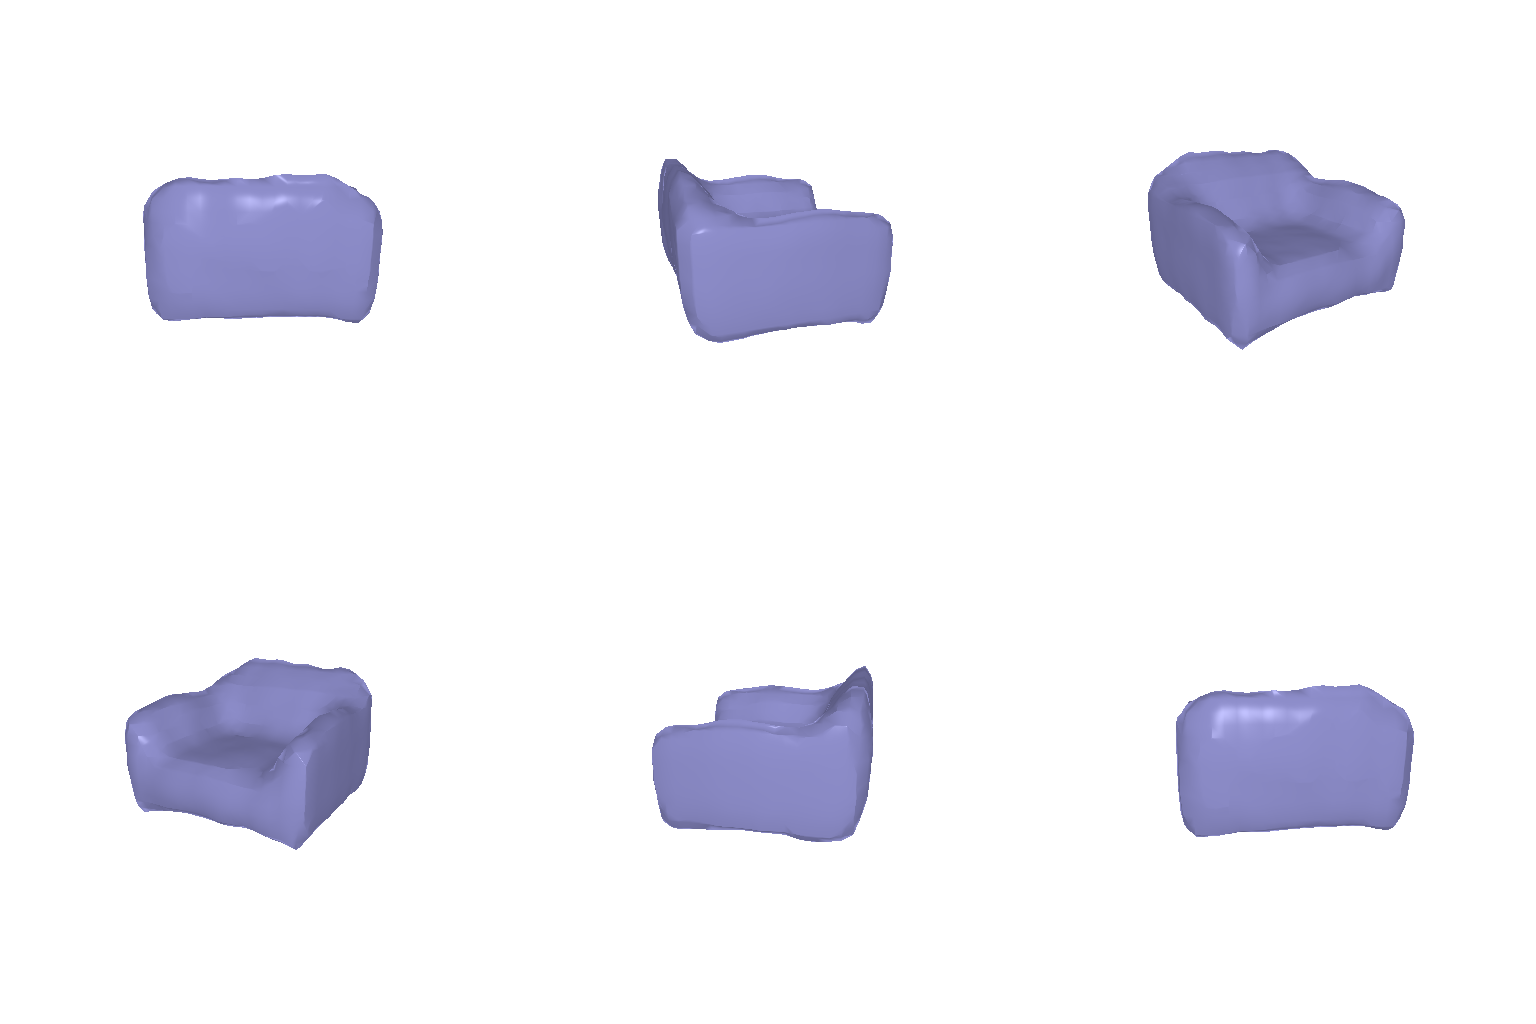
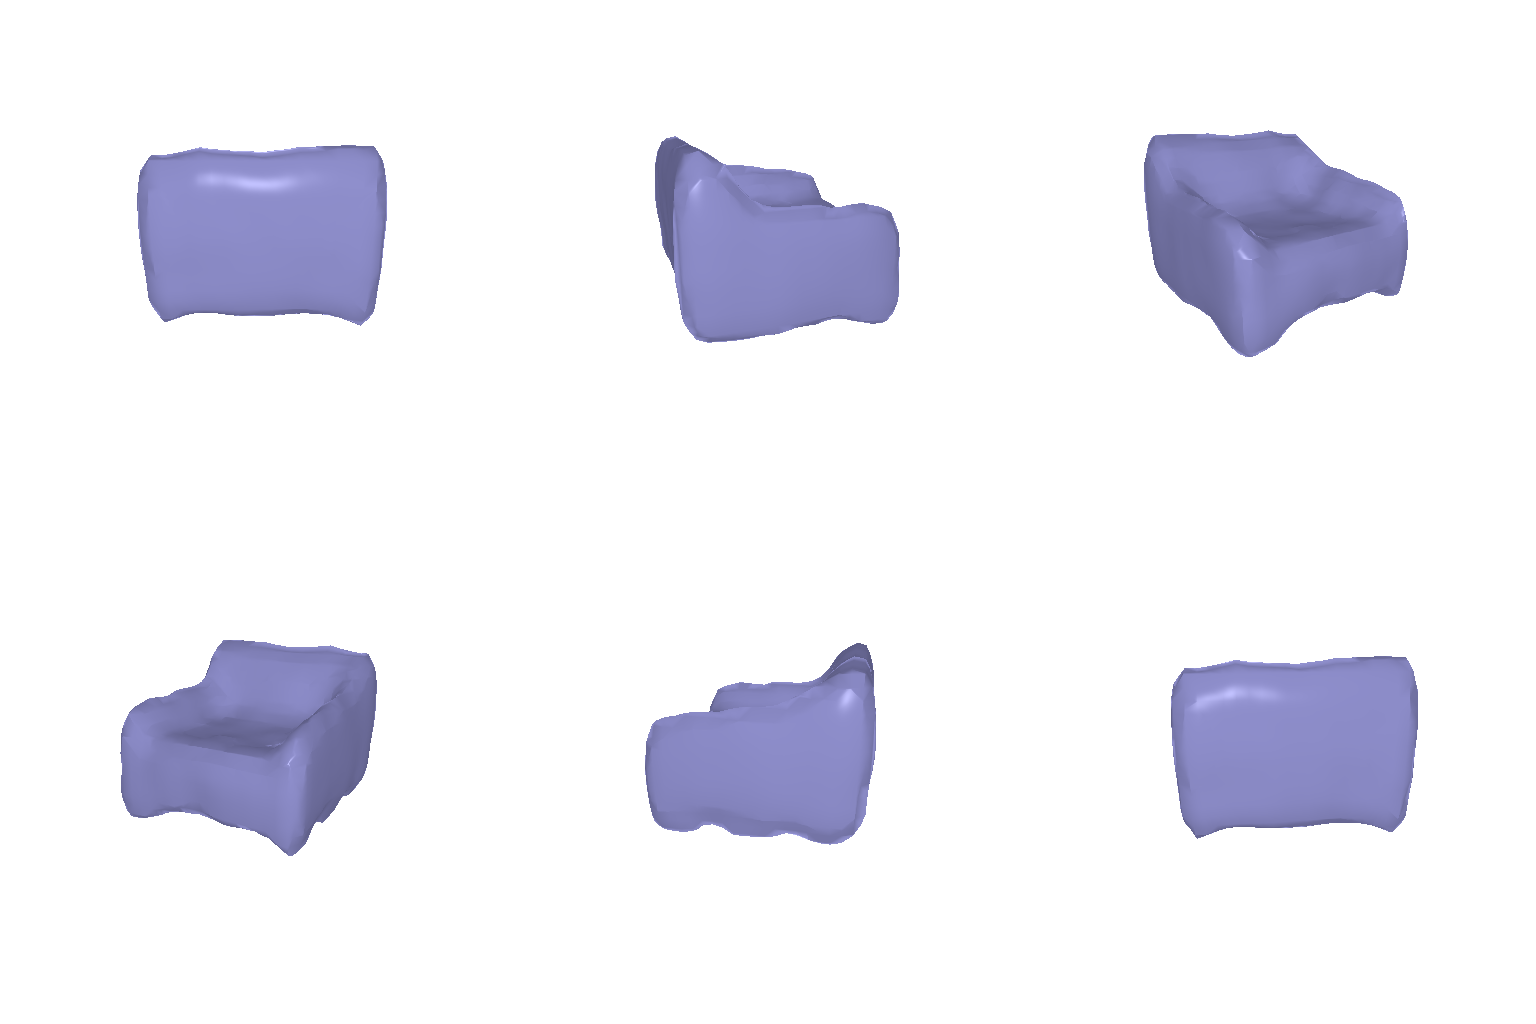
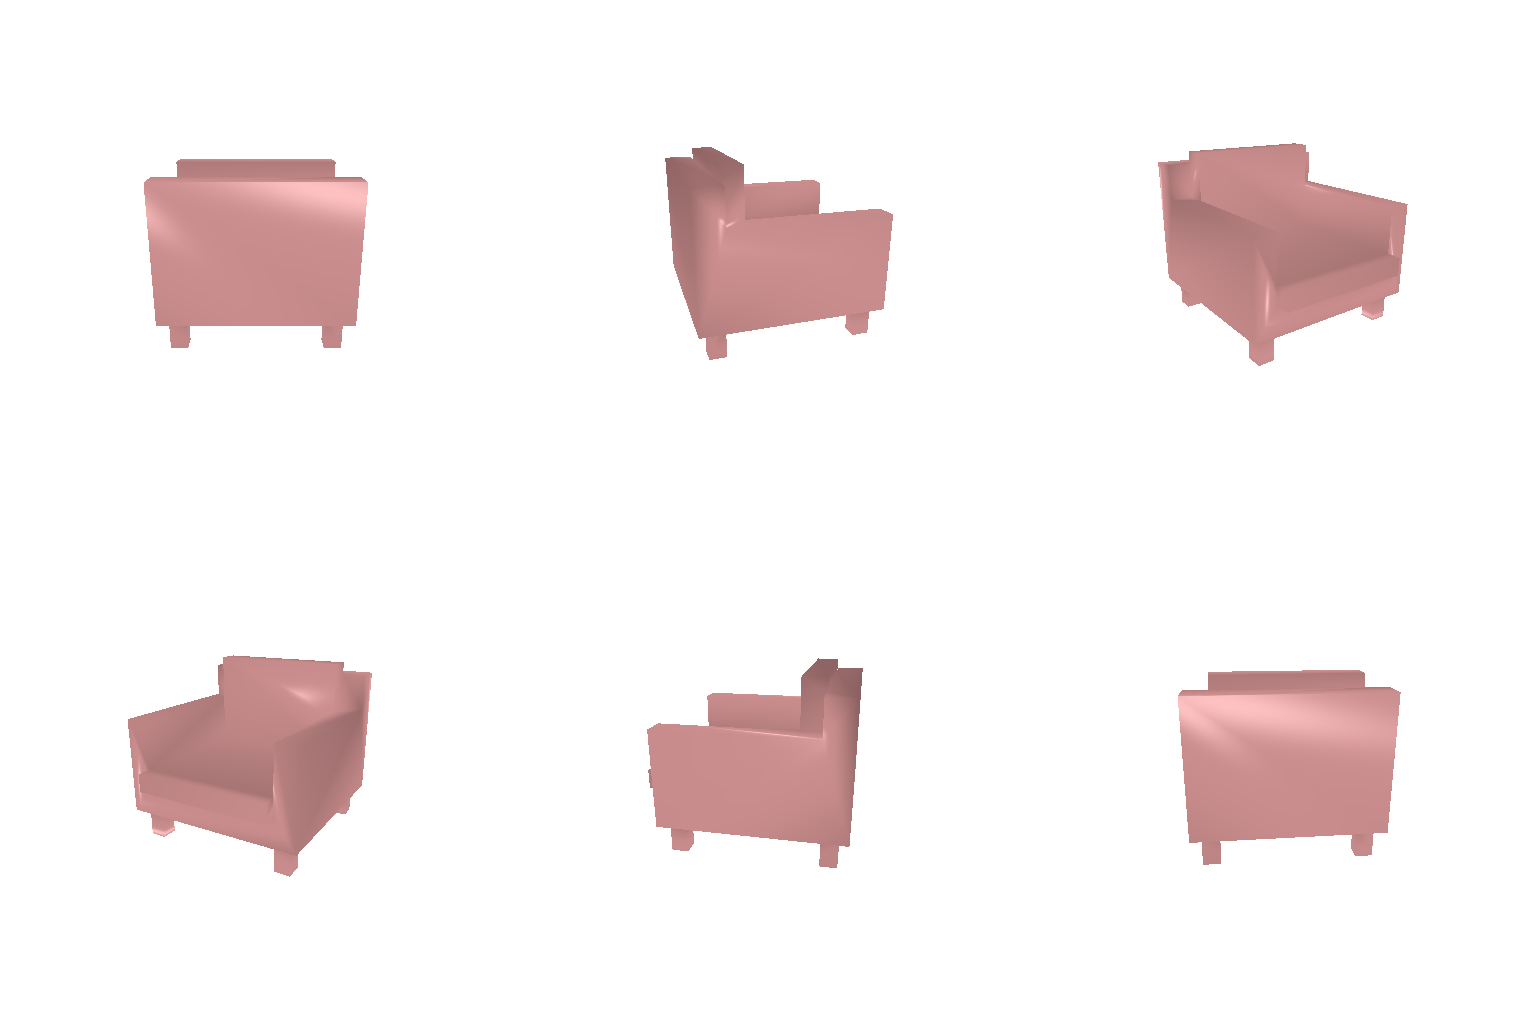
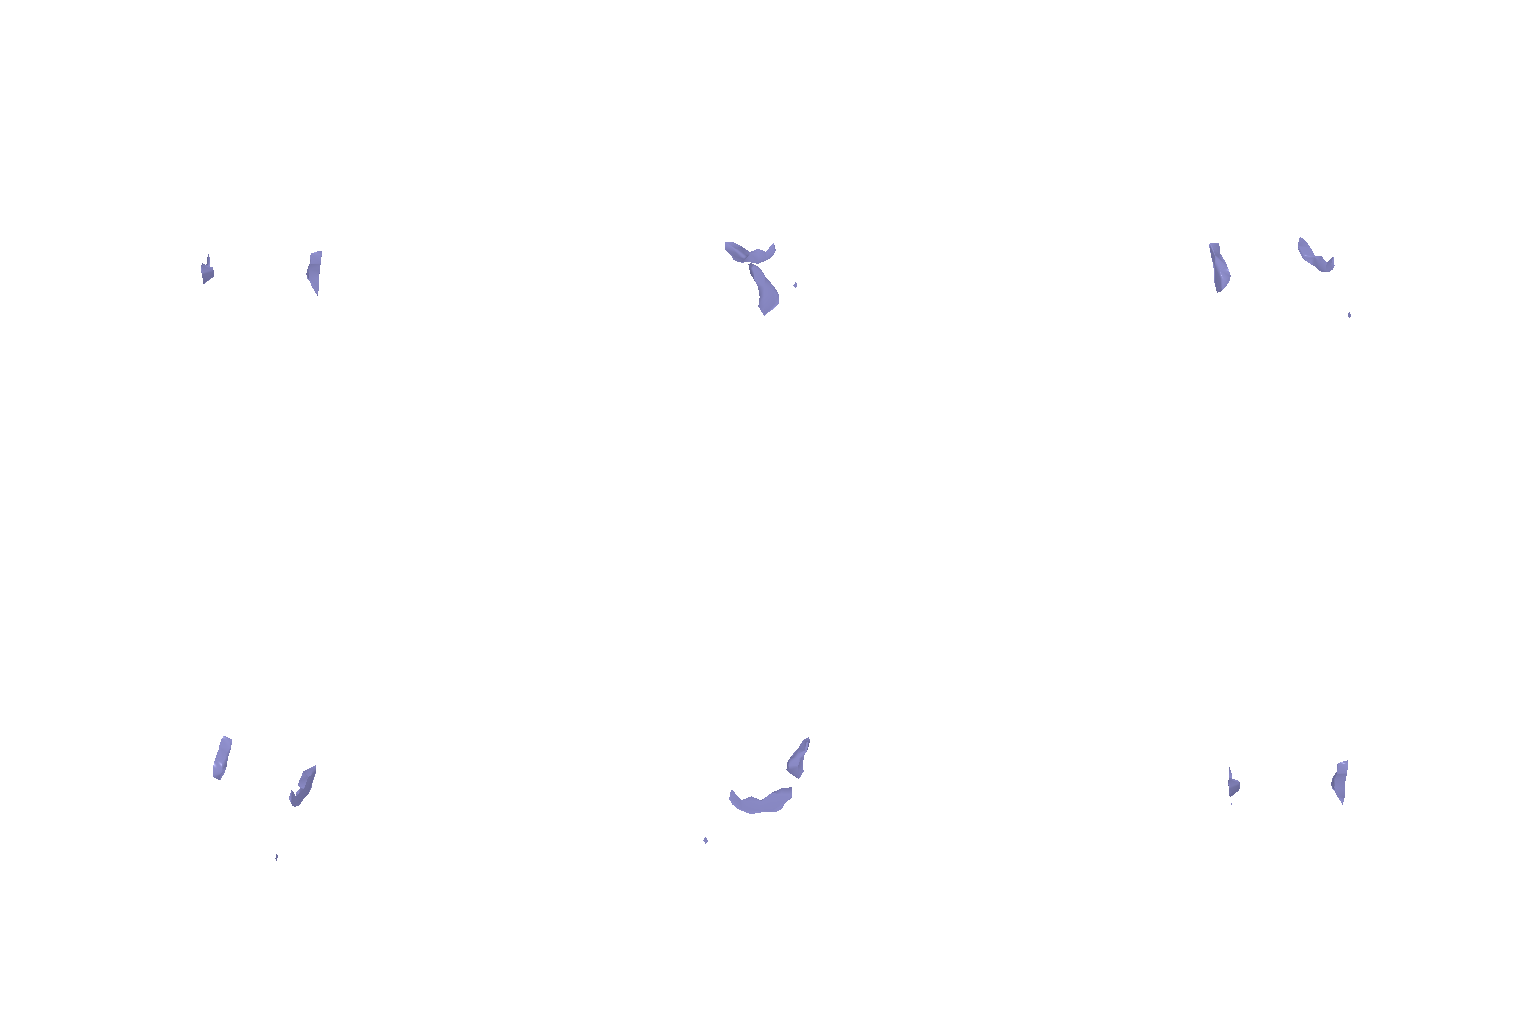
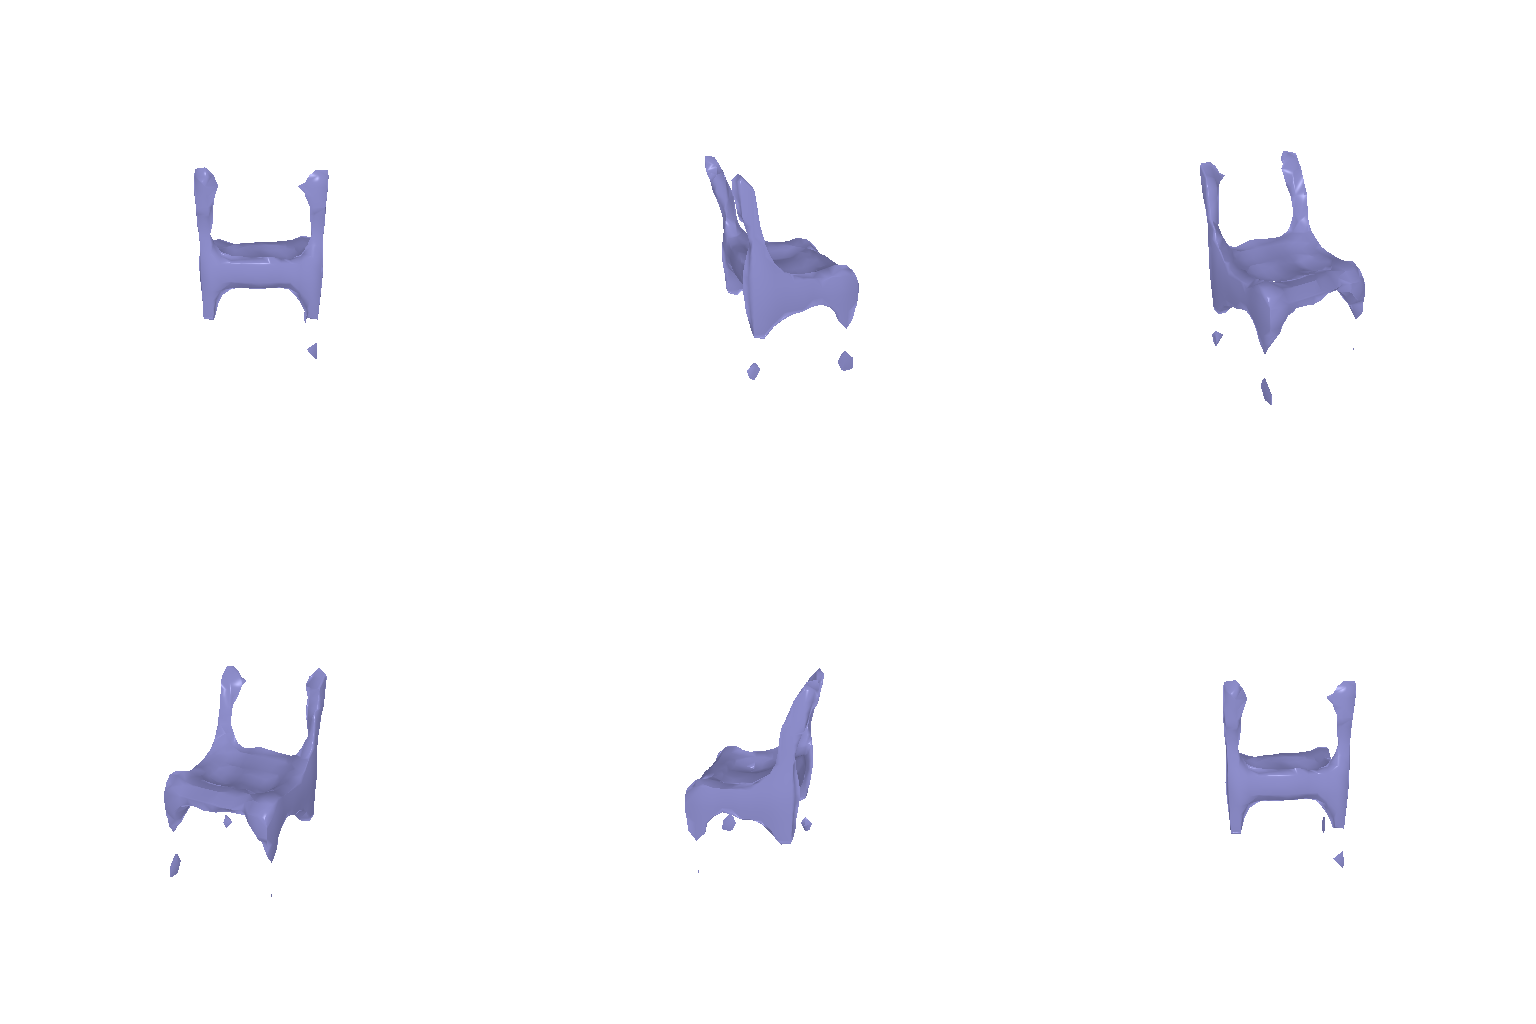
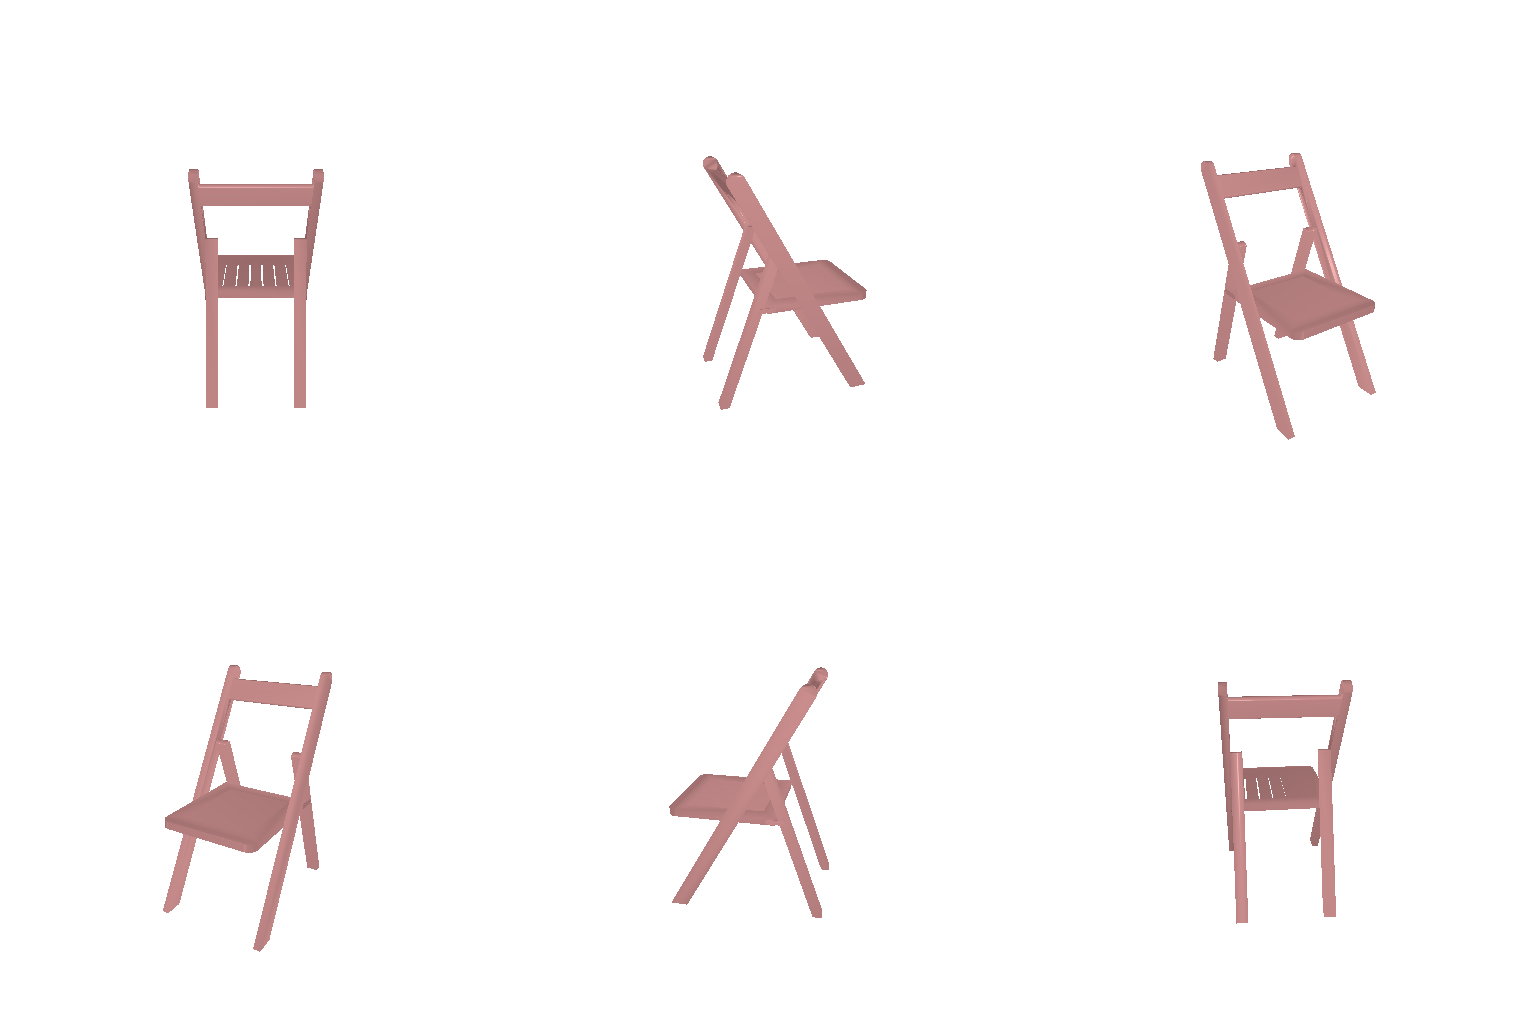
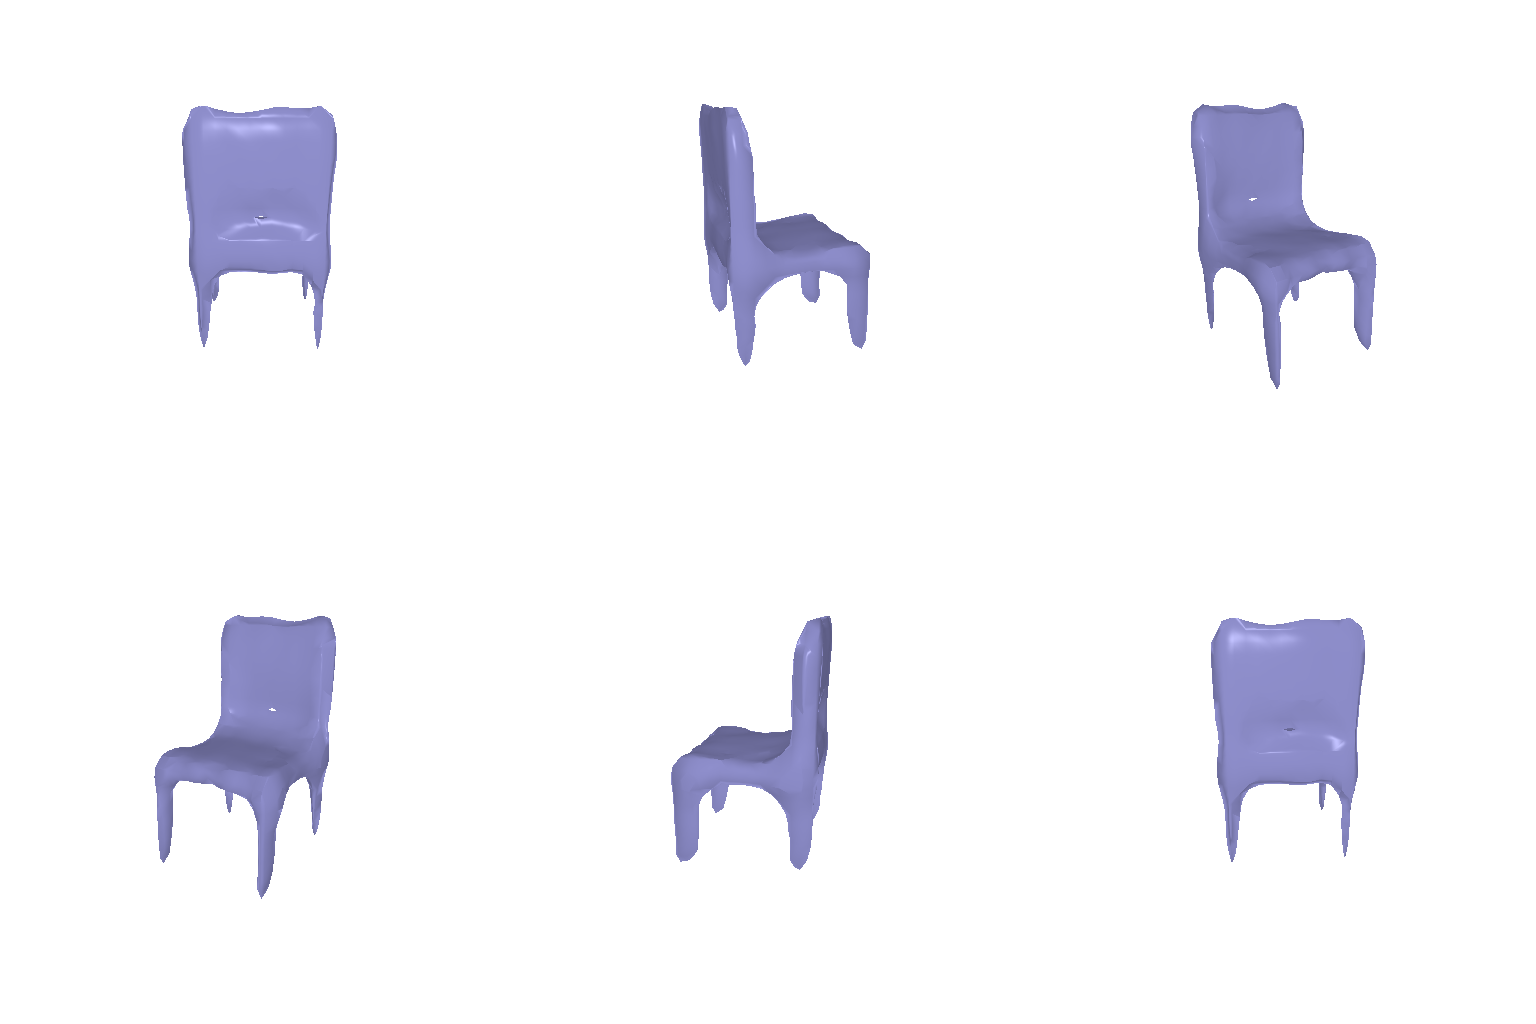
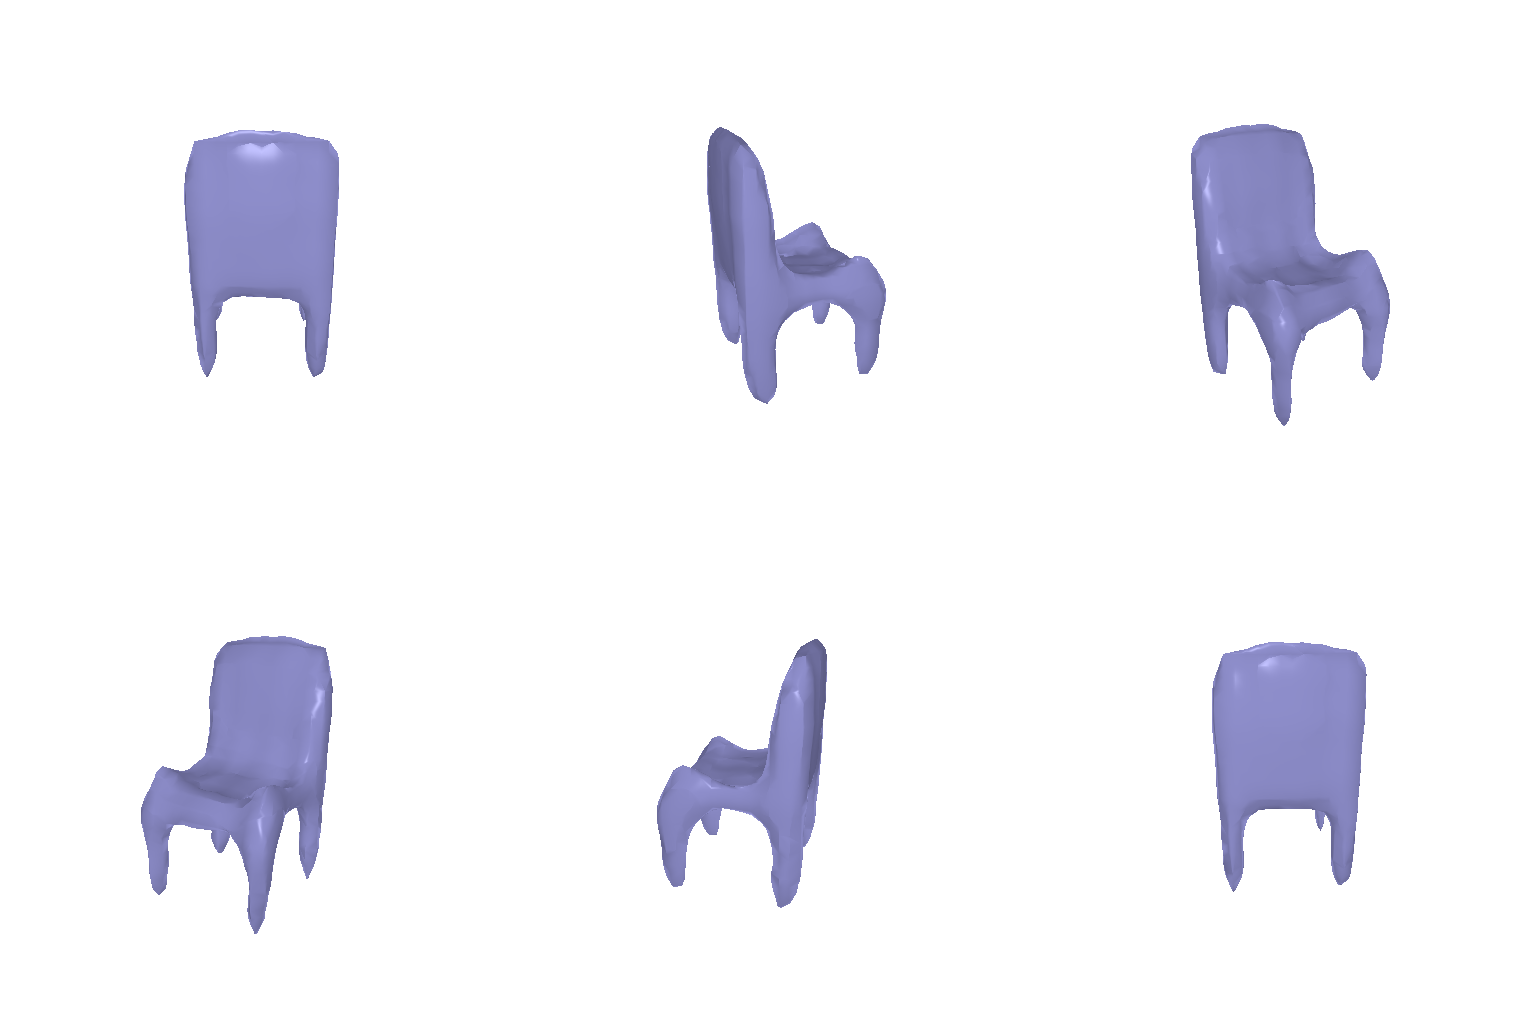
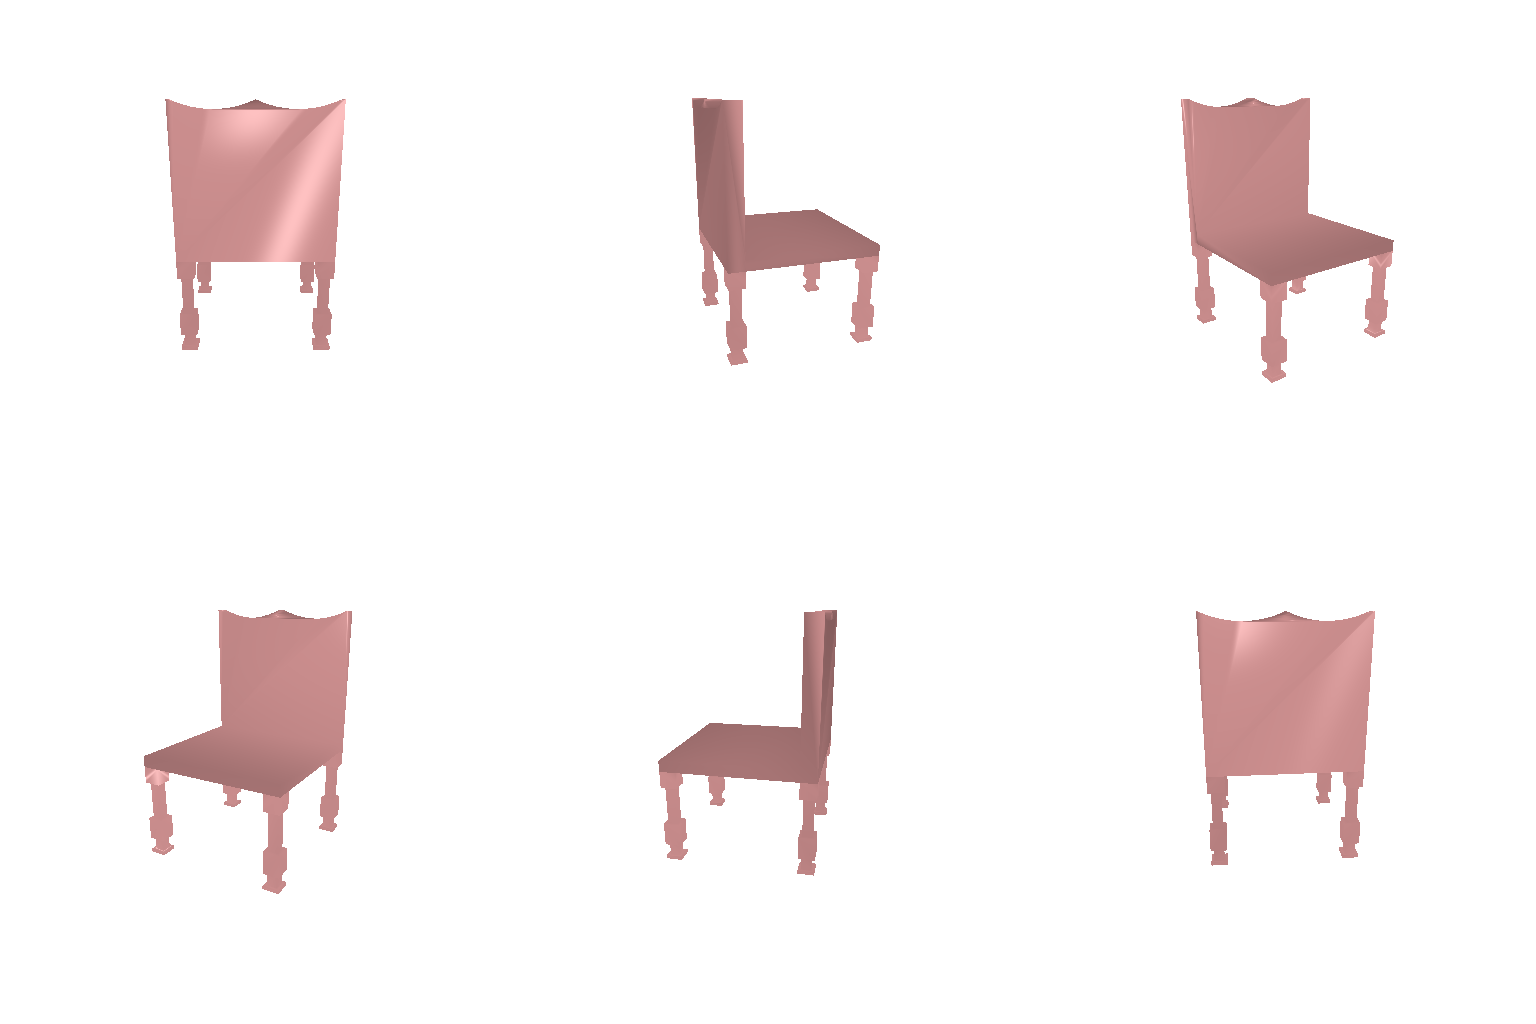
Predictions are drawn as the marching-cubes surface at occupancy 0.5. F1@0.05 is F1@0.05 for that chair.
Decoder
A linear layer lifts the feature to a 128×4×4×4 volume. Three
ConvTranspose3d layers (kernel 4, stride 2, BatchNorm + ReLU) upsample it to
8³, 16³ and 32³ with 64, 32 and 16 channels, and a 3×3×3
Conv3d outputs one logit per voxel.
Weighting occupied voxels
A chair fills only a small part of the grid, so plain BCE (the baseline) learns to say
“empty” wherever it is unsure: its test precision (69.3) is far above its recall
(54.5), it misses thin parts, and it reduces the folding chair to a few specks. I added a
pos_weight to voxel_loss that scales the loss of occupied cells
(the default 1 leaves 1.1 unchanged) and chose it on the held-out chairs:
| pos_weight | 1 | 2 | 3 | 4 | 5 |
|---|---|---|---|---|---|
| Validation F1@0.05 | 58.5 | 62.7 | 59.4 | 57.6 | 53.0 |
| Precision | 67.7 | 60.2 | 54.2 | 52.1 | 47.1 |
| Recall | 55.1 | 66.8 | 67.3 | 66.1 | 62.4 |
The final model uses weight 2, retrained on all 6,100 training chairs. Section 2.4 analyzes the sweep.
Evaluation
| Model (678 test chairs) | F1@0.05 | Precision | Recall |
|---|---|---|---|
| Baseline, pos_weight 1 | 58.0 | 69.3 | 54.5 |
| Final, pos_weight 2 | 62.1 | 61.4 | 64.8 |
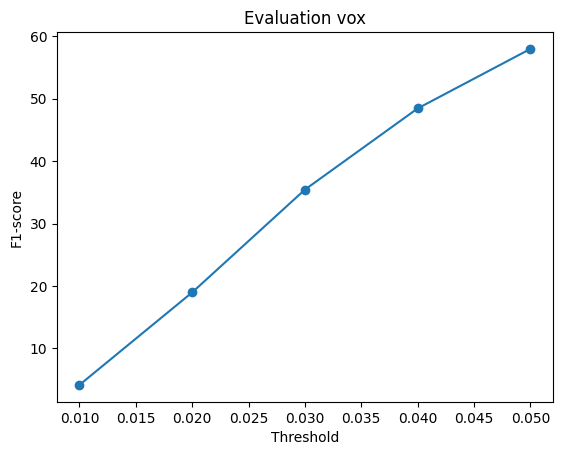
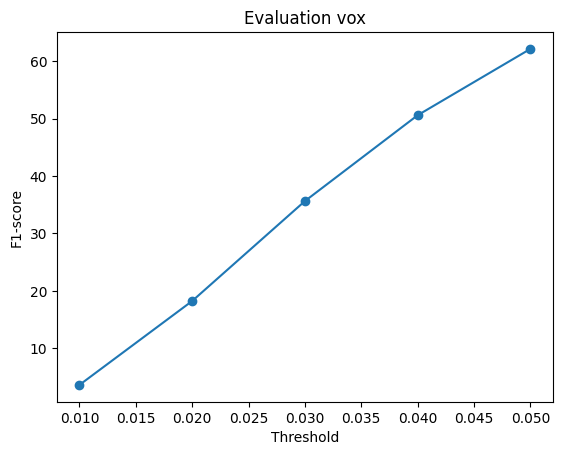
- The weight trades precision for recall and gains 4.1 F1@0.05 overall.
- The folding chair goes from scattered specks (F1@0.05 20.0) to a recognizable seat, back and legs (62.0).
- Solid chairs get over-filled: the wooden chair's back doubles in thickness and its F1@0.05 drops from 92.3 to 54.0.
- For scale, the ground-truth voxels themselves only reach about 91.7 F1@0.05 against their meshes.
Change to the evaluation
The provided voxel branch of evaluate() (Mem2Ref, a −π rotation about
y, and re-centering) does not put the grid in the mesh frame; scored that way, even the
ground-truth voxels only reach F1@0.05 = 53.4. I replaced it with the 1.1 transform: take the
marching-cubes surface of sigmoid(logits) in [−1, 1]³ and scale it by
0.5, with no re-centering.
2.2 Image to point cloud
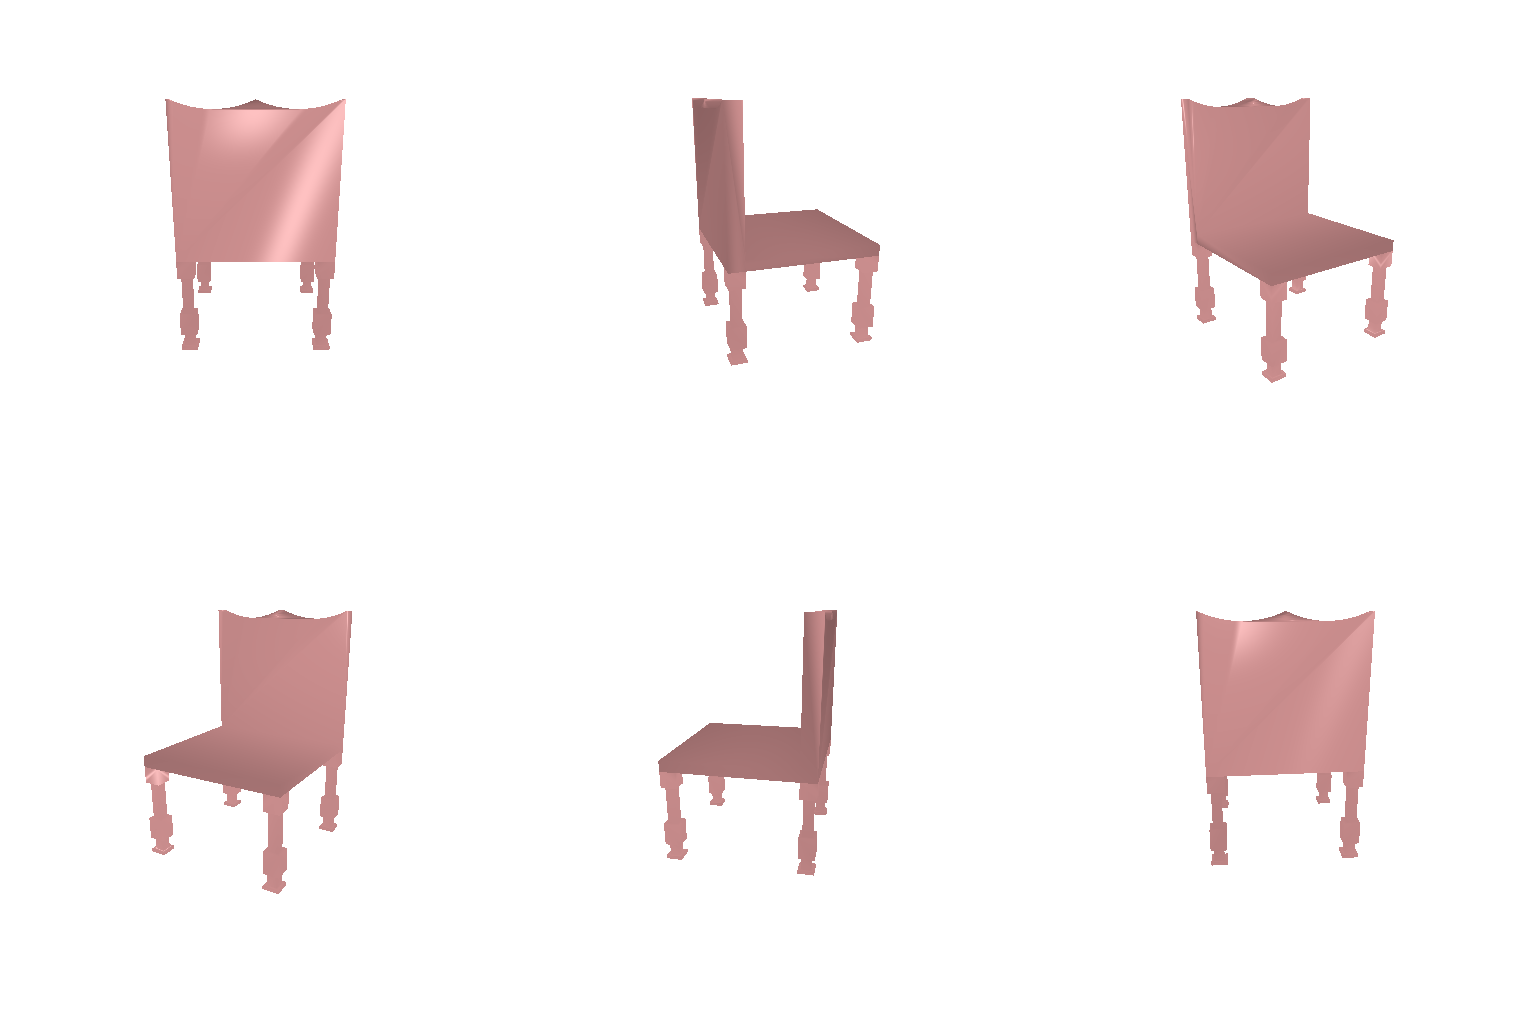
Decoder
An MLP maps the feature straight to 1,000 × 3 coordinates: three hidden layers of
width 1,024 with ReLU and a linear output. The loss is chamfer_loss from 1.2
against 1,000 points sampled from the ground-truth surface at every step.
Choosing the training length
One 30,000-step run on the 5,800 non-held-out chairs, with checkpoints scored on the held-out ones:
| Steps | 10,000 | 20,000 | 30,000 |
|---|---|---|---|
| Training chamfer loss | 0.0030 | 0.0020 | 0.0019 |
| Validation F1@0.05 | 79.4 | 77.9 | 77.4 |
| Precision | 80.5 | 80.1 | 80.2 |
| Recall | 80.4 | 77.8 | 76.4 |
Training loss keeps falling after 10k steps while validation F1@0.05 drops, almost entirely through recall: the decoder starts fitting the training chairs instead of covering new ones. The final model is retrained on all 6,100 chairs for 10,000 steps.
Evaluation
Test F1@0.05 over 678 chairs: 80.1 (precision 81.2, recall 81.3).
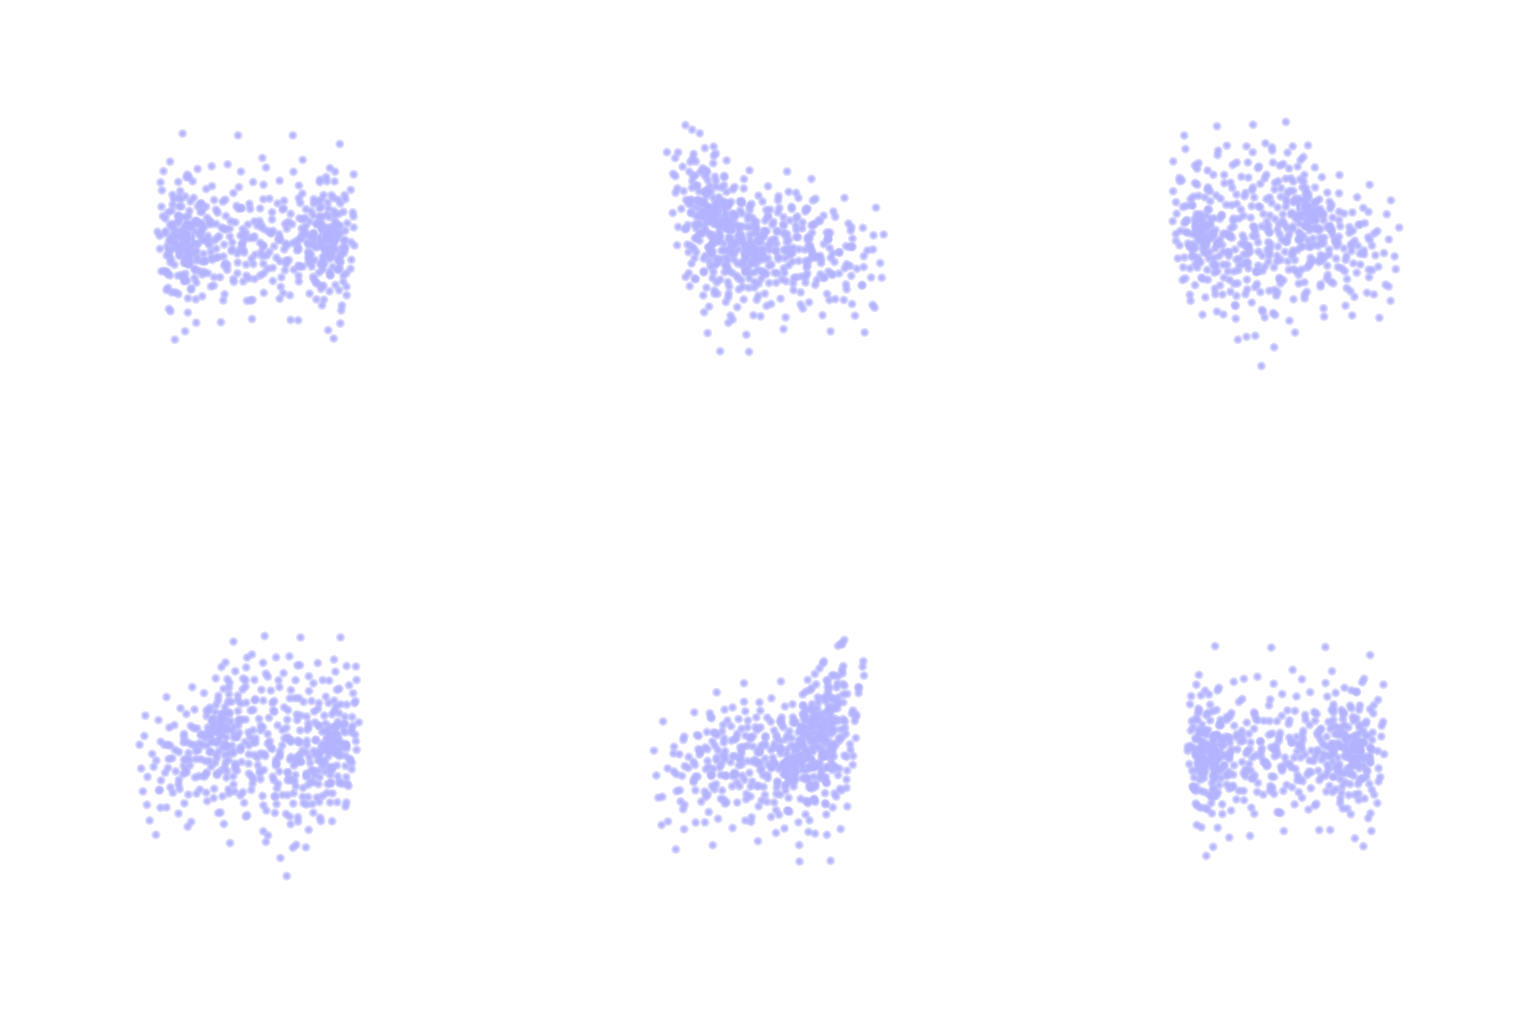
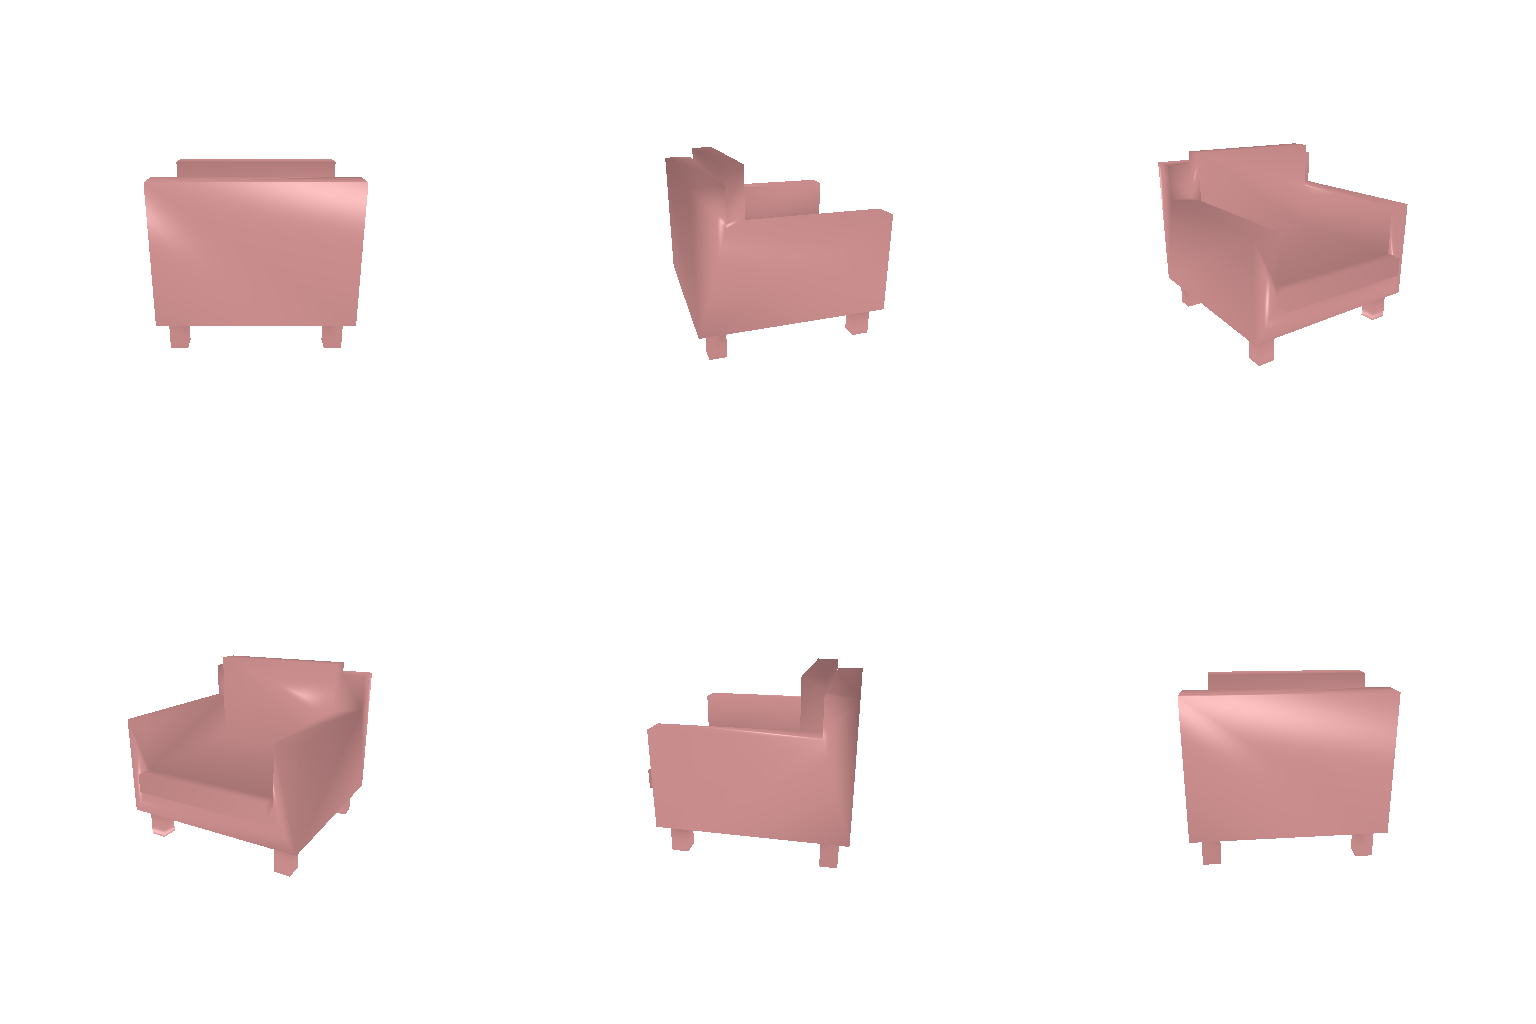
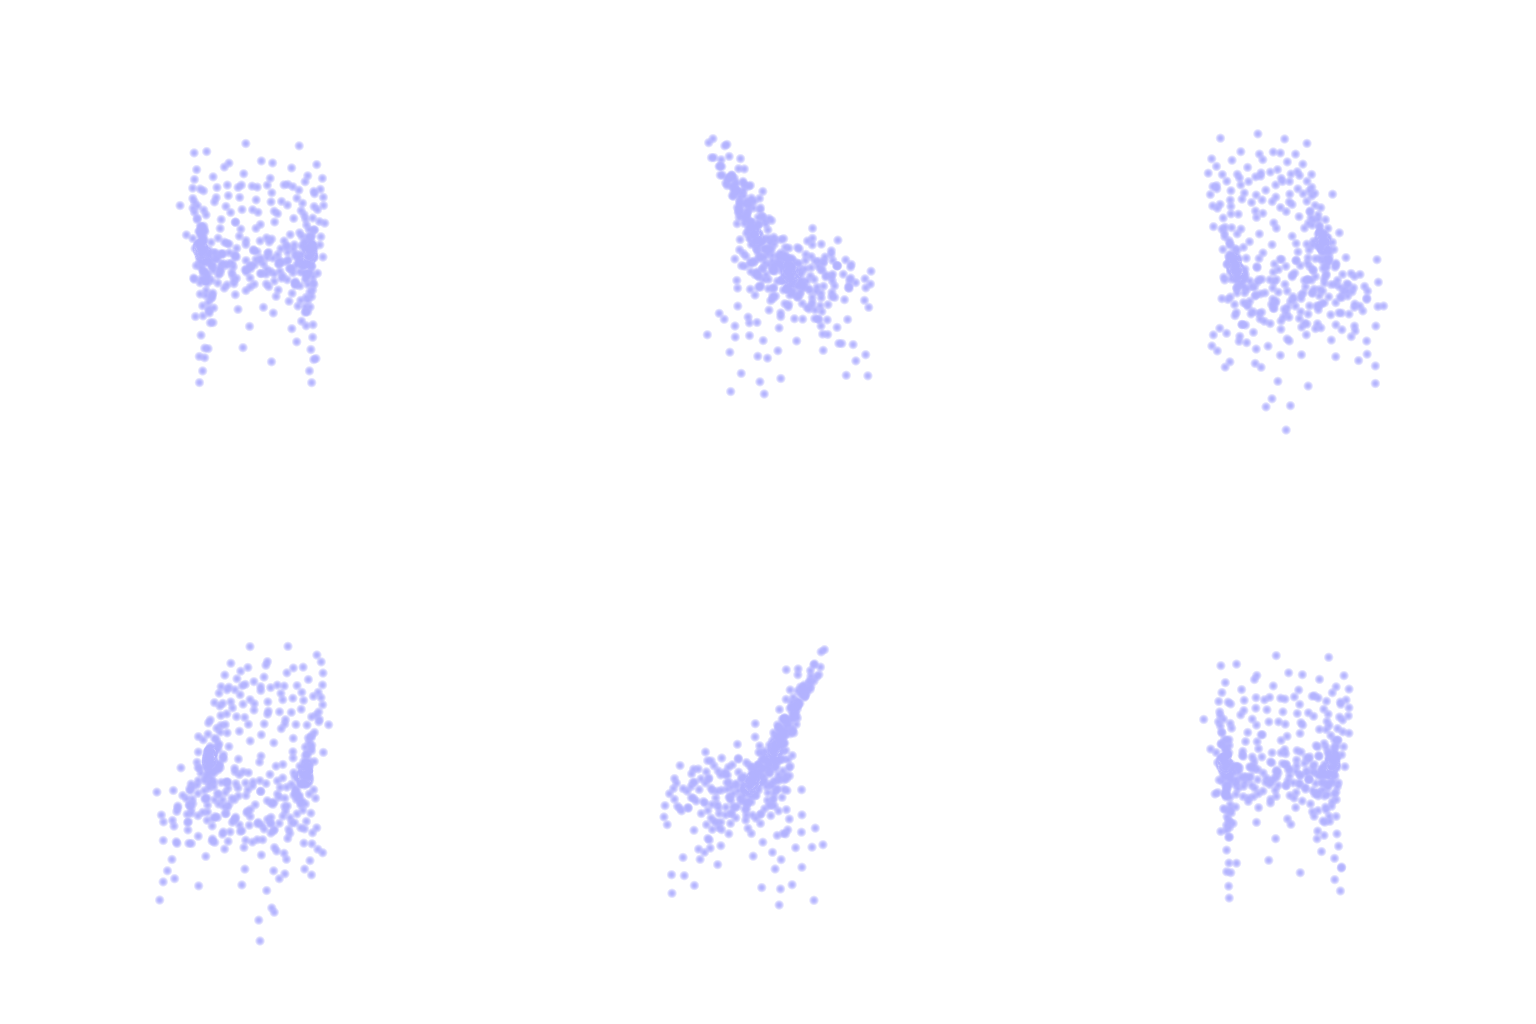
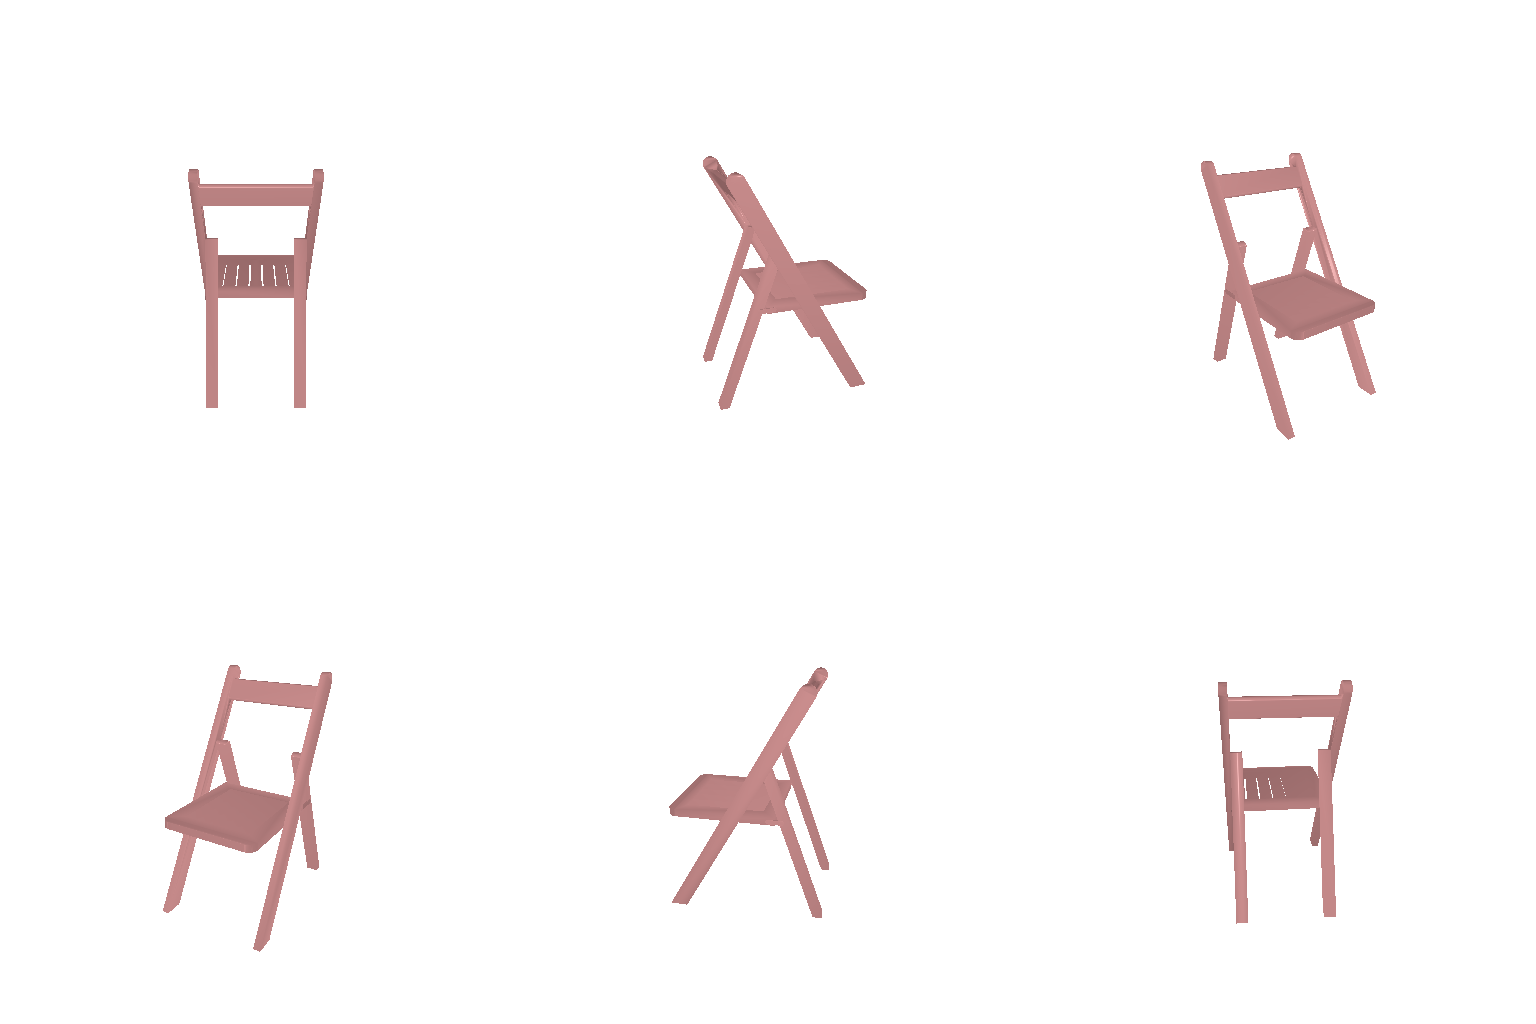
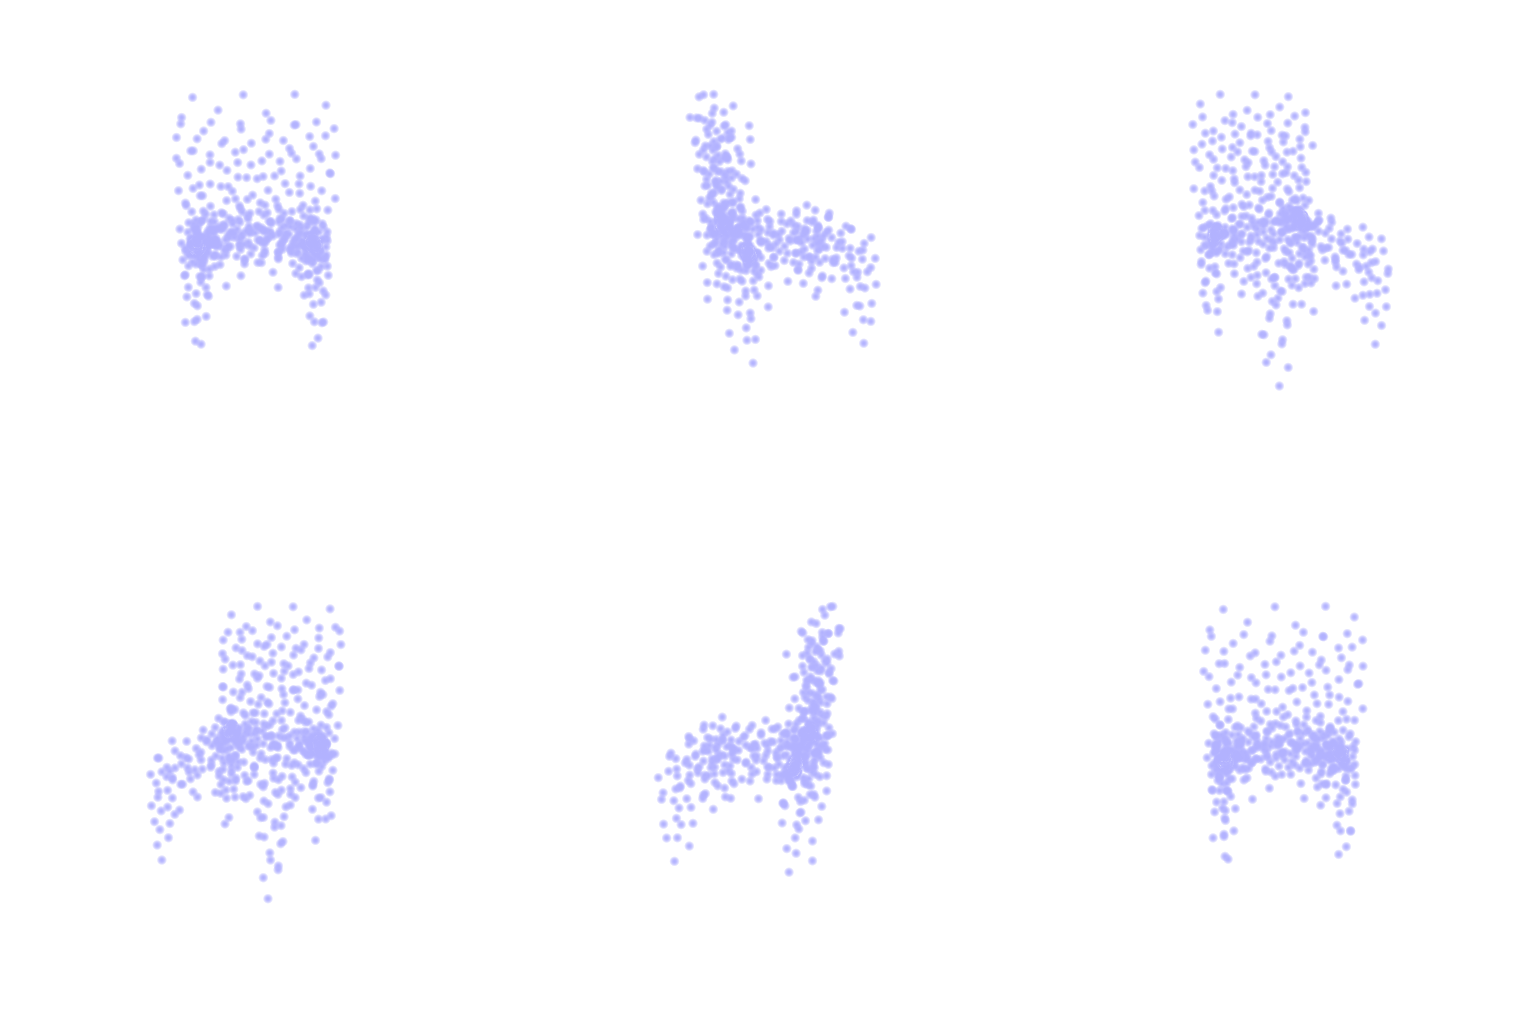
The clouds capture each chair's layout: the armchair's box, the folding chair's backward lean, and the wooden chair's seat, back and legs. They are noisy, though: points form a band around the surface instead of lying on it, and thin legs are only sketched. F1@0.05 accepts any point within 0.05 of the surface (about a tenth of a chair's width), so this spread costs little, and the point decoder scores far above the voxel model (62.1).
2.3 Image to mesh
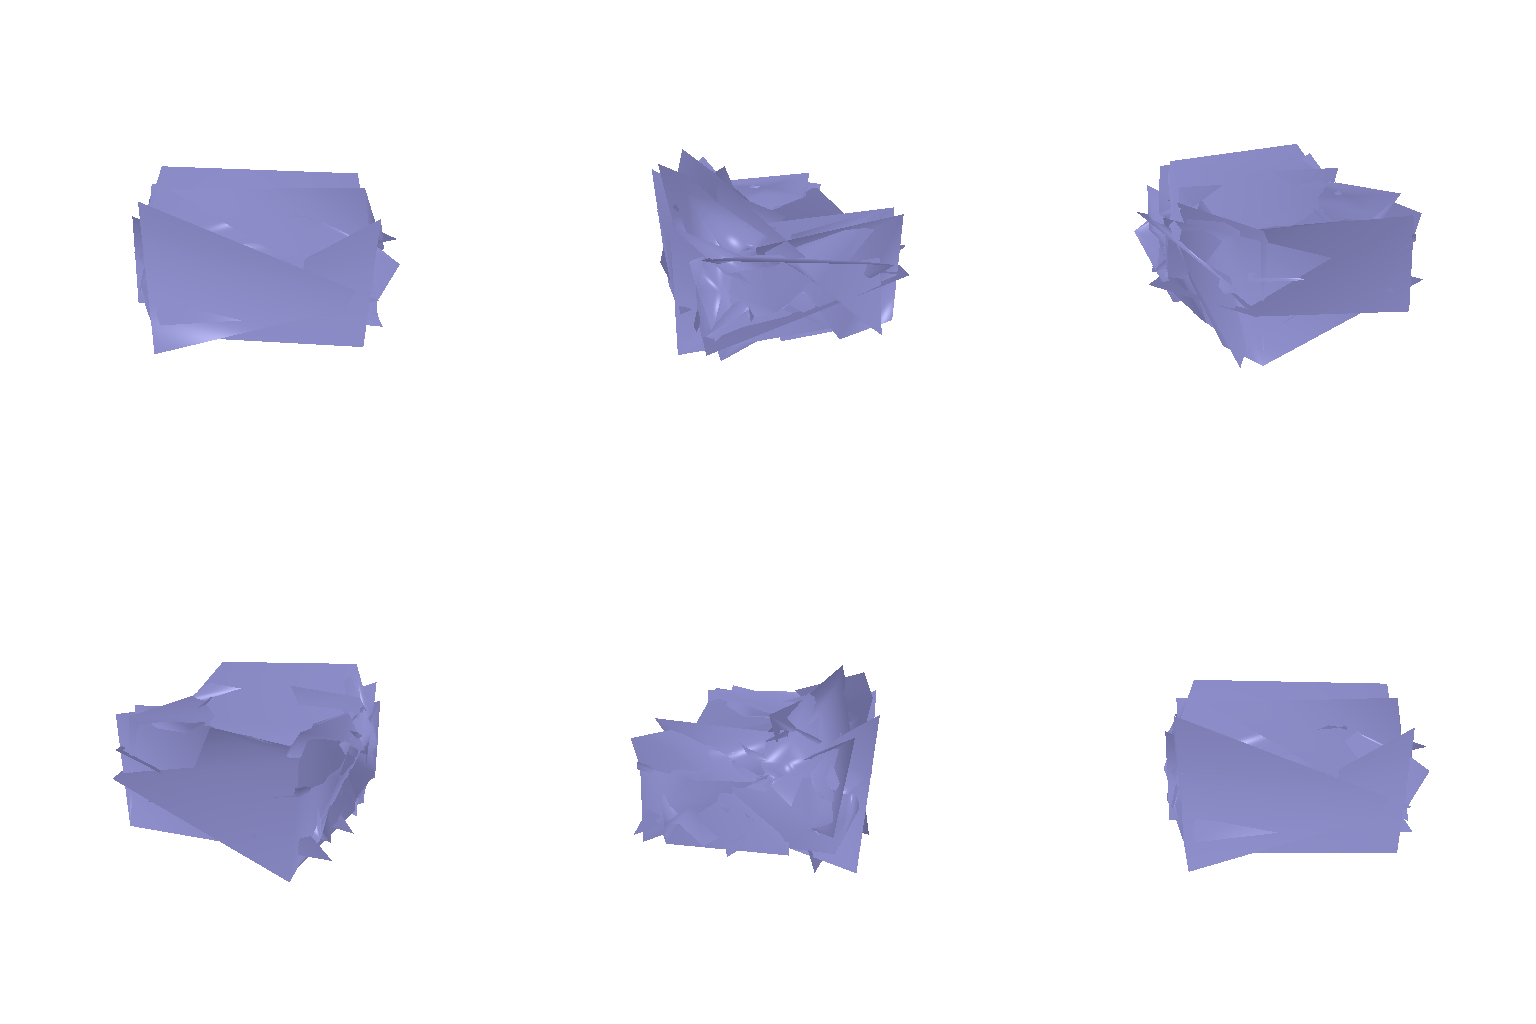
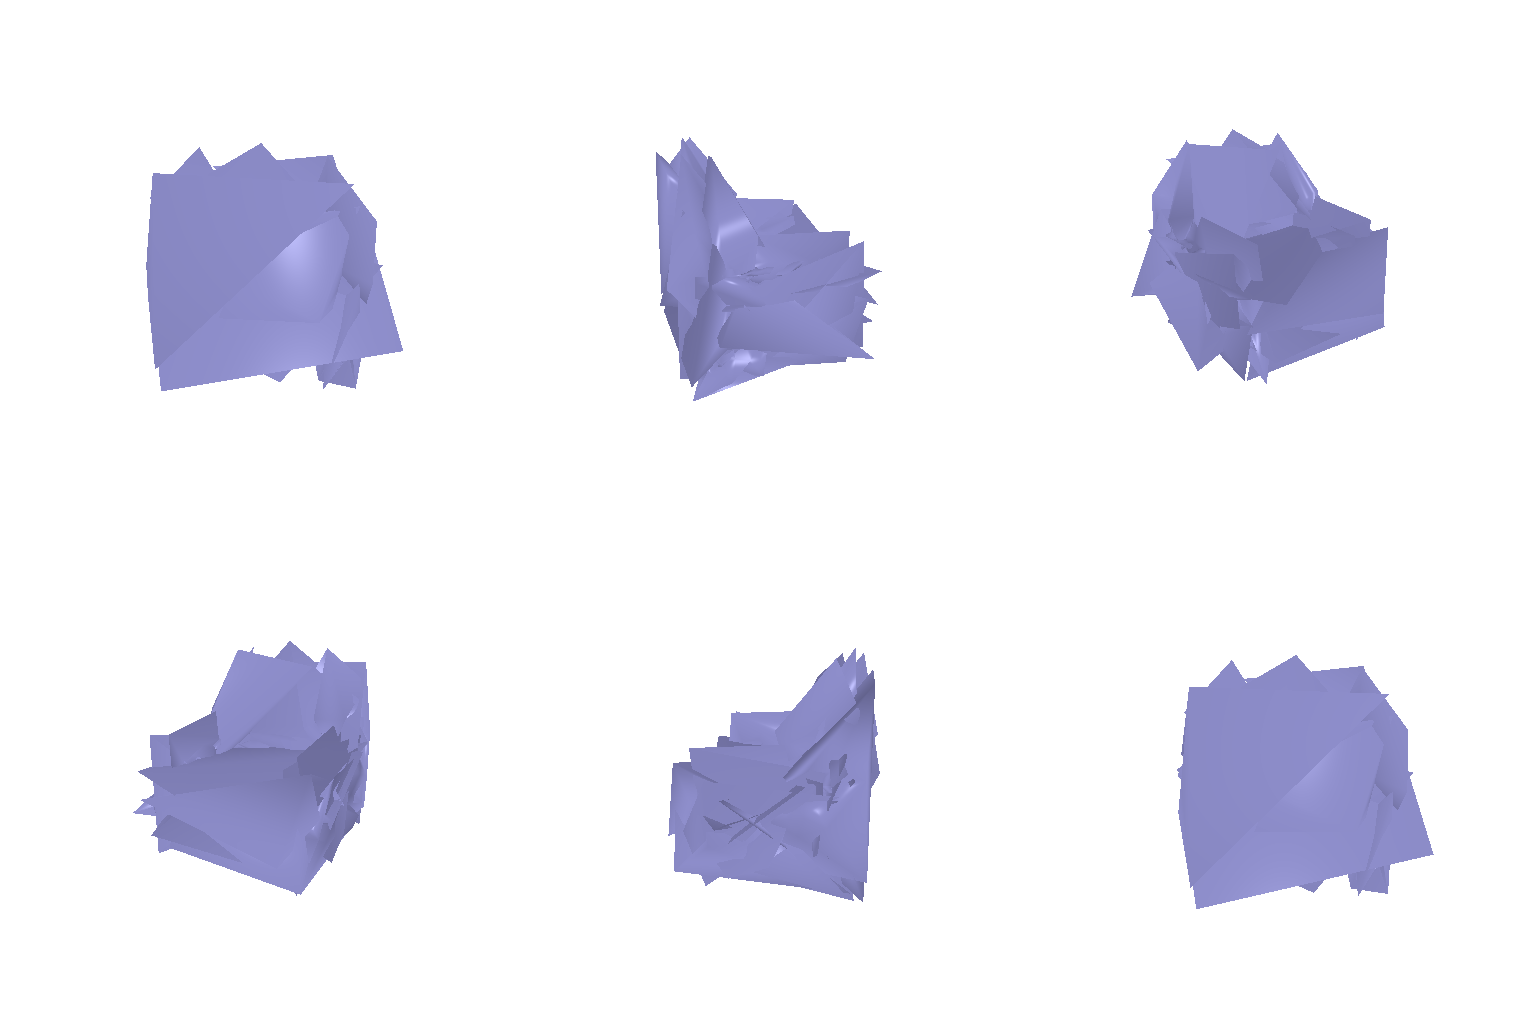
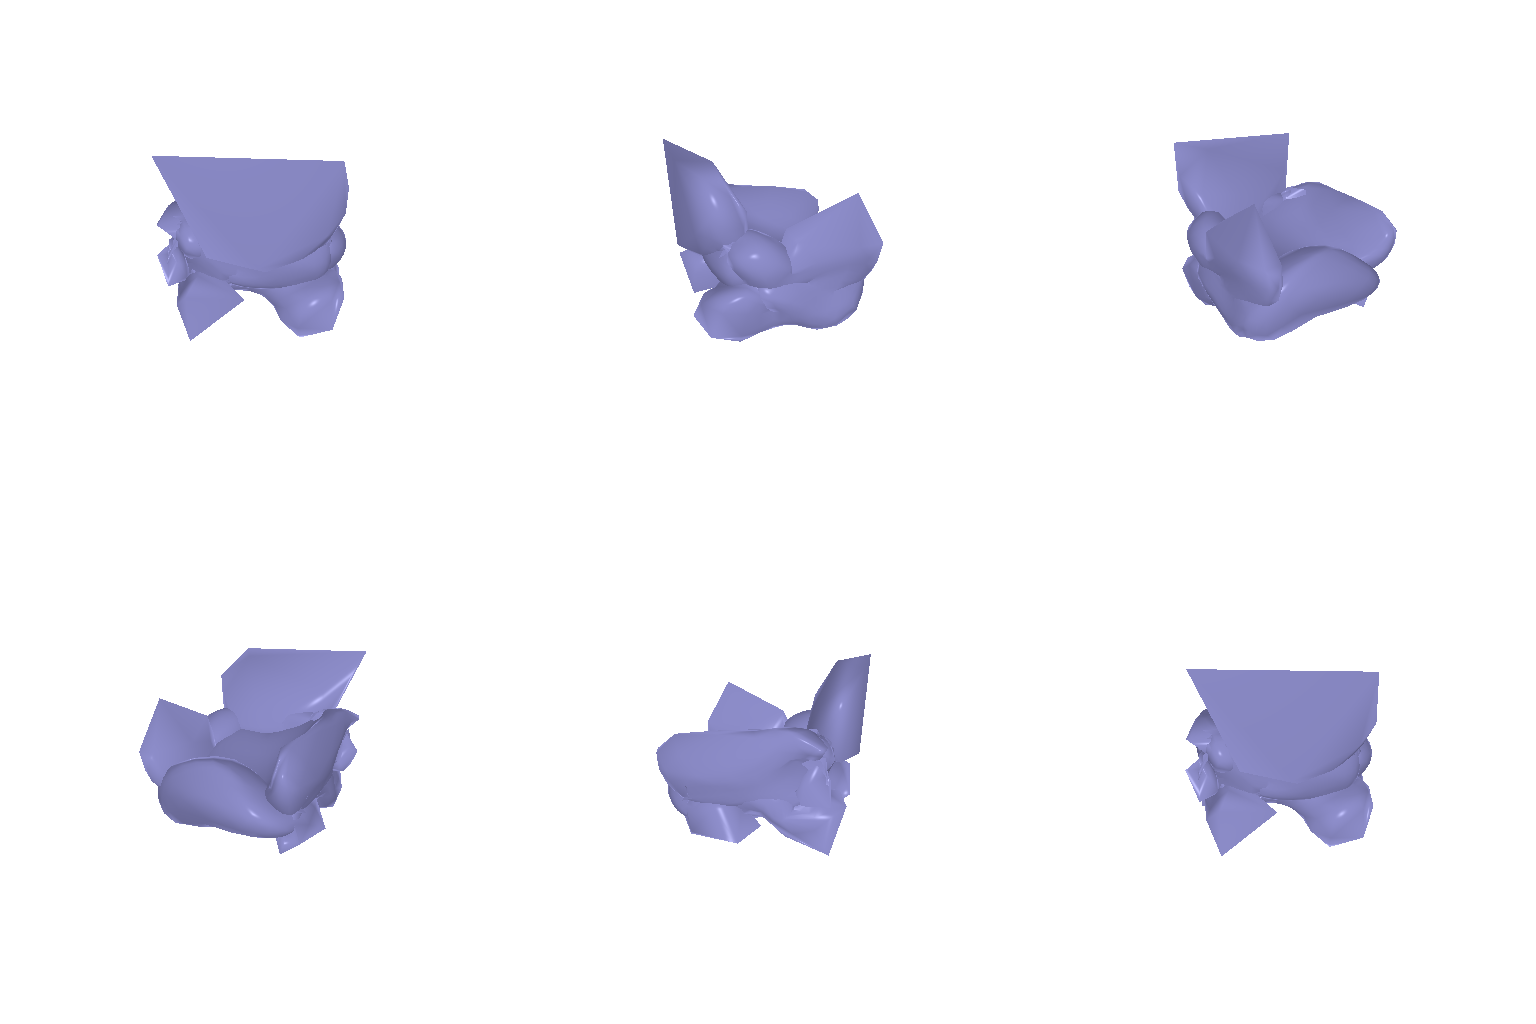
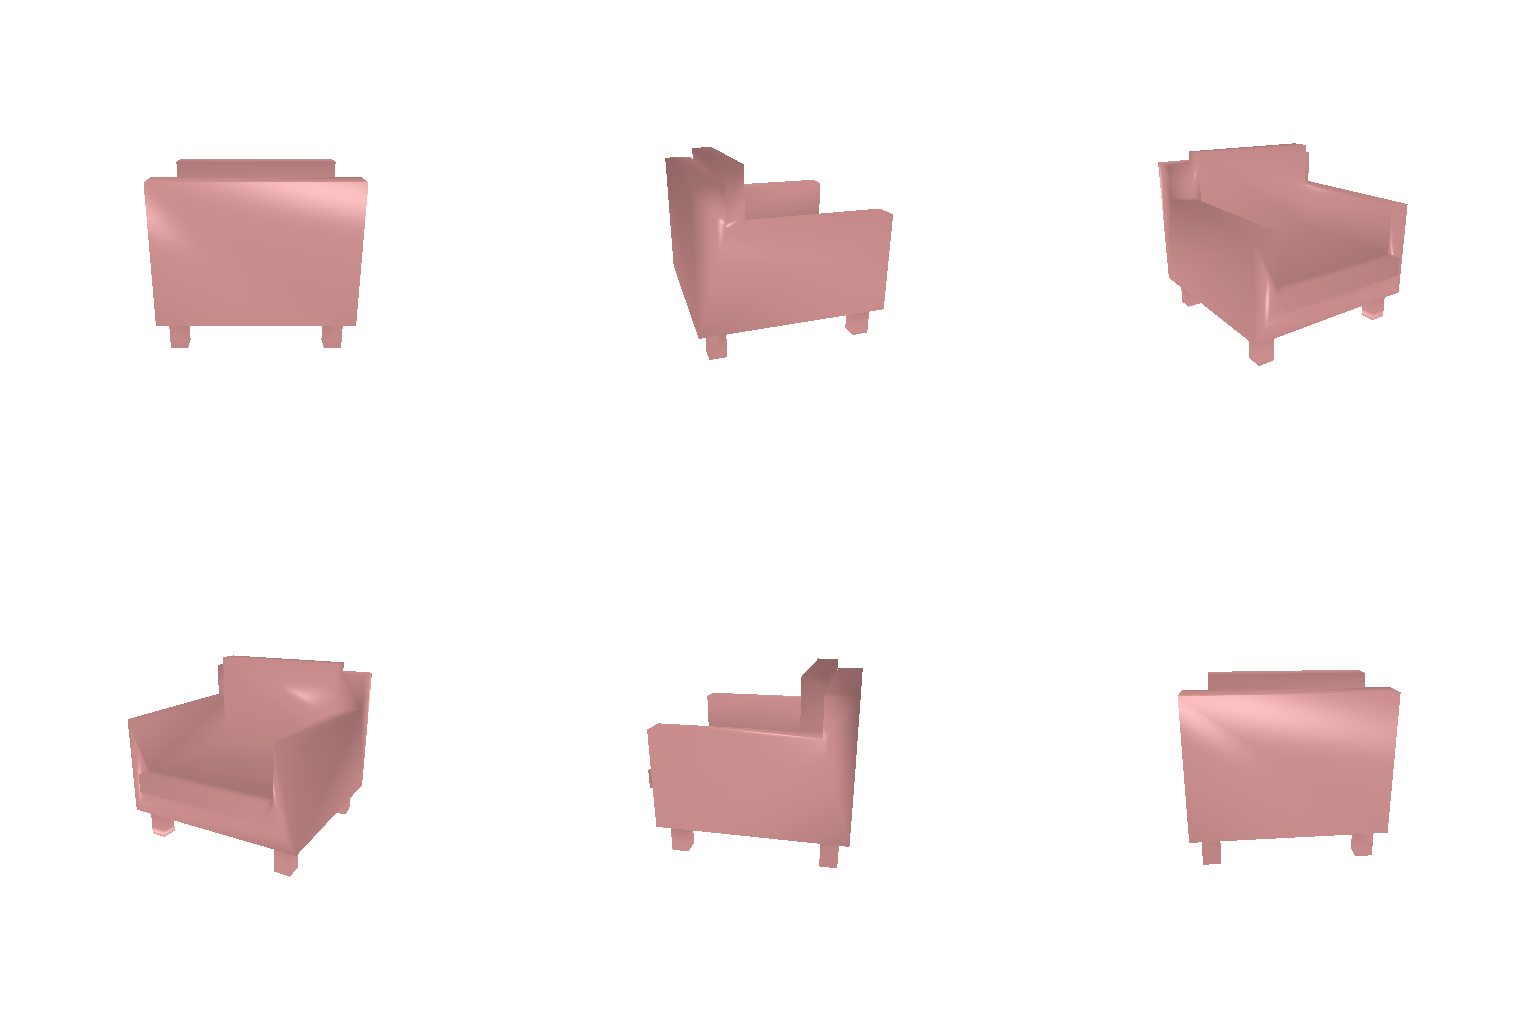
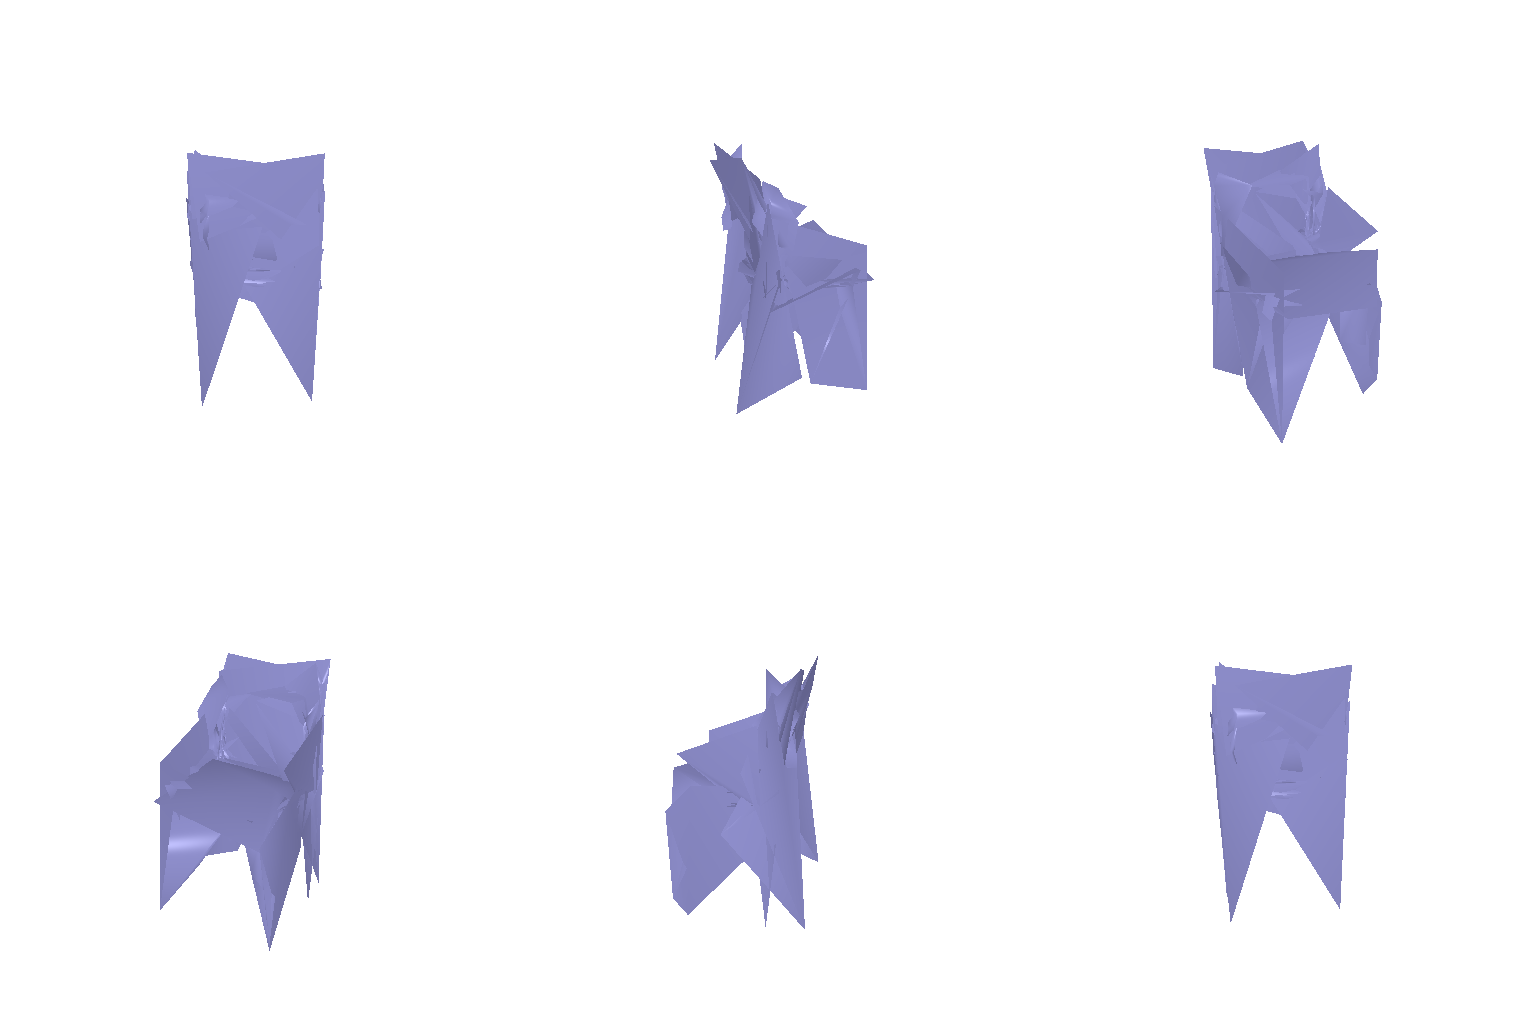
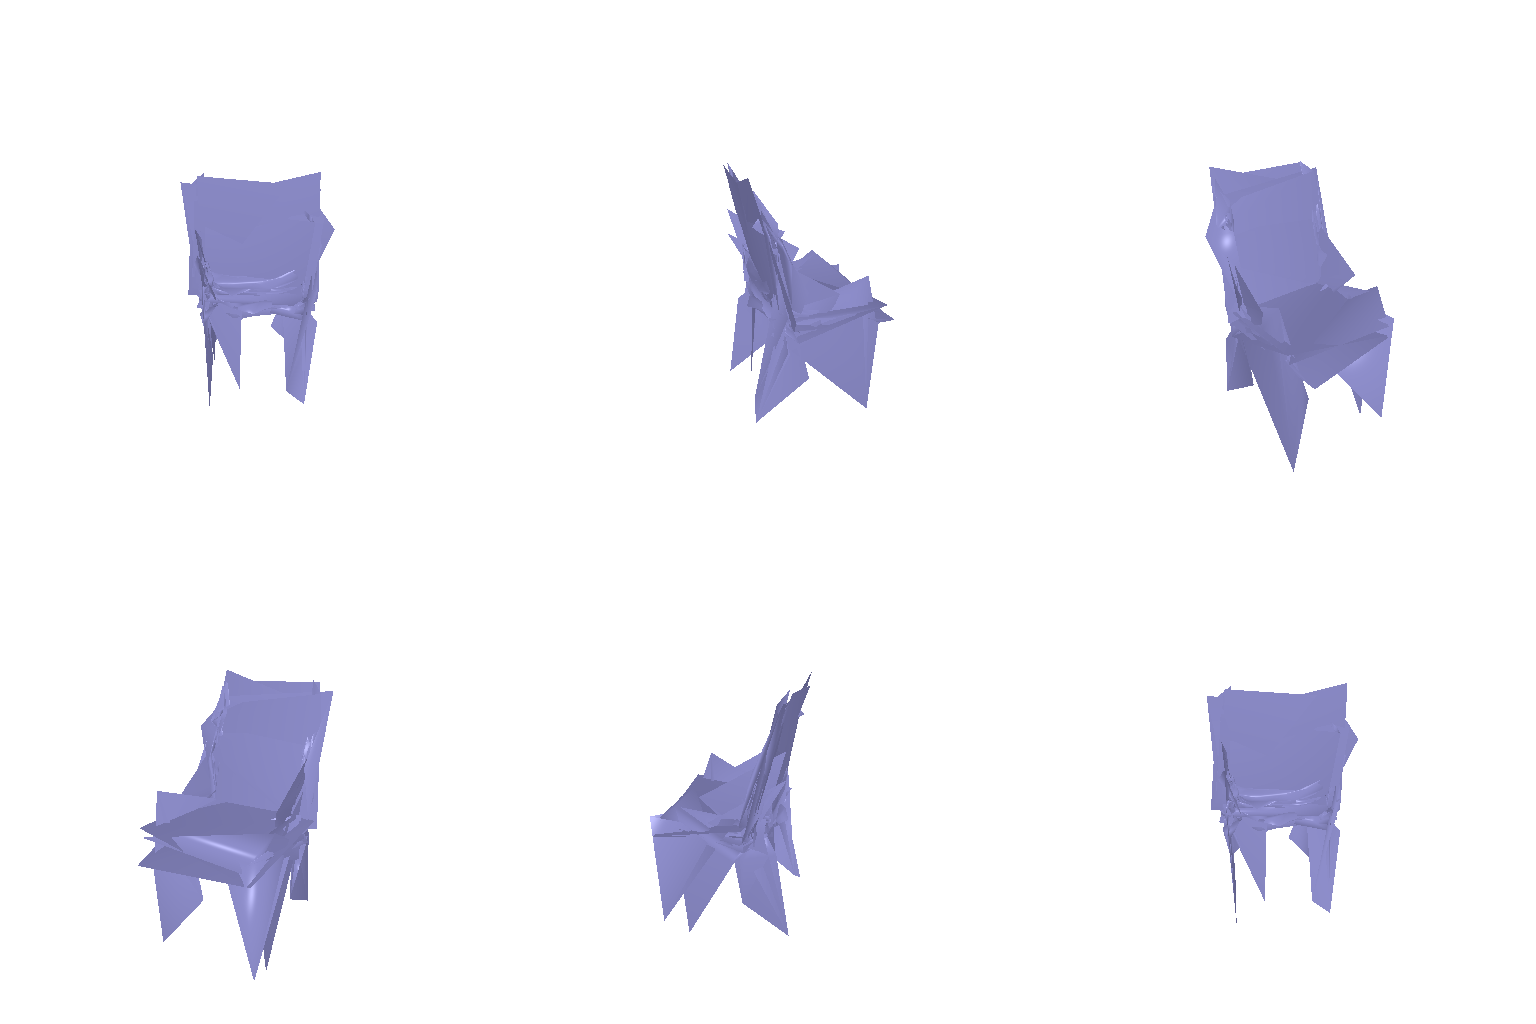
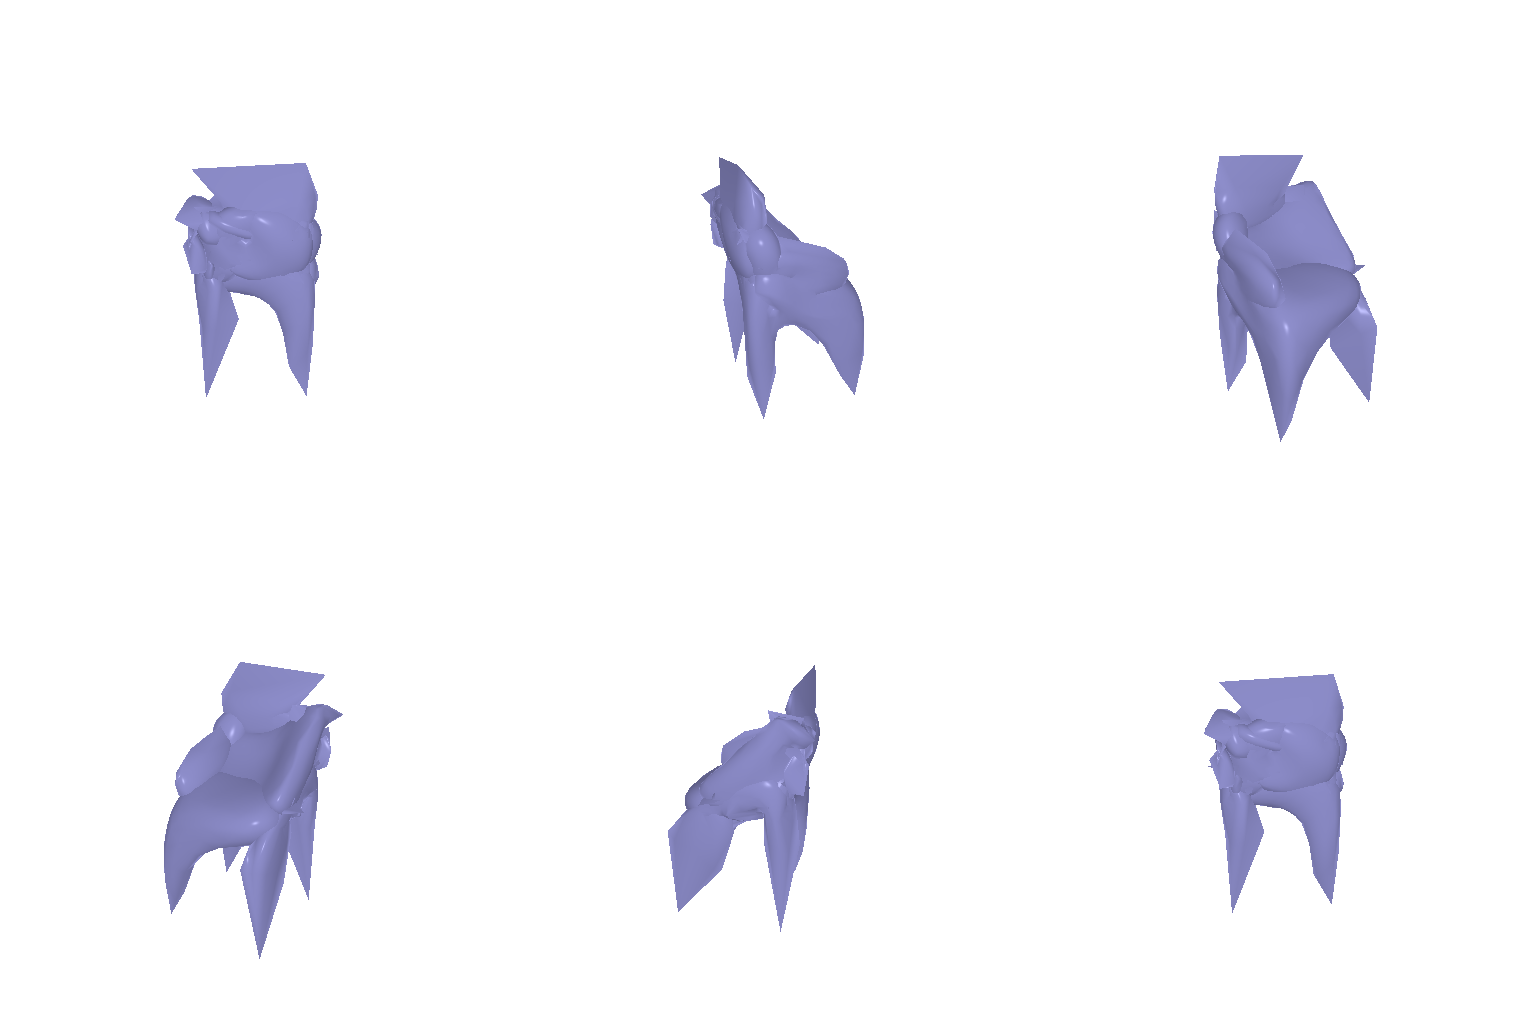
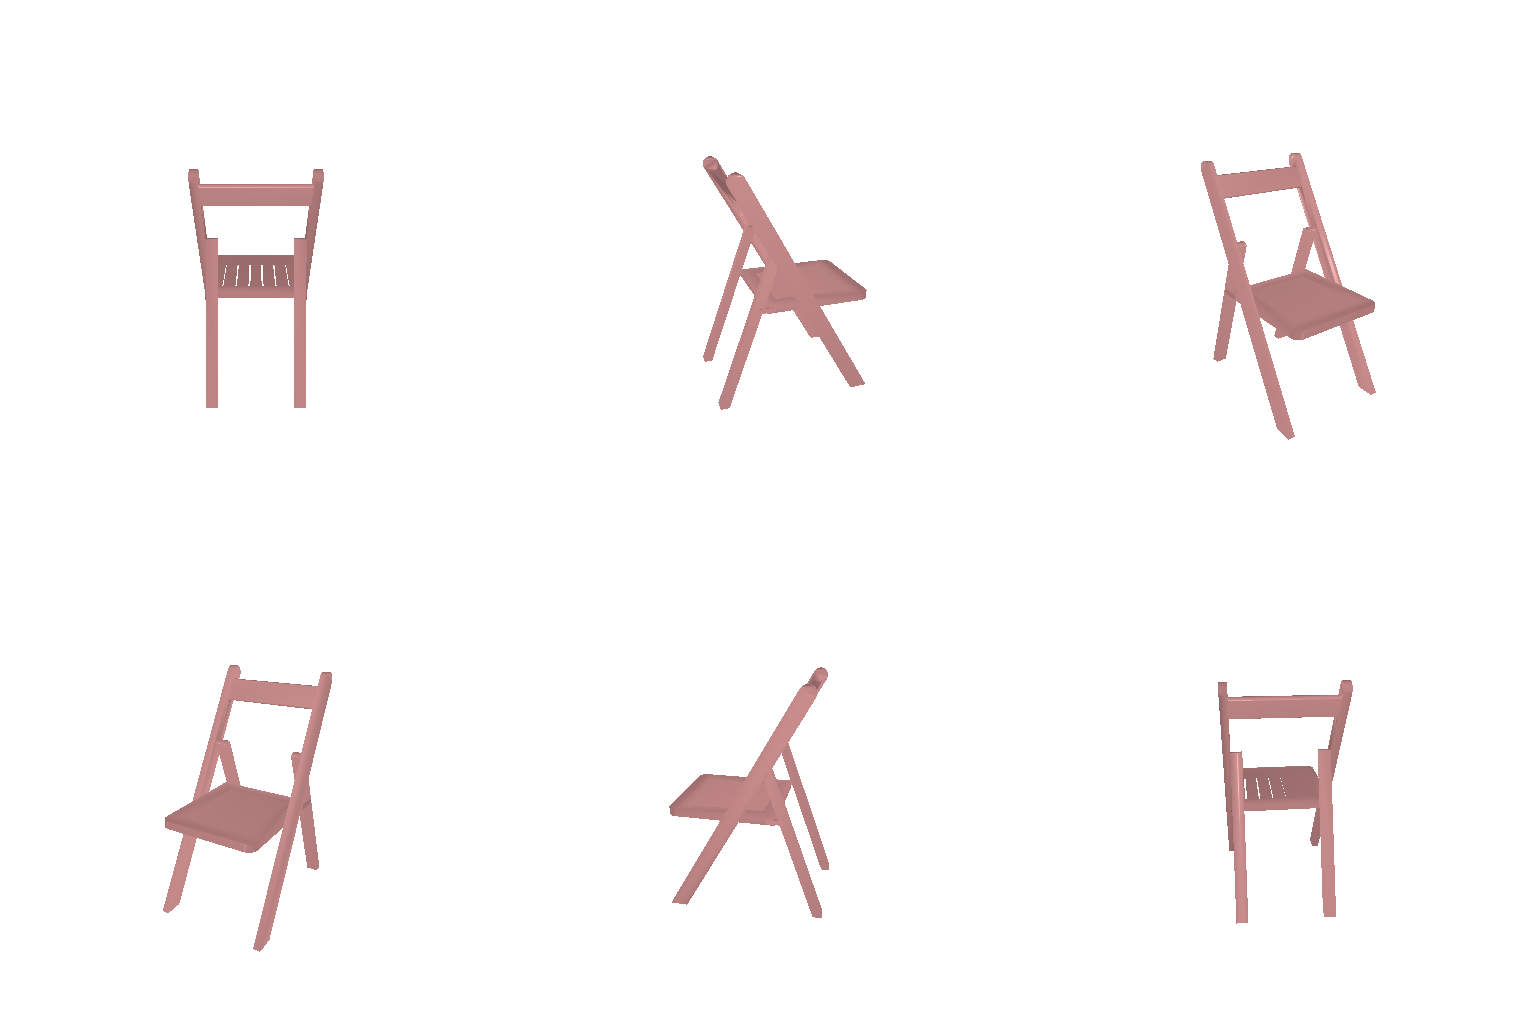
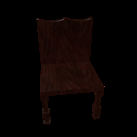
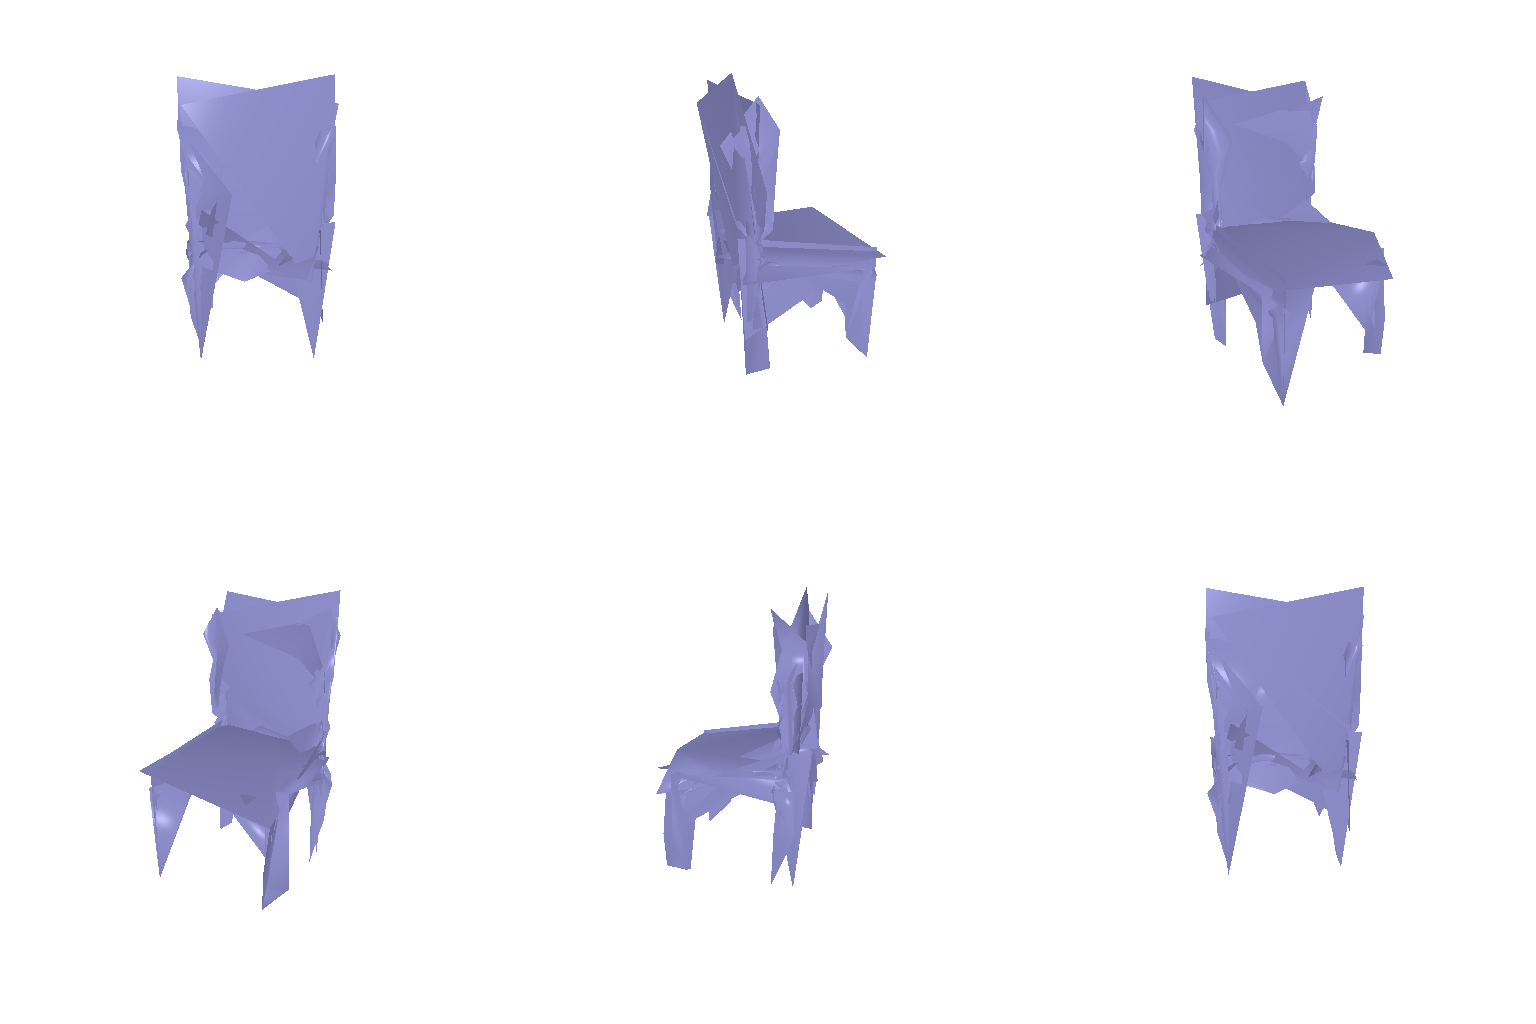
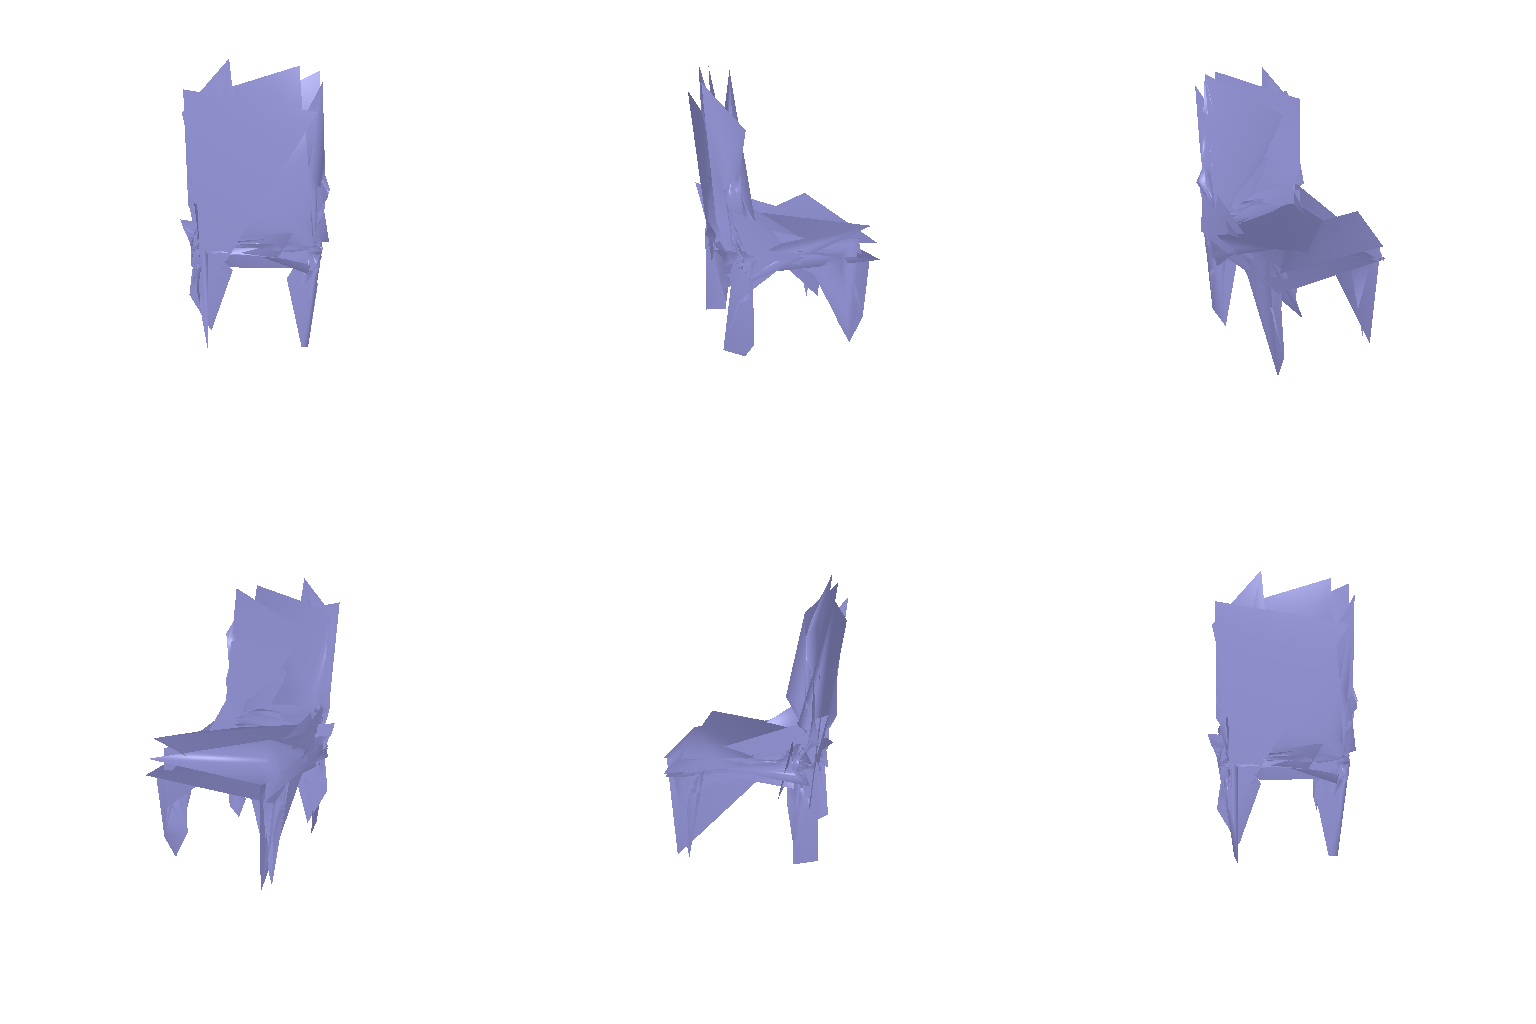
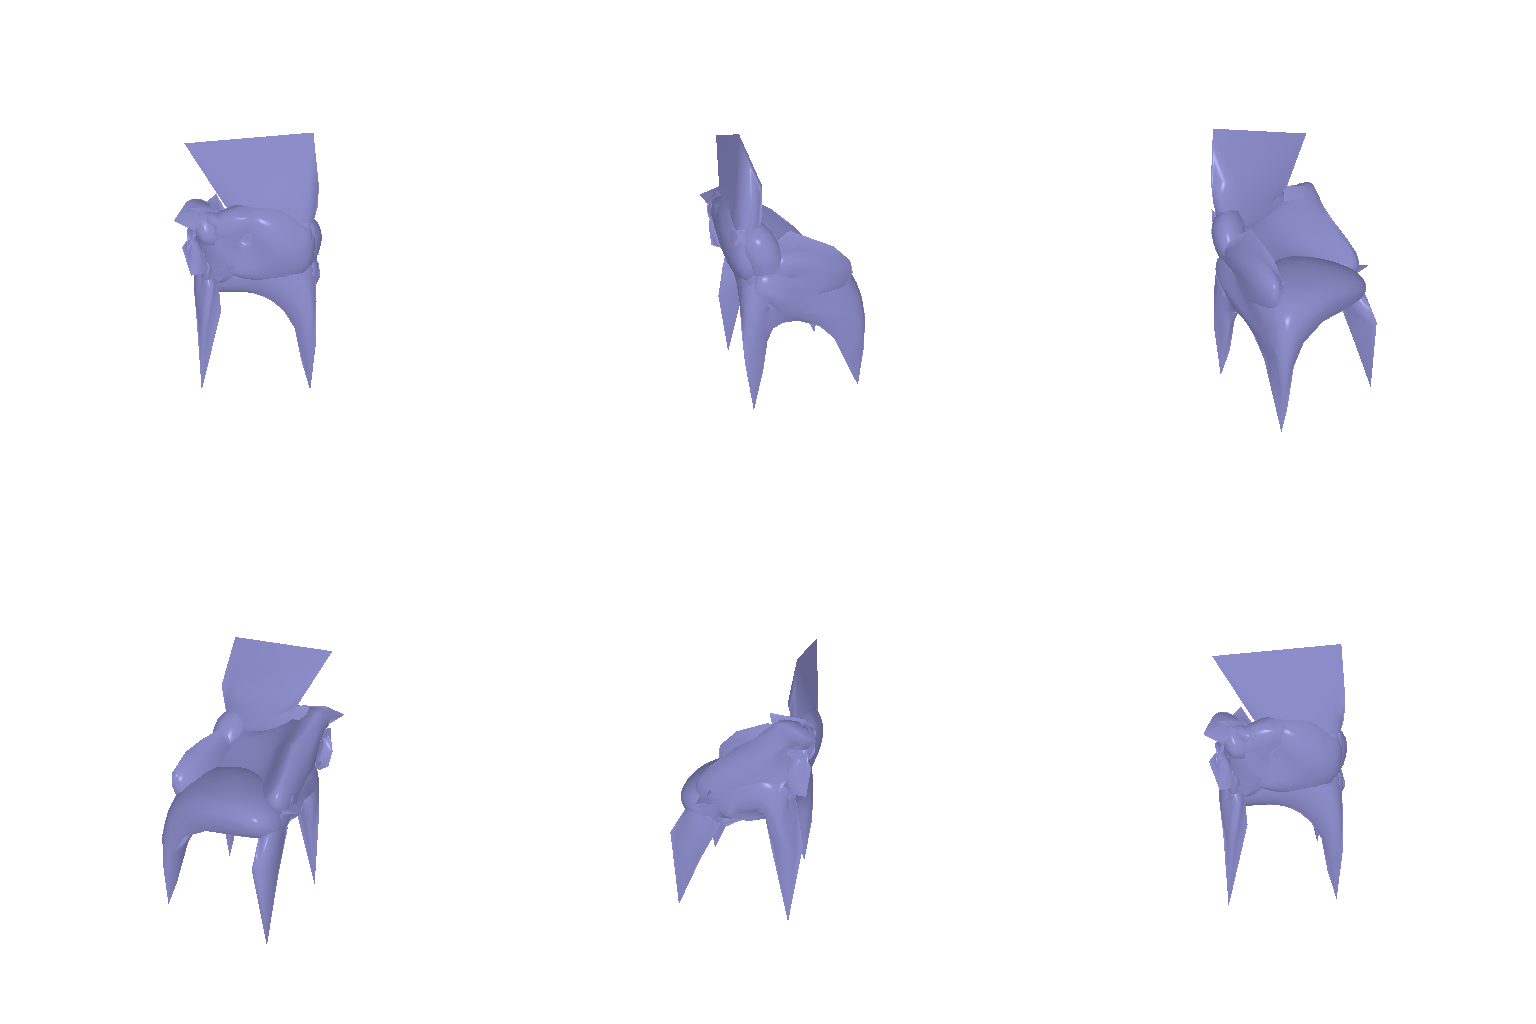
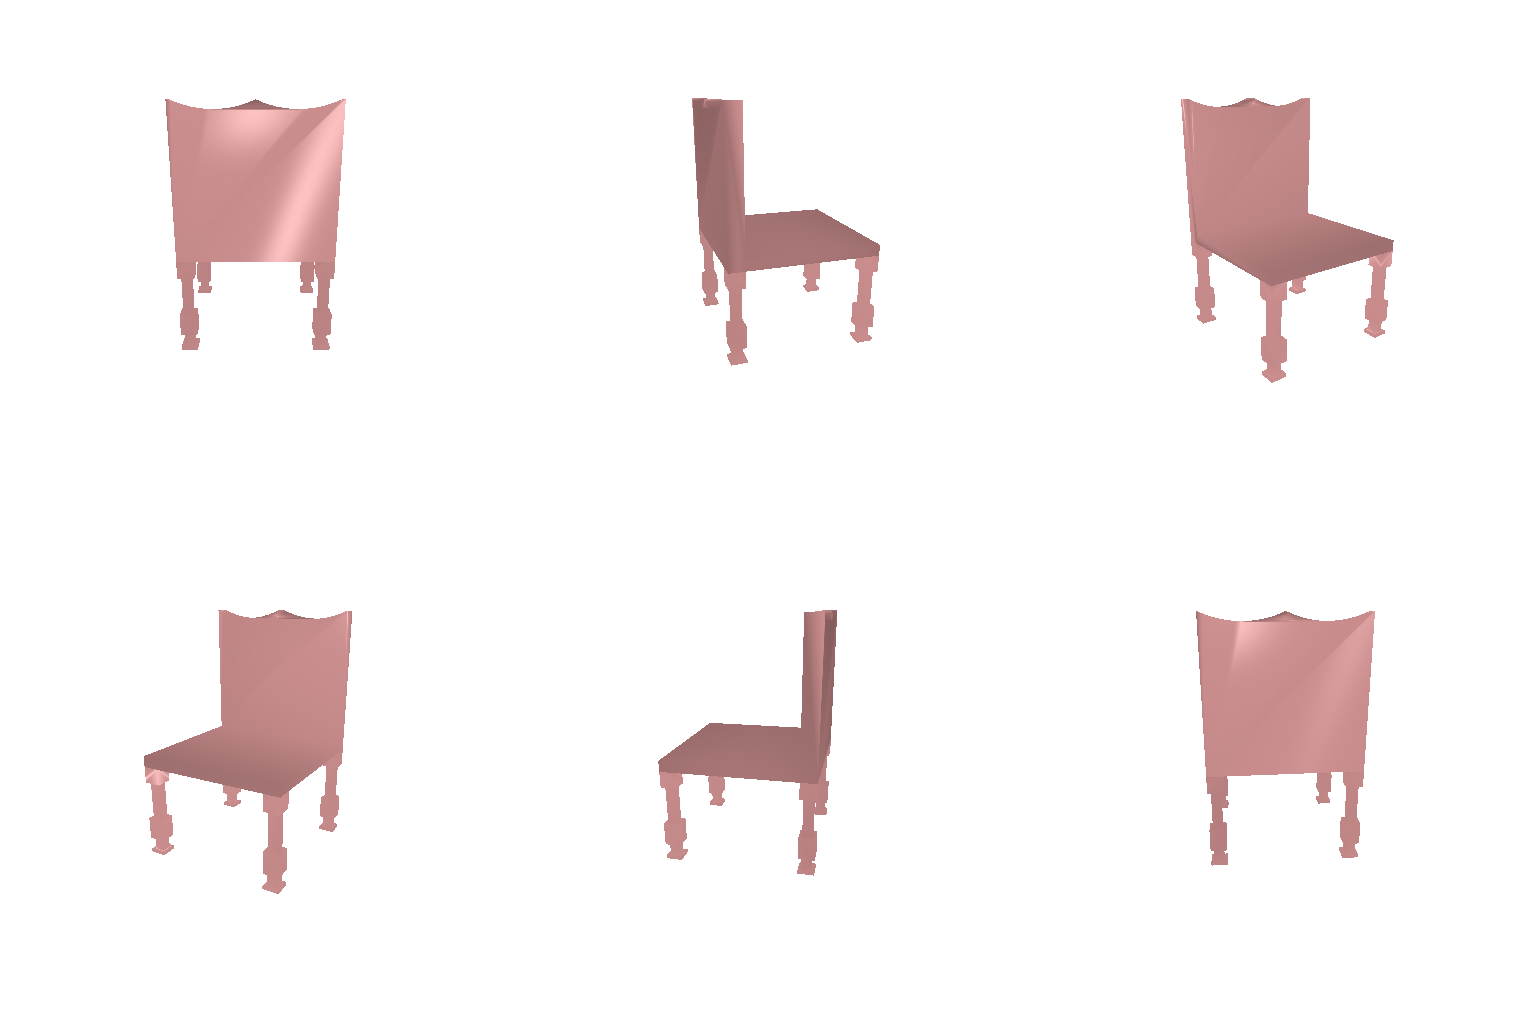
Decoder
The decoder deforms a level-4 ico-sphere (2,562 vertices, 5,120 faces): an MLP with three
hidden layers of width 1,024 maps the feature to an offset per vertex. The loss is
chamfer_loss between 1,000 points sampled from the predicted and the ground-truth
surfaces, plus w_smooth times the Laplacian smoothness_loss from
1.3.
Model selection
I first chose w_smooth, then tried three changes on top of the best value
(0.01):
- B: start from an ico-sphere of radius 0.5 instead of 1, closer to the chairs' mean half-extents (0.24, 0.35, 0.25).
- C: add
mesh_edge_loss(weight 1, keeps triangles from stretching) andmesh_normal_consistency(weight 0.1, keeps neighboring faces from folding). - D: start from the ico-sphere scaled into an ellipsoid with the chairs' mean half-extents.
| Variant | Validation F1@0.05 | Precision | Recall |
|---|---|---|---|
| w_smooth 0.01 | 73.1 | 70.3 | 77.1 |
| w_smooth 0.1 (starter default) | 72.3 | 69.0 | 76.6 |
| w_smooth 1 | 67.2 | 65.5 | 70.0 |
| B: radius 0.5 | 75.0 | 73.0 | 77.8 |
| B + C: radius 0.5, edge + normal | 67.9 | 63.0 | 75.0 |
| D + C: ellipsoid, edge + normal | 67.8 | 65.1 | 72.1 |
I retrained three models on all 6,100 chairs: plain Chamfer + Laplacian, B (best on validation) and the regularized B + C (chosen over D + C, which scored within 0.1).
Evaluation
| Model (678 test chairs) | F1@0.05 | Precision | Recall |
|---|---|---|---|
| Chamfer + Laplacian (w_smooth 0.01) | 74.9 | 72.1 | 78.6 |
| B: radius 0.5 | 73.8 | 71.9 | 76.7 |
| Regularized (B + C) | 68.4 | 63.5 | 75.7 |
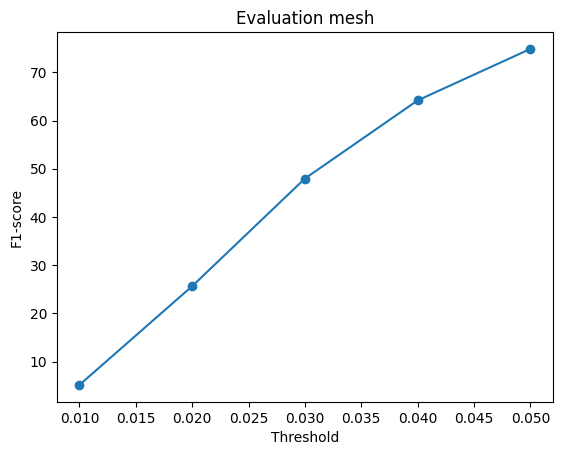
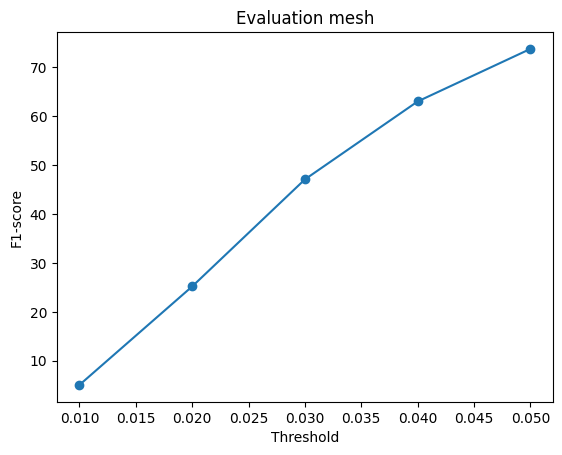
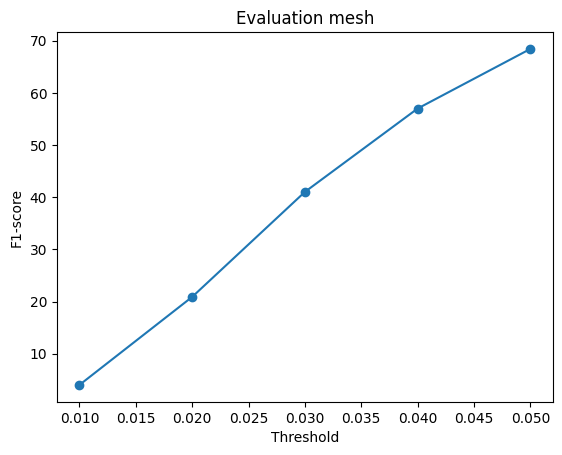
- B is not reliably better. It led by 1.9 F1@0.05 on validation but trails by 1.1 on test. Each number is a single run, so I count it as a tie.
- Unregularized surfaces are crumpled, with folds, self-intersecting sheets and spikes. The regularized model gives smooth, mostly fold-free surfaces with a seat, back and leg stubs, at a cost of 5.4 F1 against B.
- The sphere cannot open holes. Legs become cones, and the surface has to stretch across the gaps between legs and behind the back. That extra surface sticks out: over 97 test chairs the predicted bounding boxes are 10–15% larger than the ground truth for the plain model and 5–7% larger for the regularized one.
Voxels vs. point clouds vs. meshes
| Representation (final model) | Test F1@0.05 | Precision | Recall |
|---|---|---|---|
| Voxel grid (2.1, pos_weight 2) | 62.1 | 61.4 | 64.8 |
| Point cloud (2.2) | 80.1 | 81.2 | 81.3 |
| Mesh (2.3, Chamfer + Laplacian) | 74.9 | 72.1 | 78.6 |
- Point clouds score best because nothing constrains them. Each point can go anywhere, the training loss is the same nearest-point distance that F1@0.05 measures, and thin legs or gaps cost nothing extra.
- Meshes come second. Their points lie on one closed surface deformed from a sphere, which must bridge the gaps between legs and behind the back. Points sampled on those bridges count against precision (72.1, against 81.2 for points).
- Voxels come last because of resolution and the per-cell decision. Anything thinner than one cell (about 0.03 in mesh units) is dropped or thickened to a full cell, and each of the 32,768 cells is an independent yes/no, so an uncertain thin leg tends to vanish. Even ground-truth voxels only reach about 91.7 F1@0.05; points and meshes have no such ceiling.
2.4 Effects of hyperparameter variations
Every setting is trained on 5,800 chairs and scored on the same 300 held-out chairs.
Weight of occupied voxels (image to voxel)
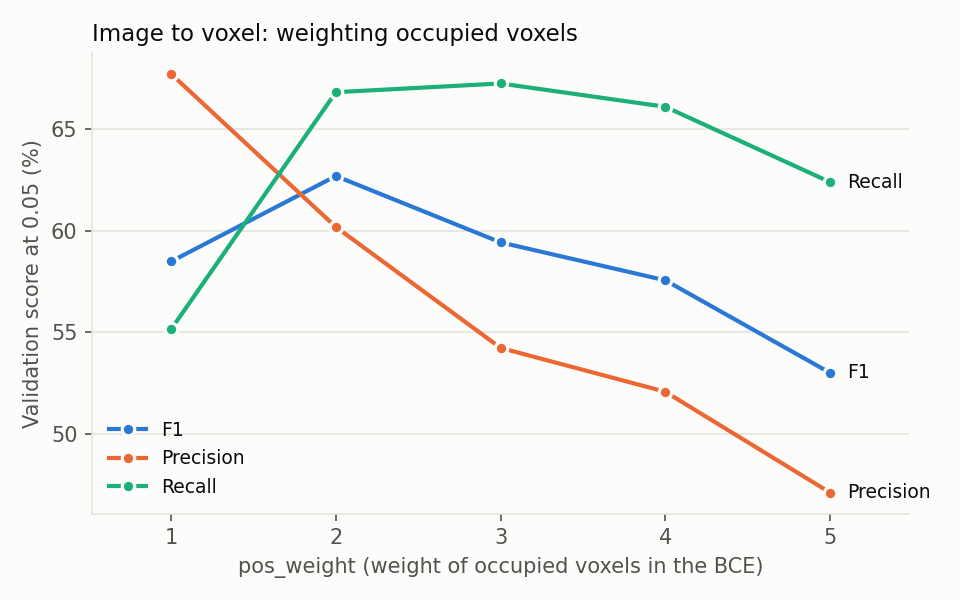
Raising pos_weight moves along a precision/recall trade-off (numbers in the 2.1
table):
- From 1 to 2, recall gains 11.7 points for 7.5 points of precision, so F1@0.05 rises.
- After 2, recall saturates (66.8, 67.3, 66.1) while precision keeps falling by 2–6 points per step, so F1@0.05 falls.
- At 5 even recall drops, likely because the over-filled surfaces move outward, away from the true ones.
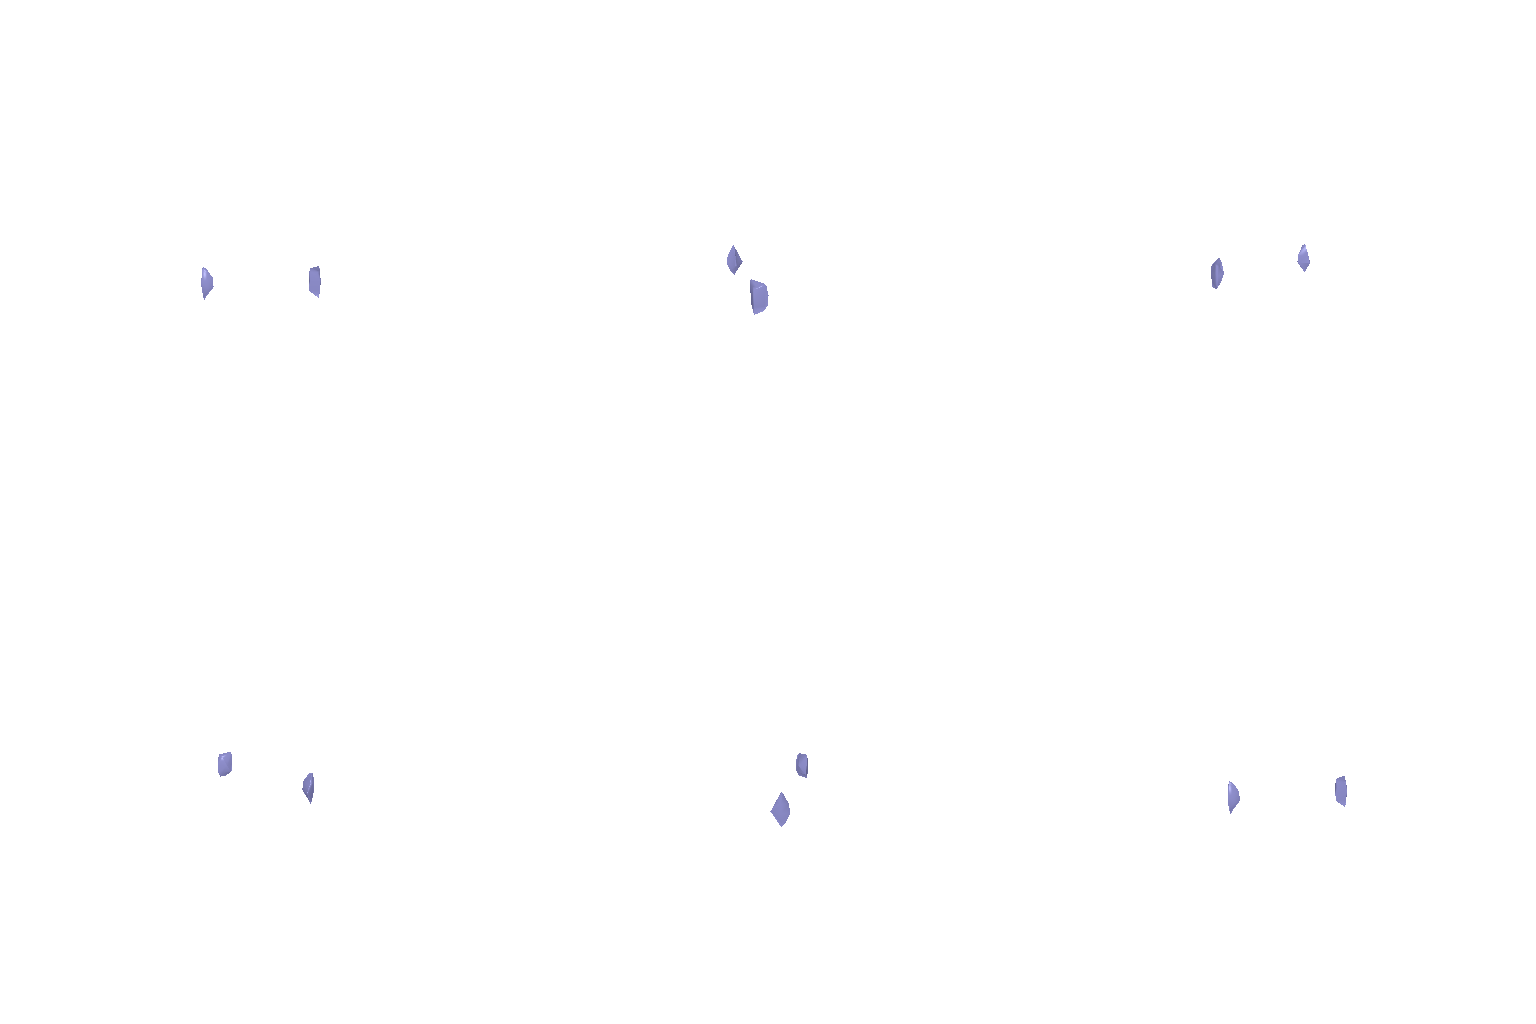
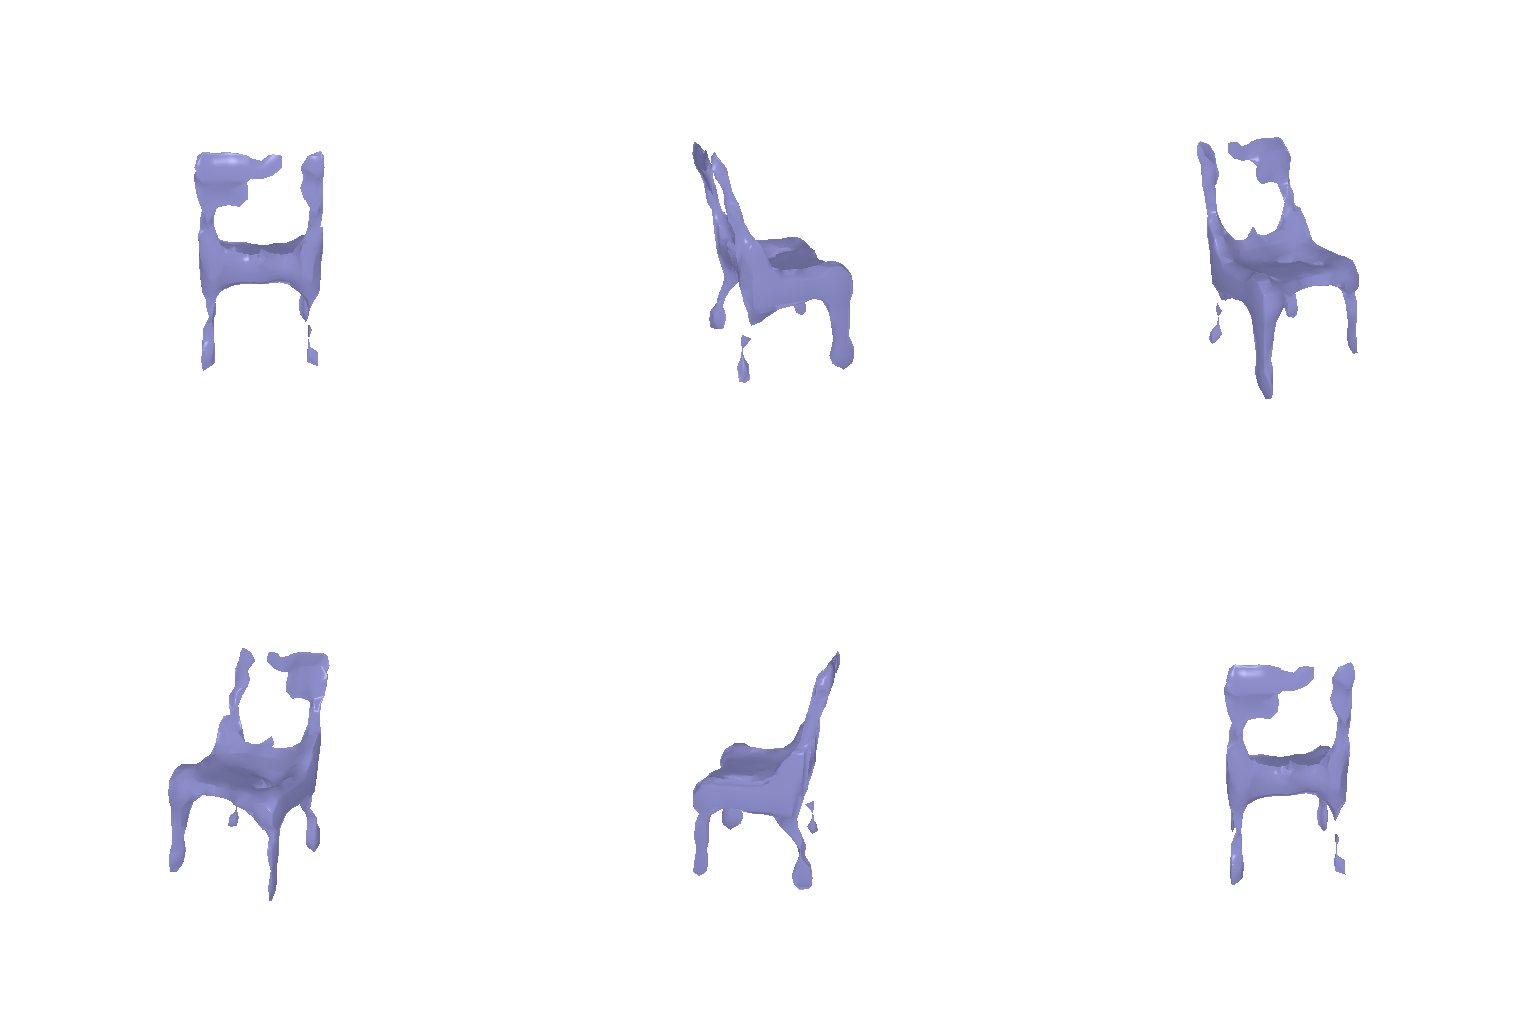
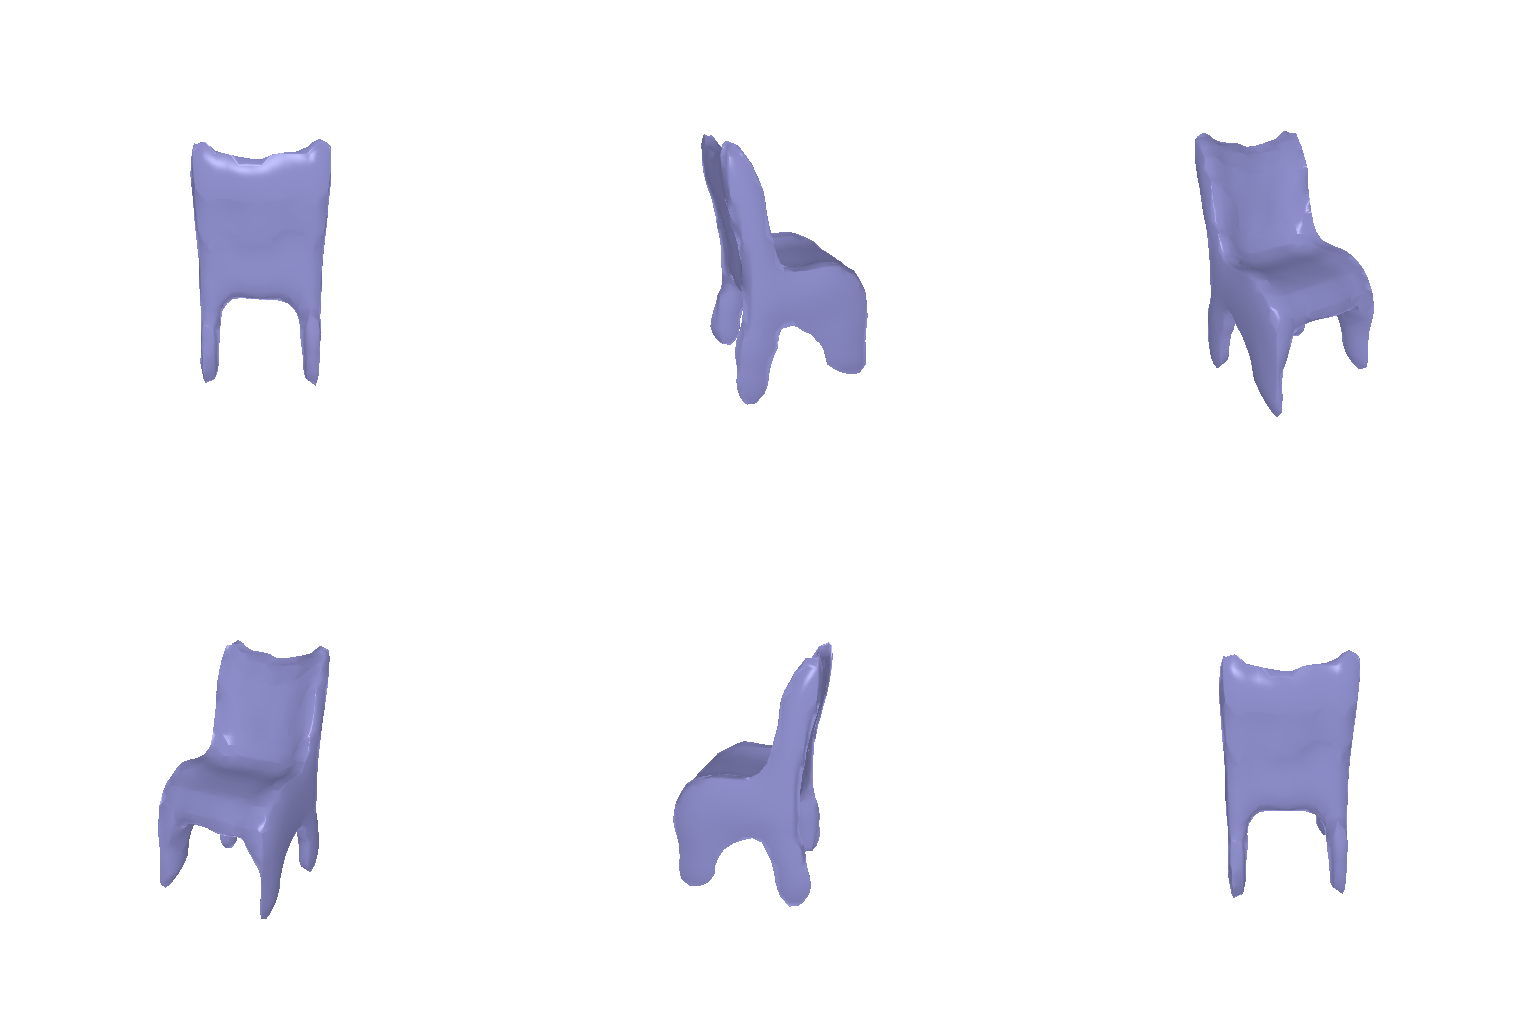
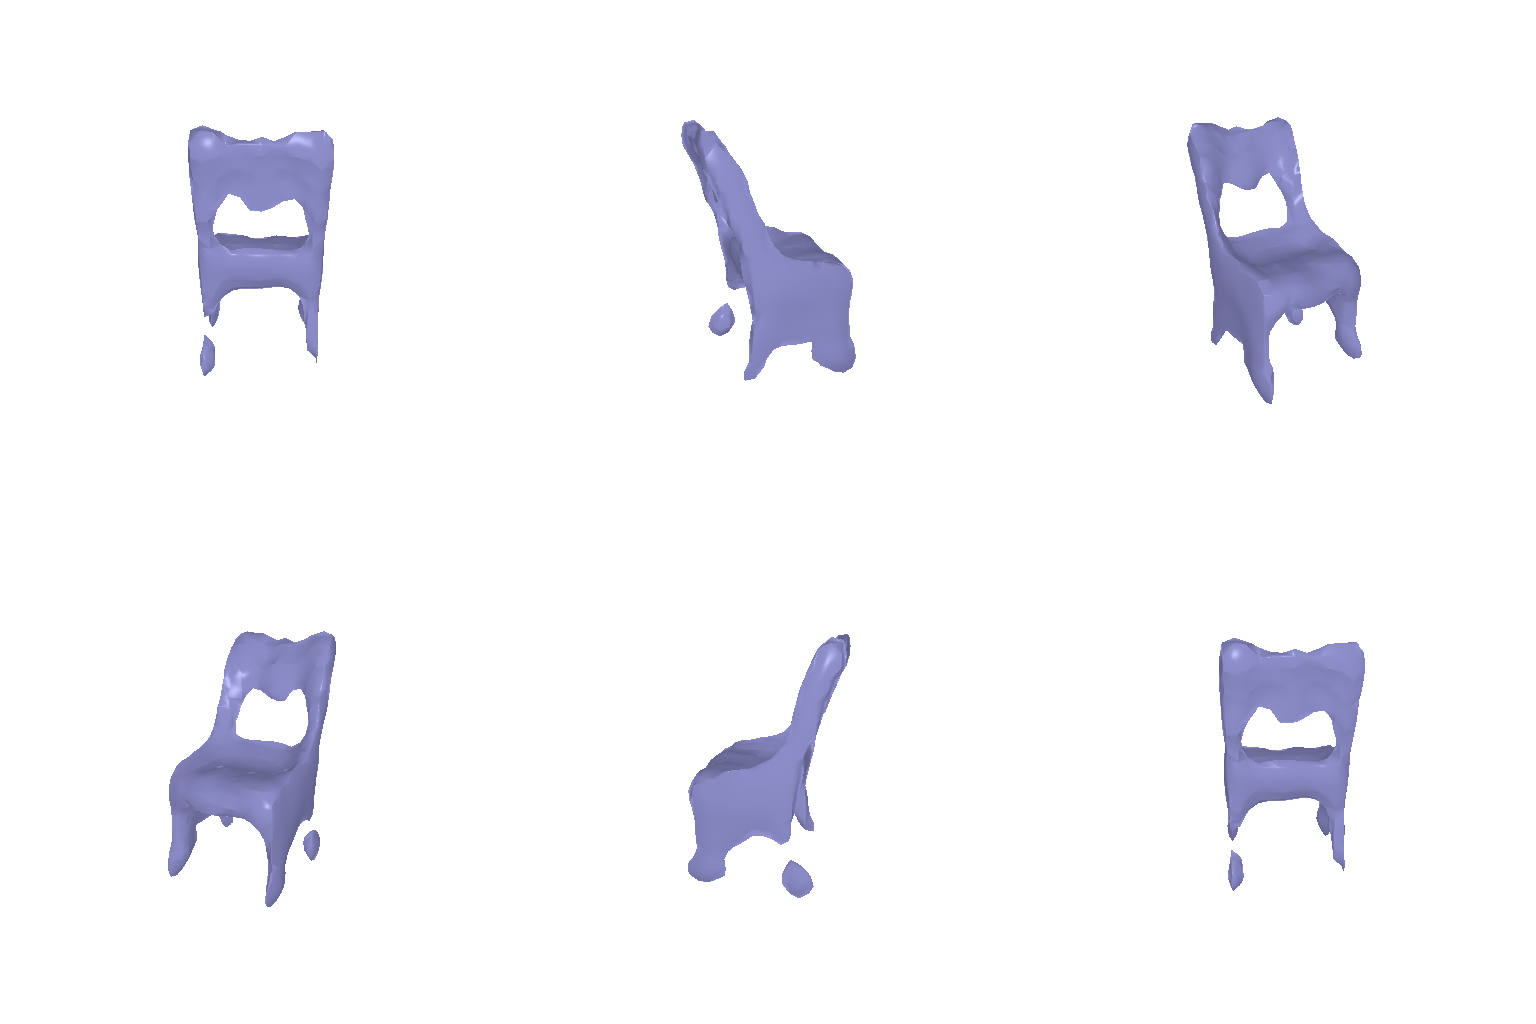
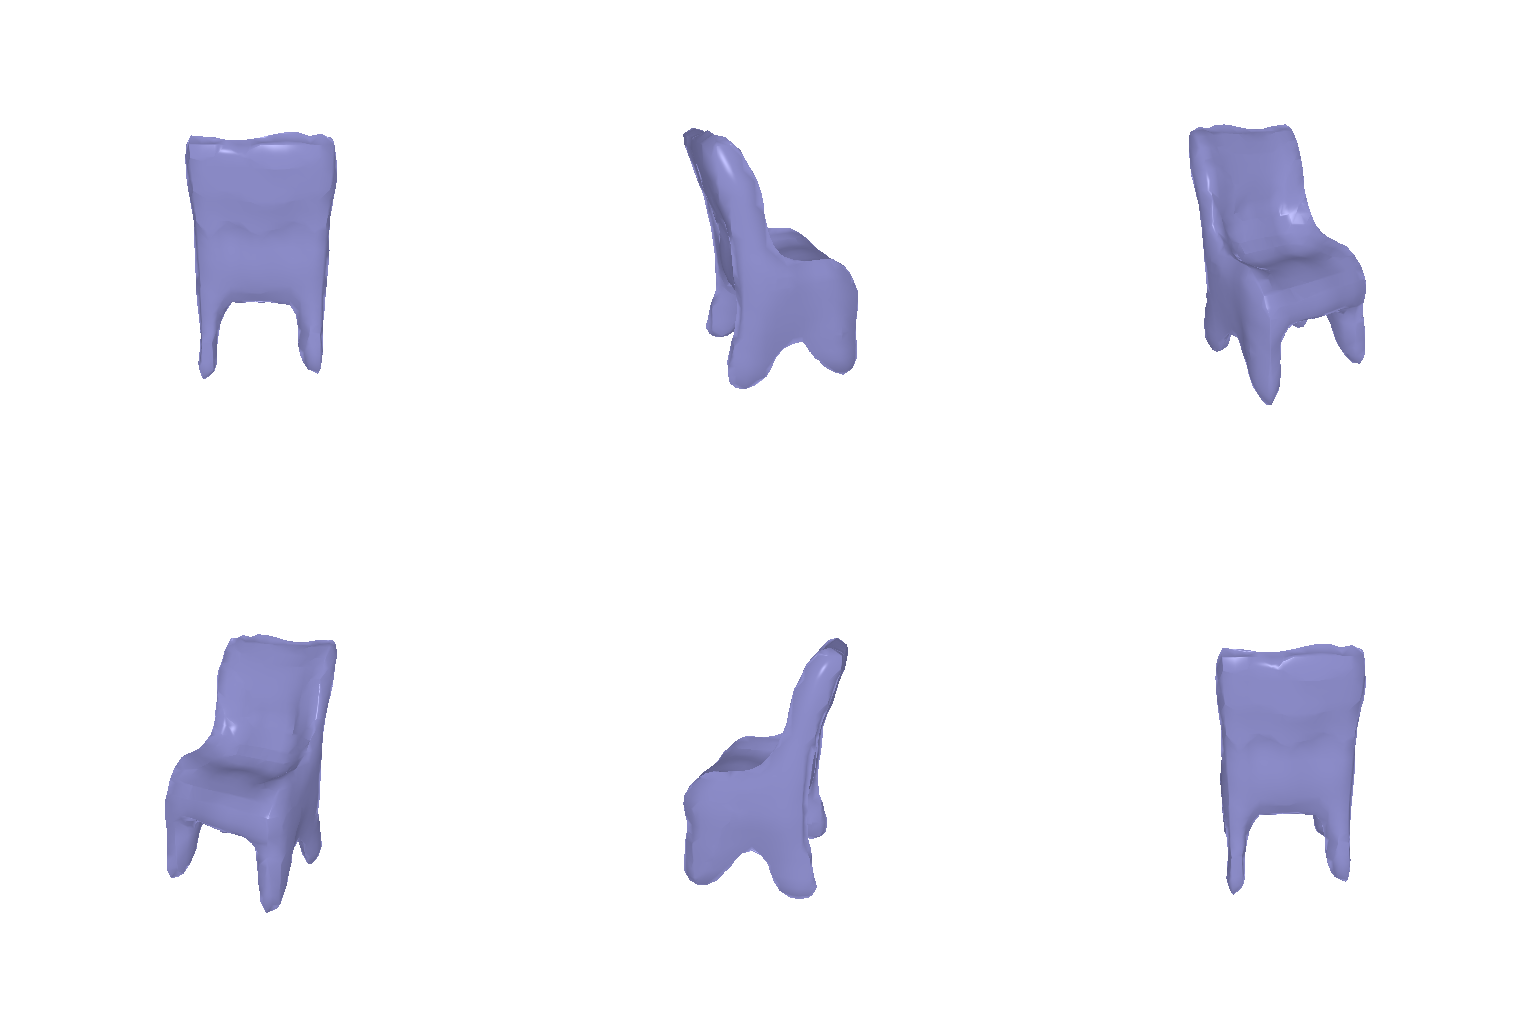
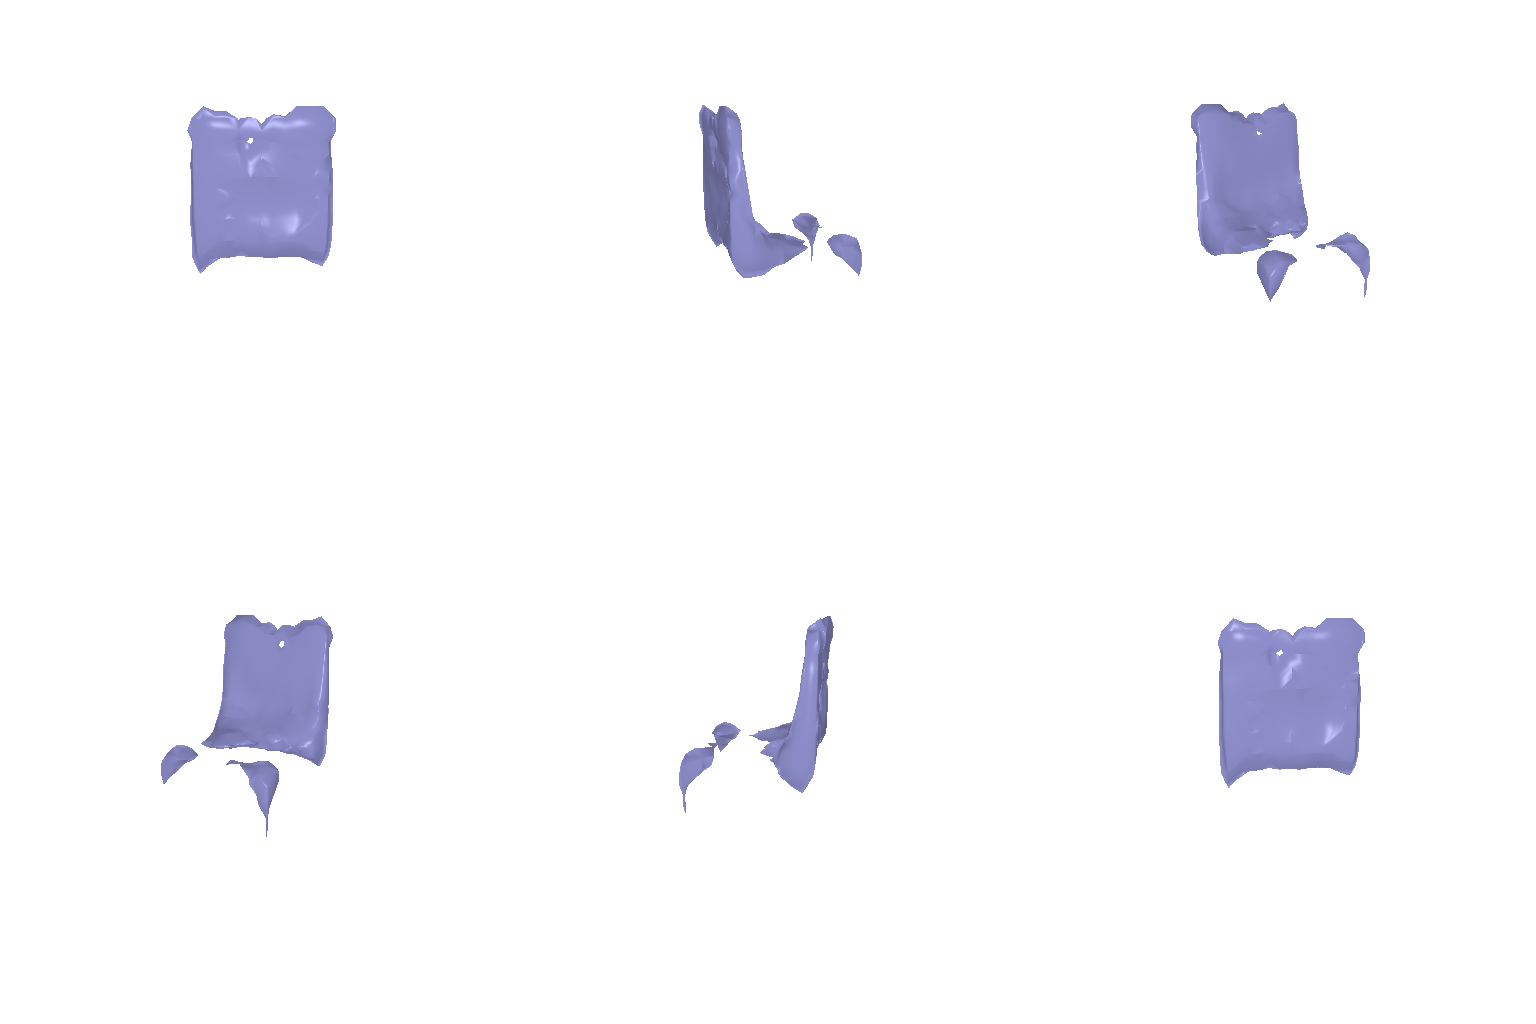
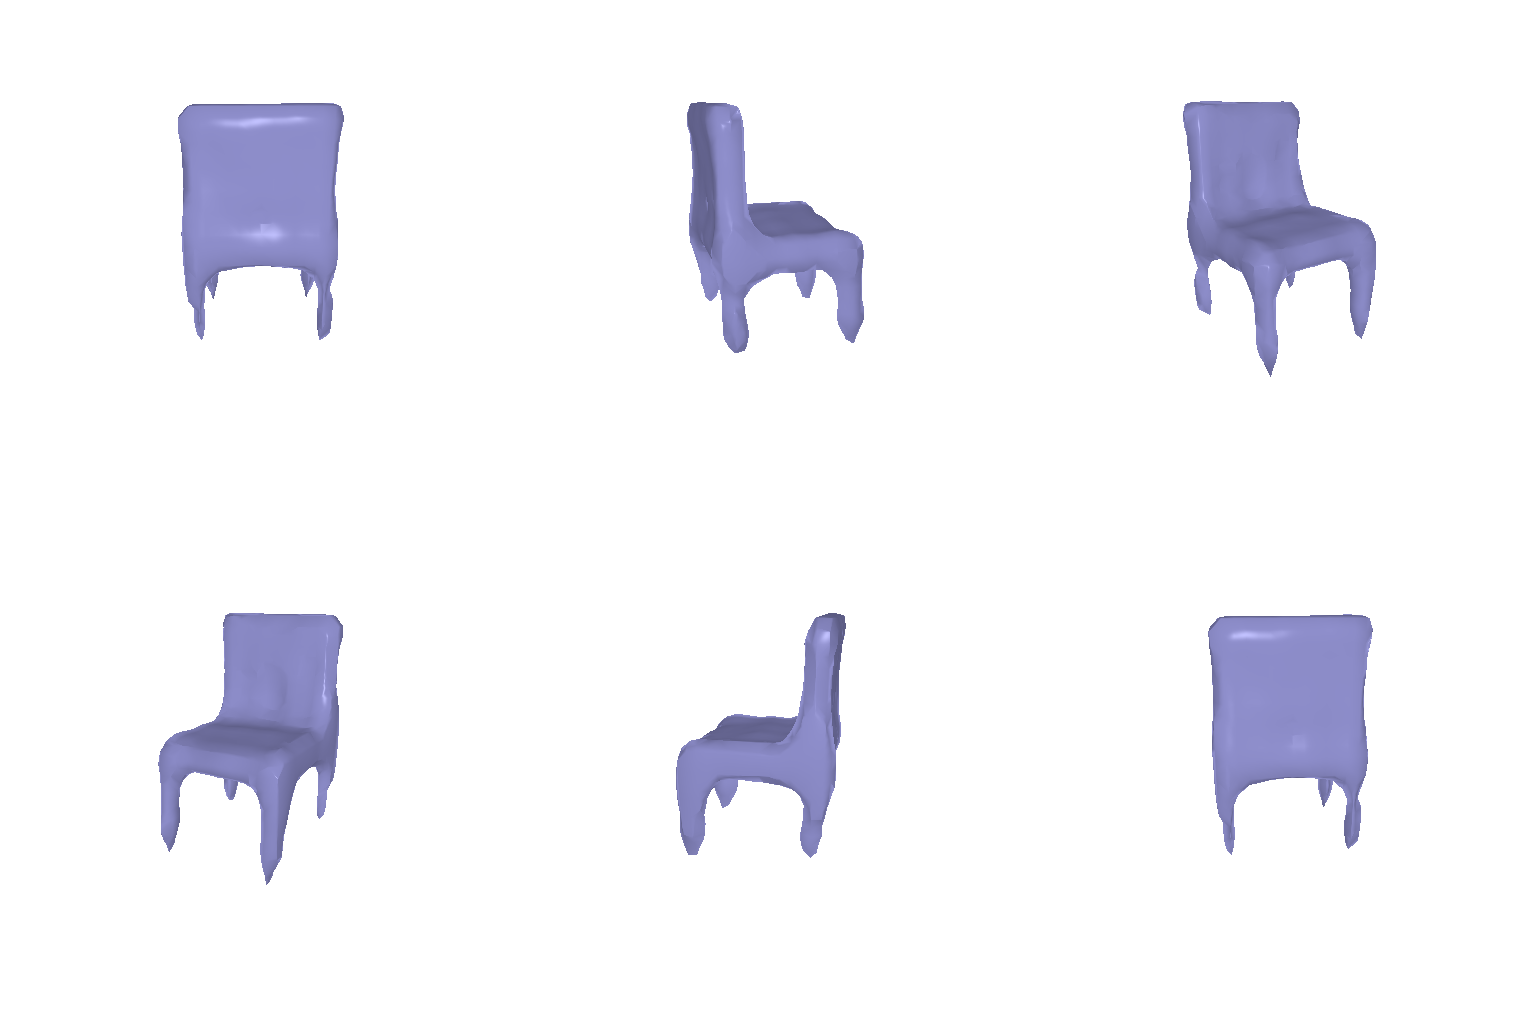
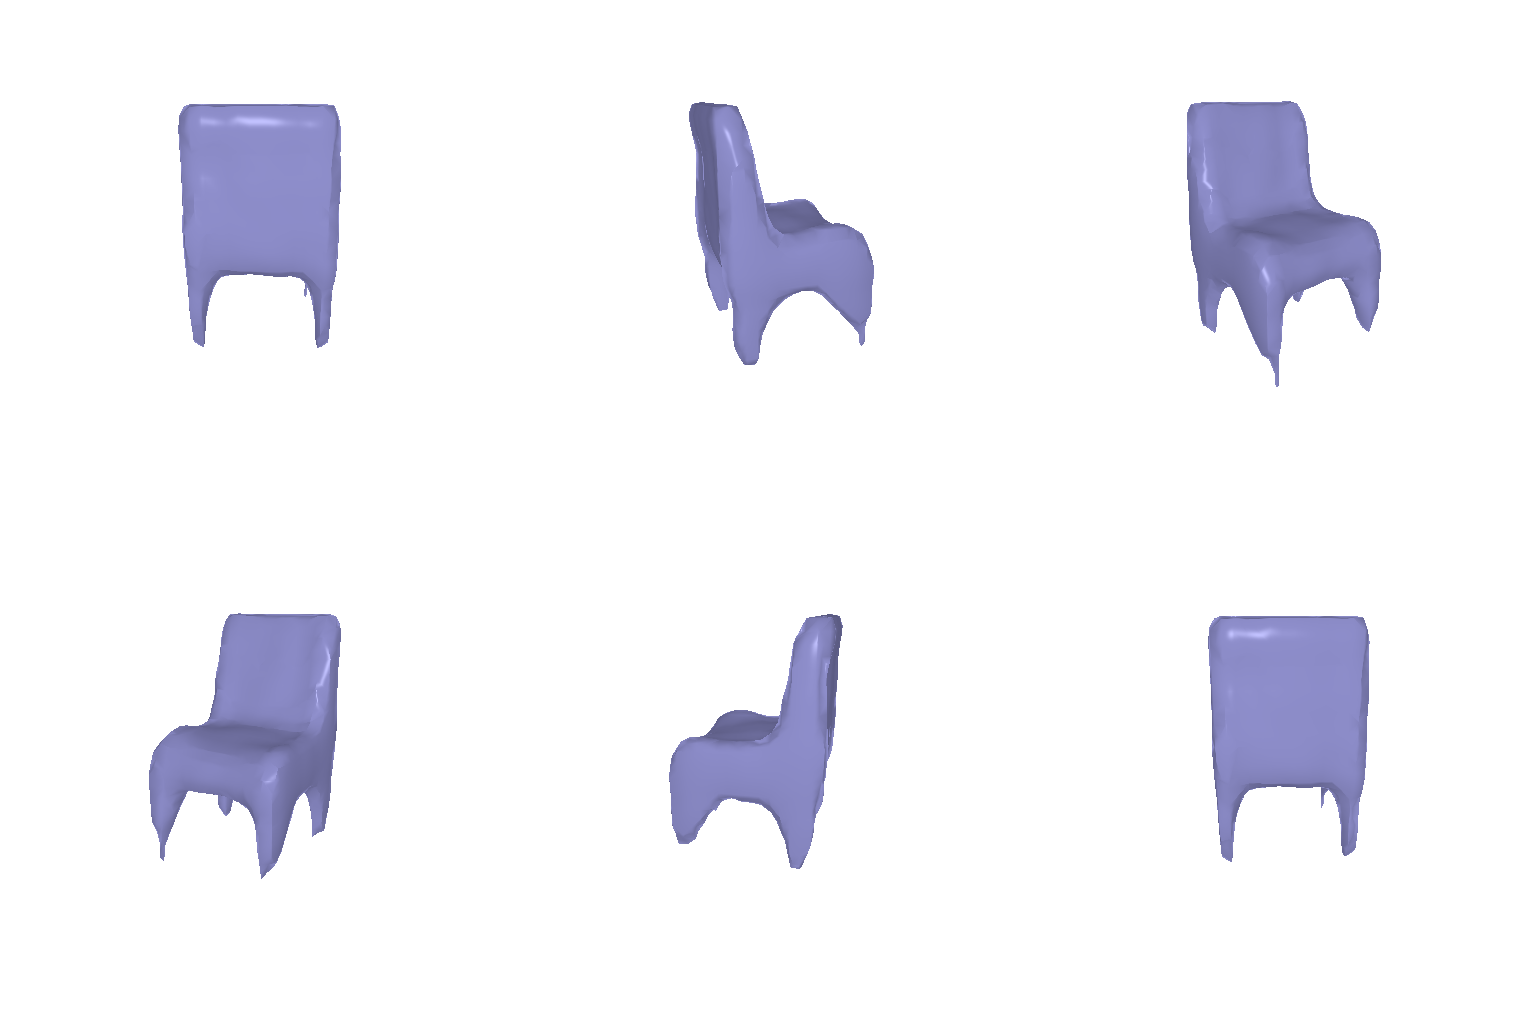
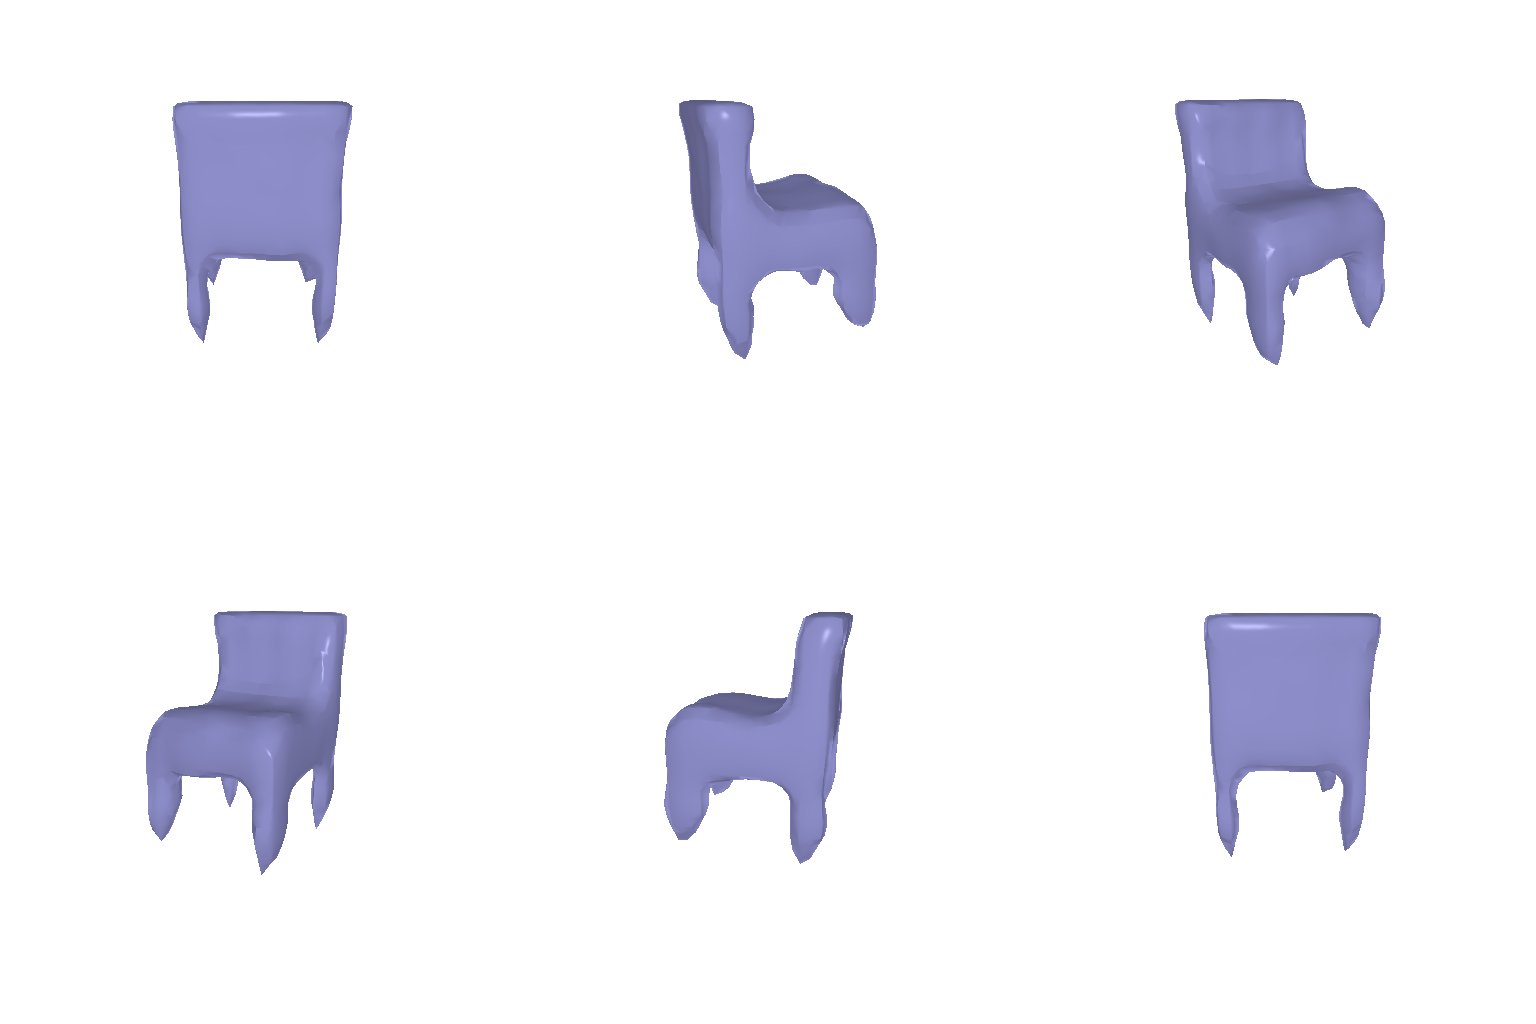
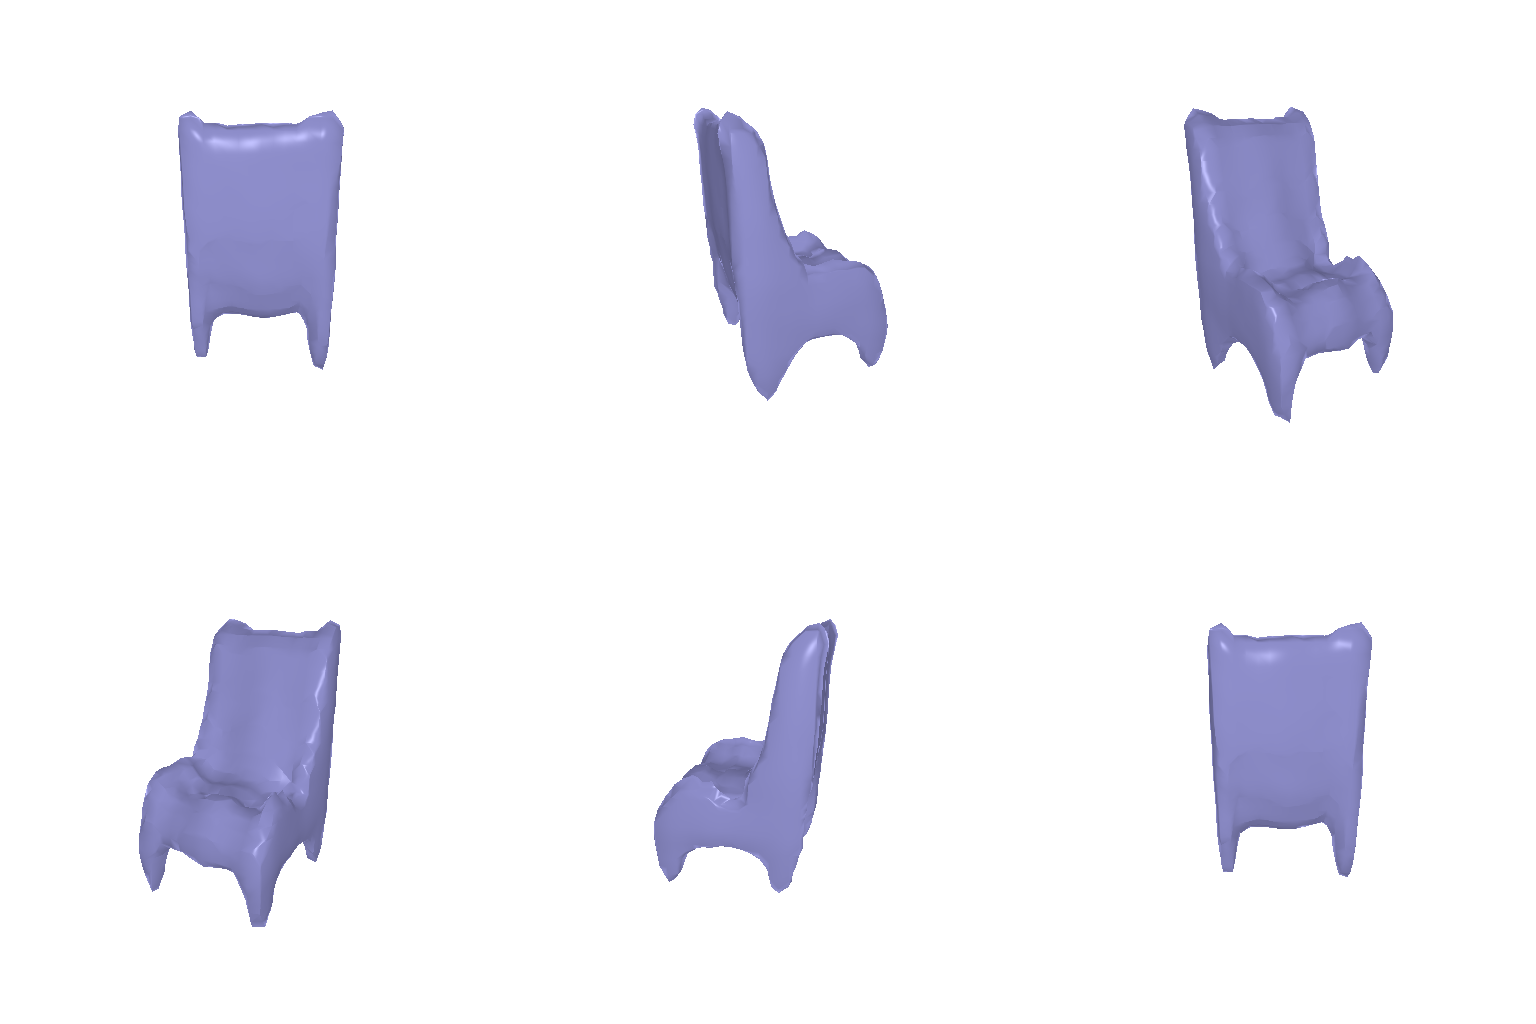
The folding chair goes from a few specks at weight 1 to a complete chair at 3, then swells into a blob at 5. The wooden chair is complete at 2, and higher weights only thicken it. The right weight depends on the chair: thin chairs need a high one and solid chairs a low one, and one global weight can only pick the best average. Single chairs are also noisy (the wooden chair's F1@0.05 is not monotonic), which is why the choice uses 300 of them.
Training length (image to point cloud)
From the 2.2 table: training loss falls from 0.0030 at 10k steps to 0.0019 at 30k, but validation F1@0.05 drops from 79.4 to 77.4, almost entirely through recall (80.4 to 76.4) while precision stays near 80. Longer training overfits.
Smoothing, initial shape and regularizers (image to mesh)
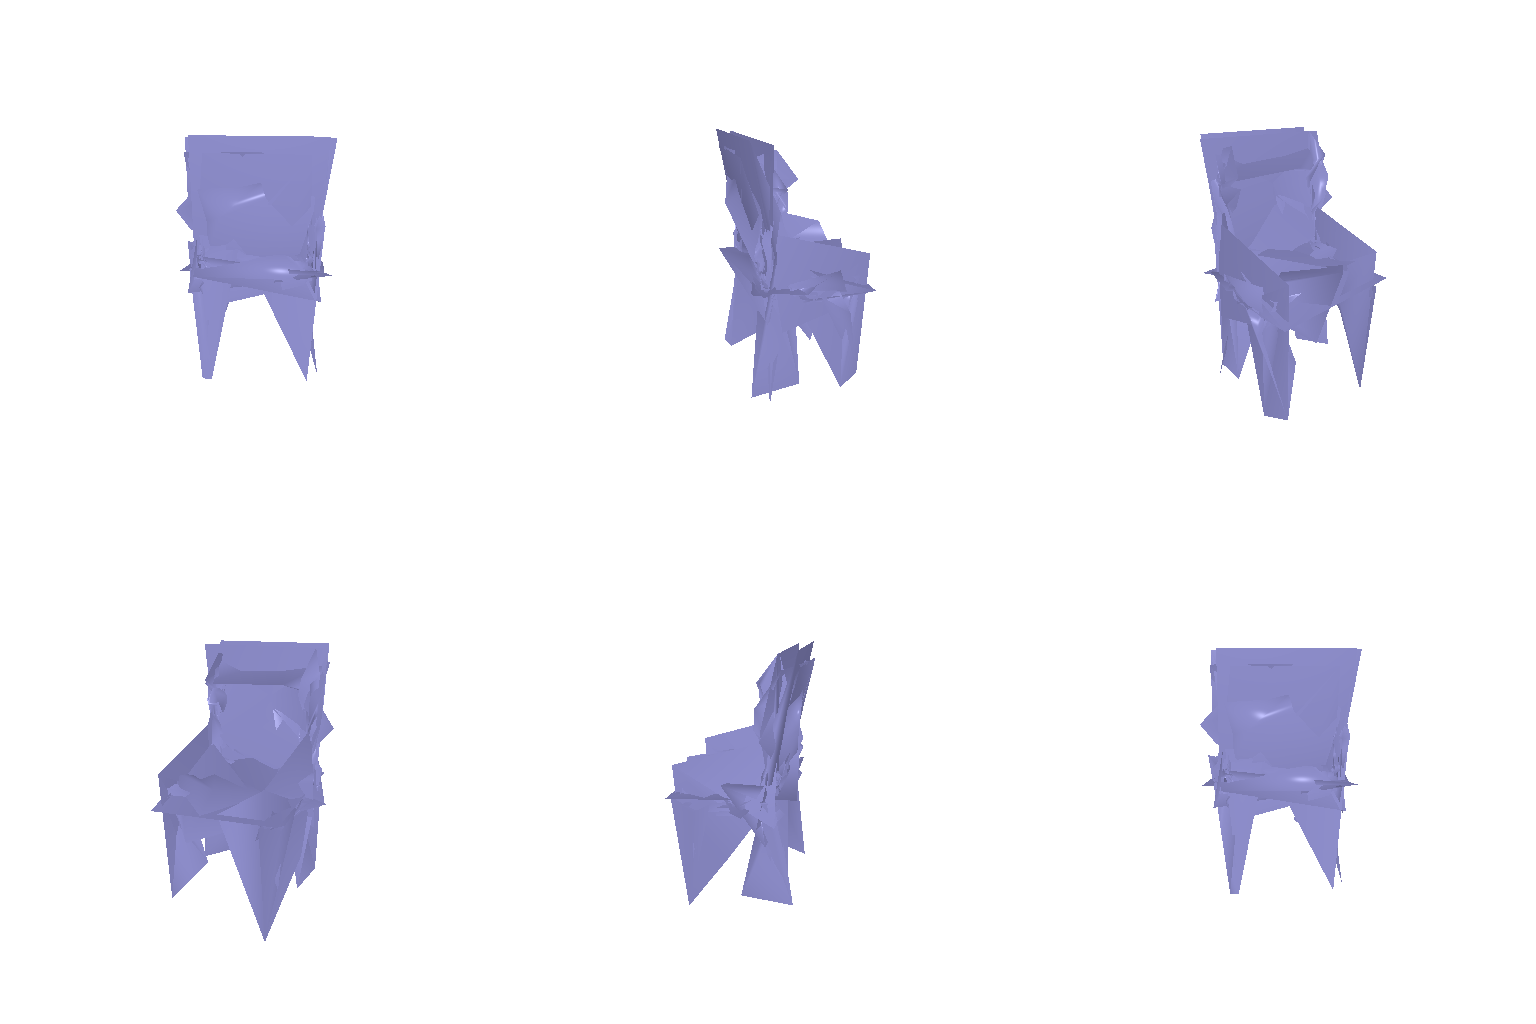
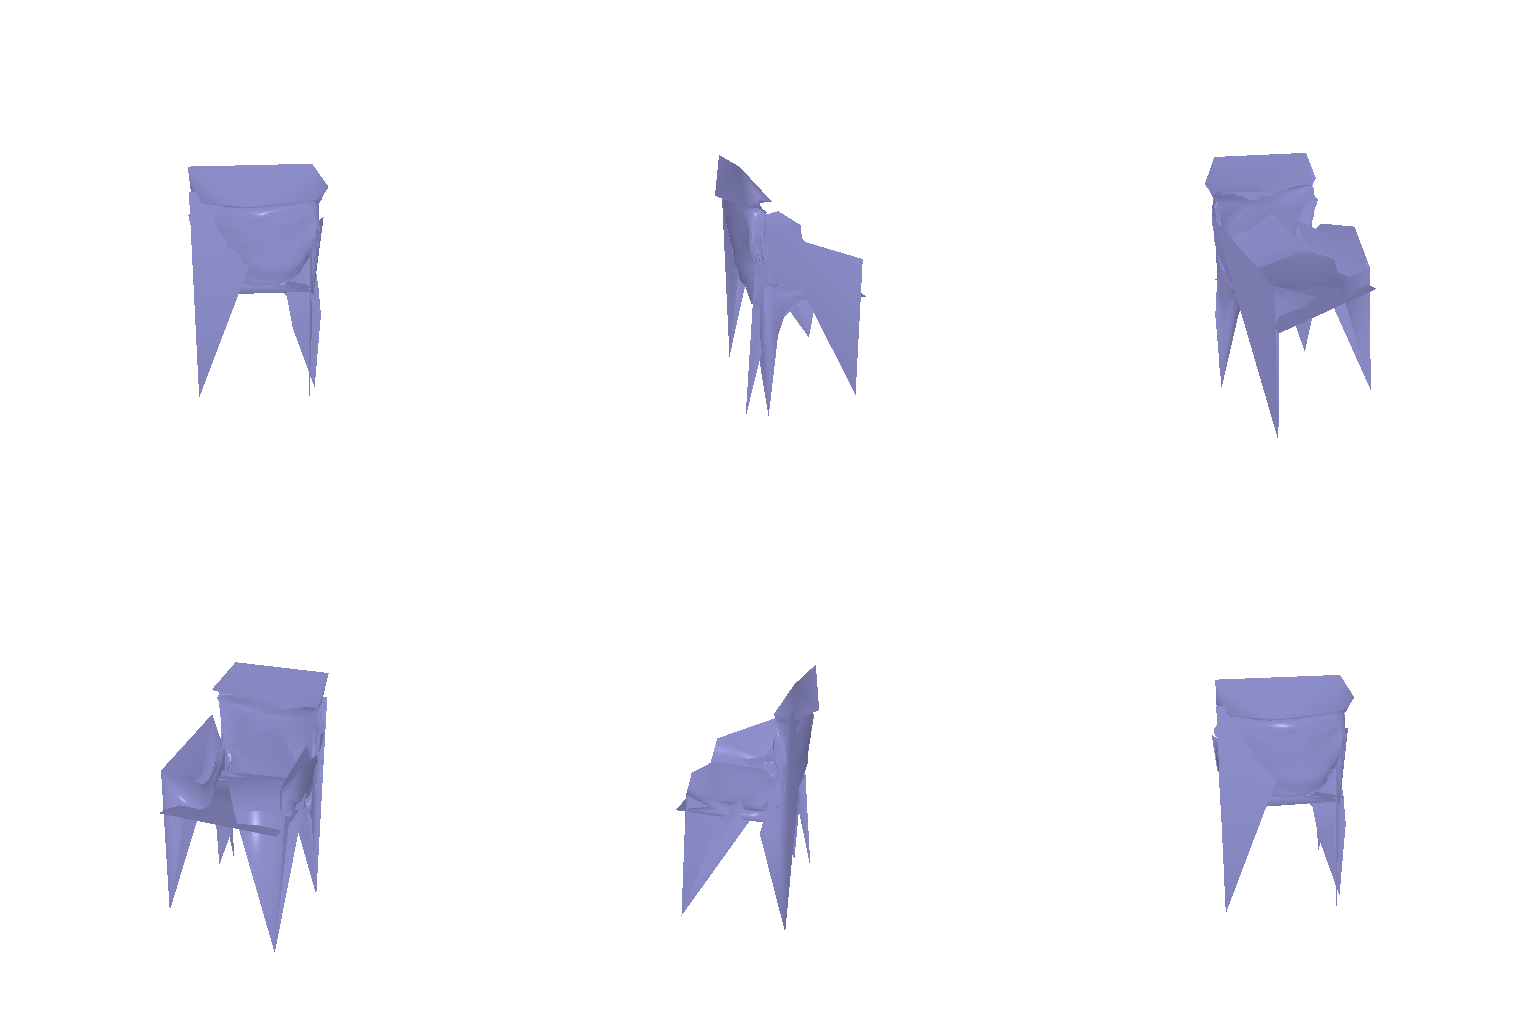
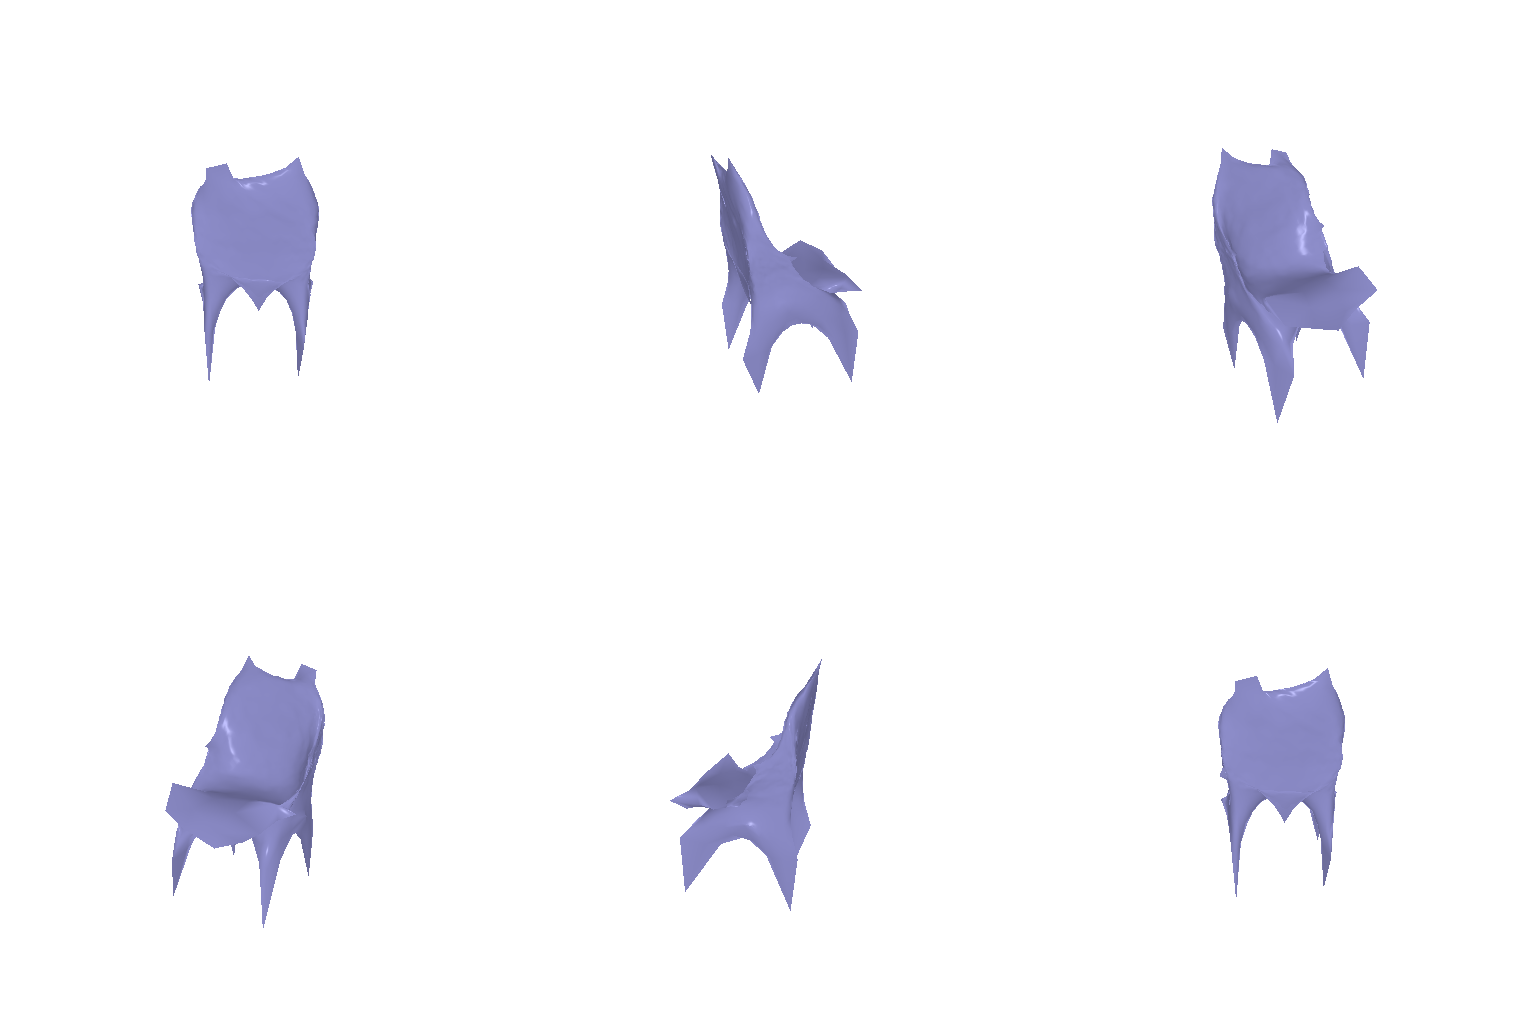
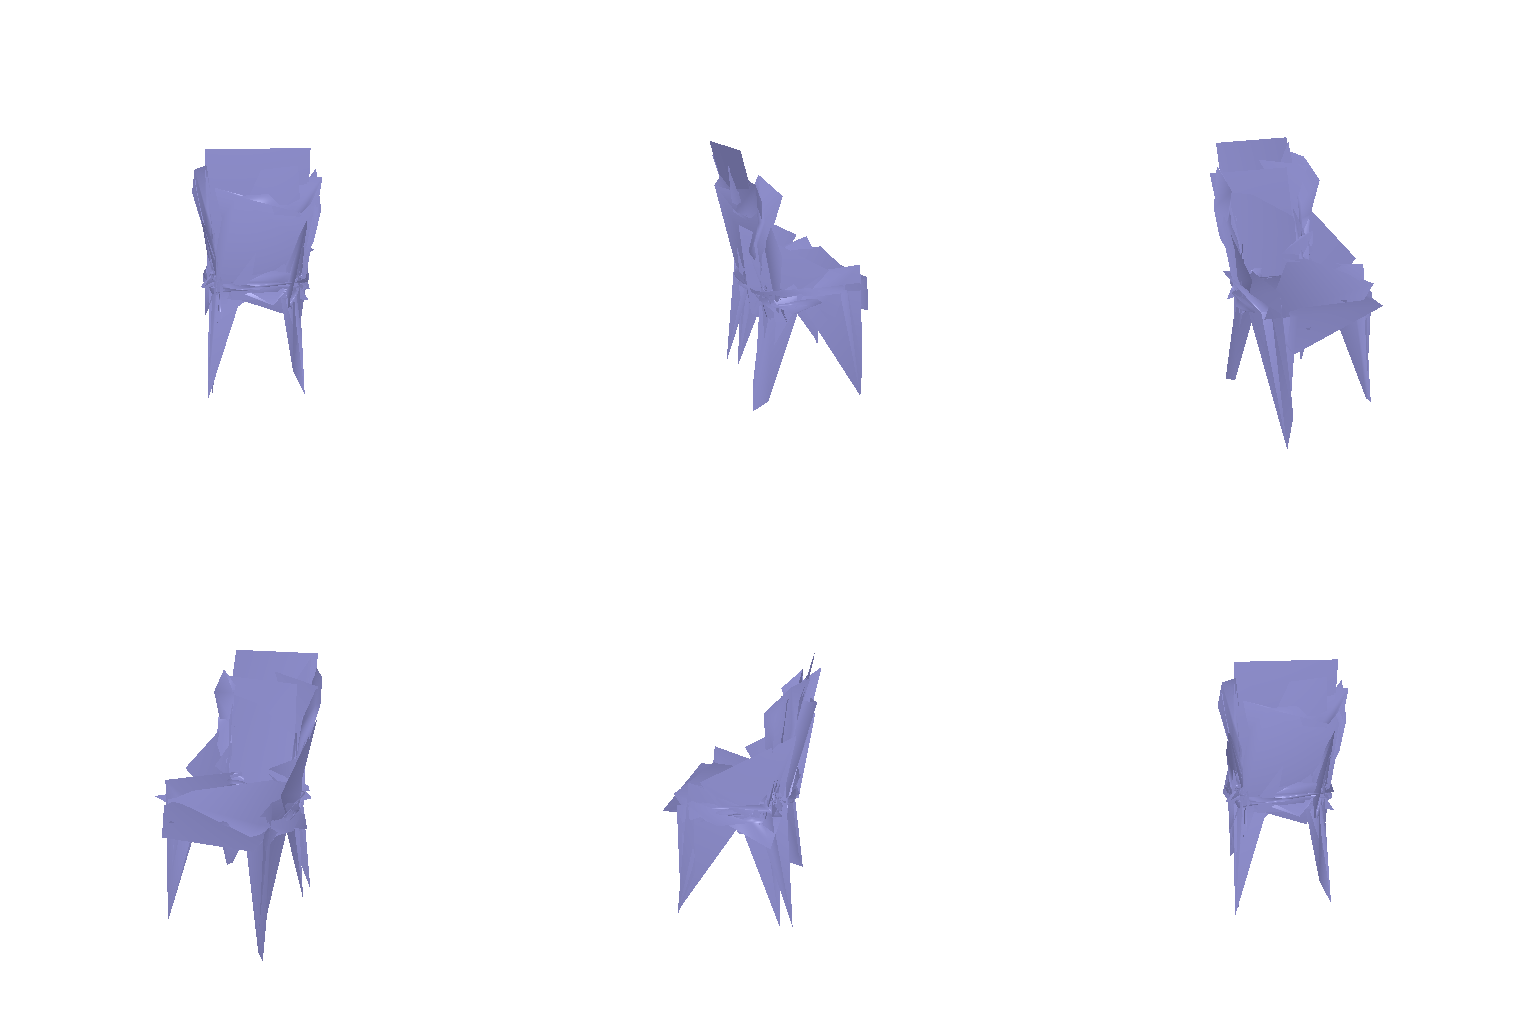
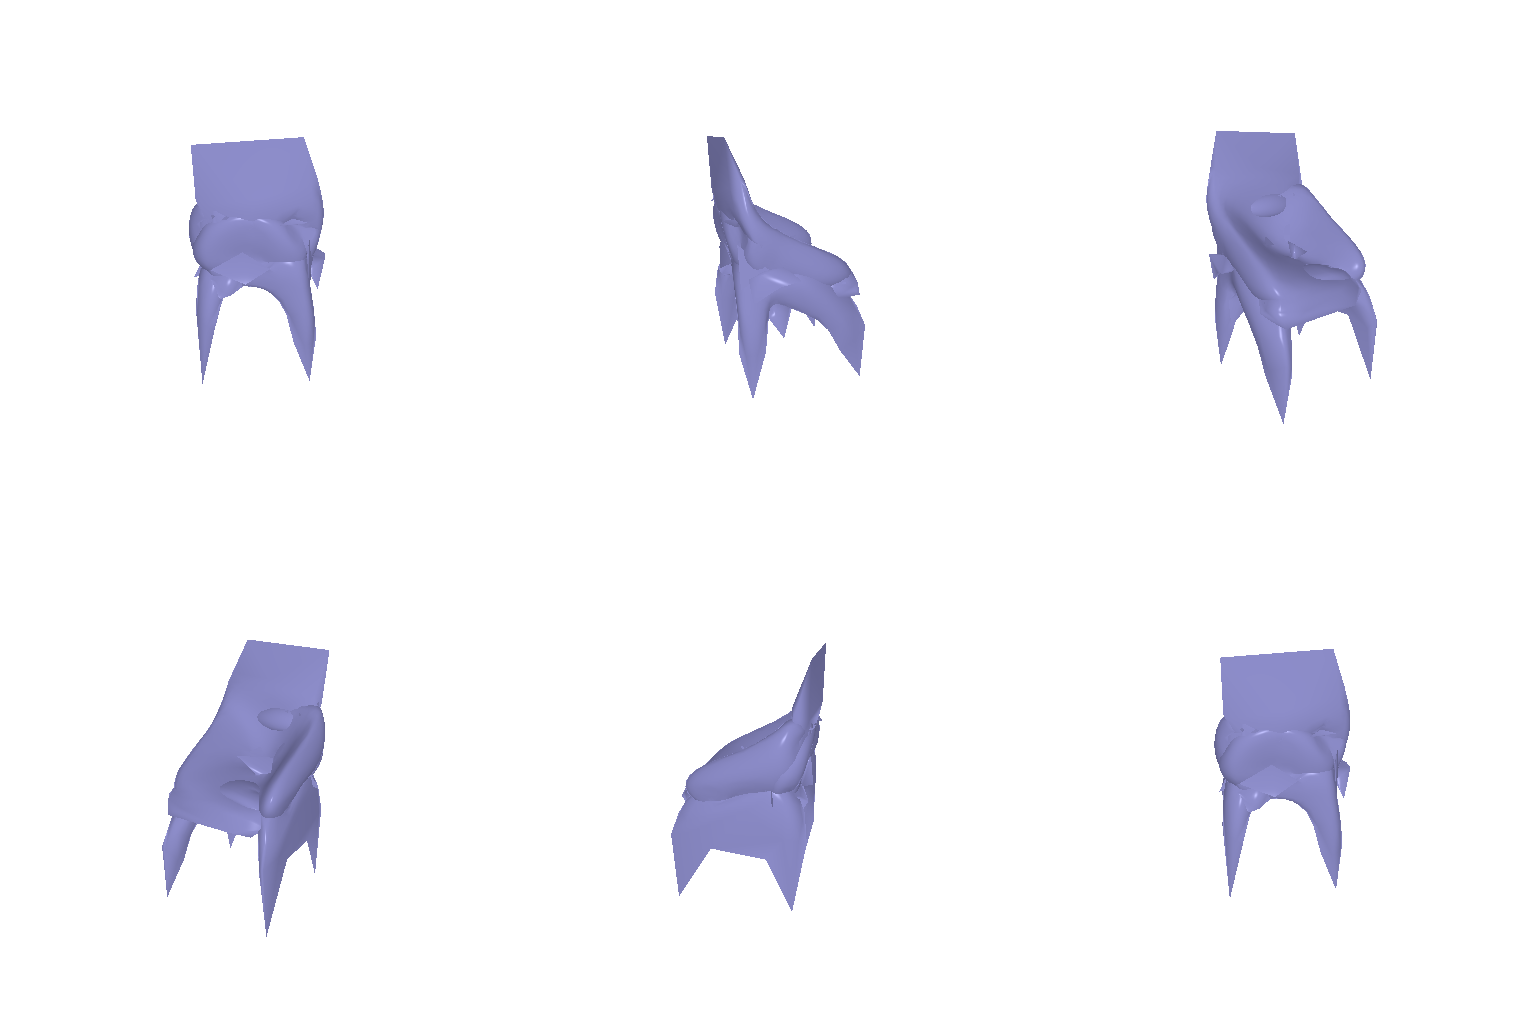
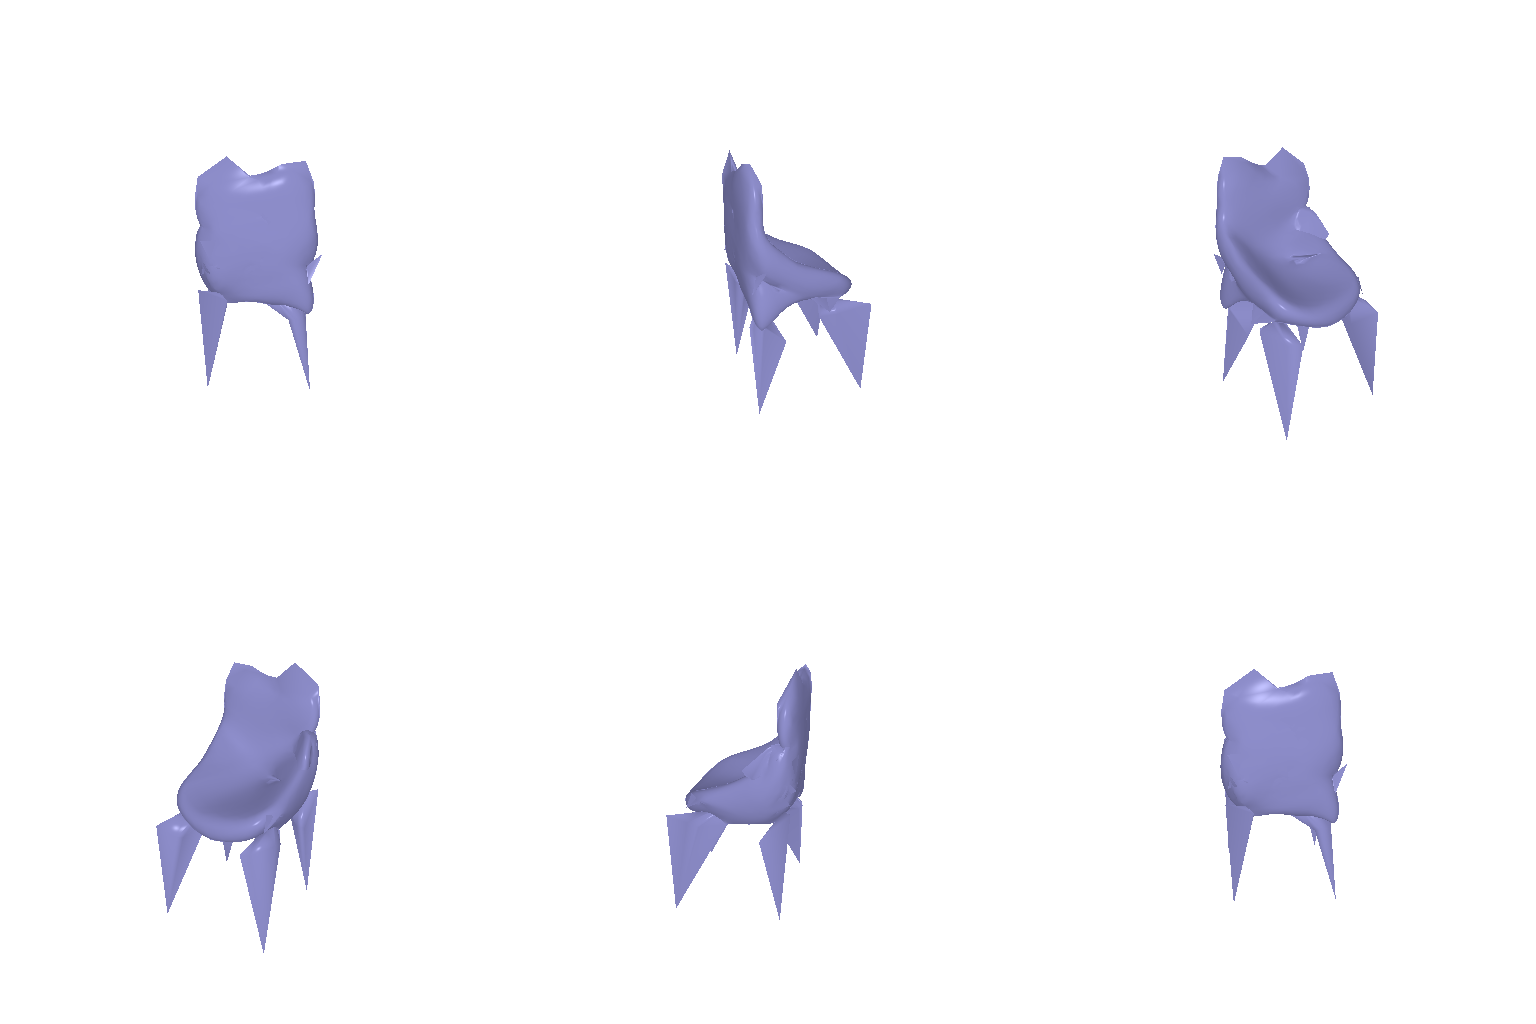
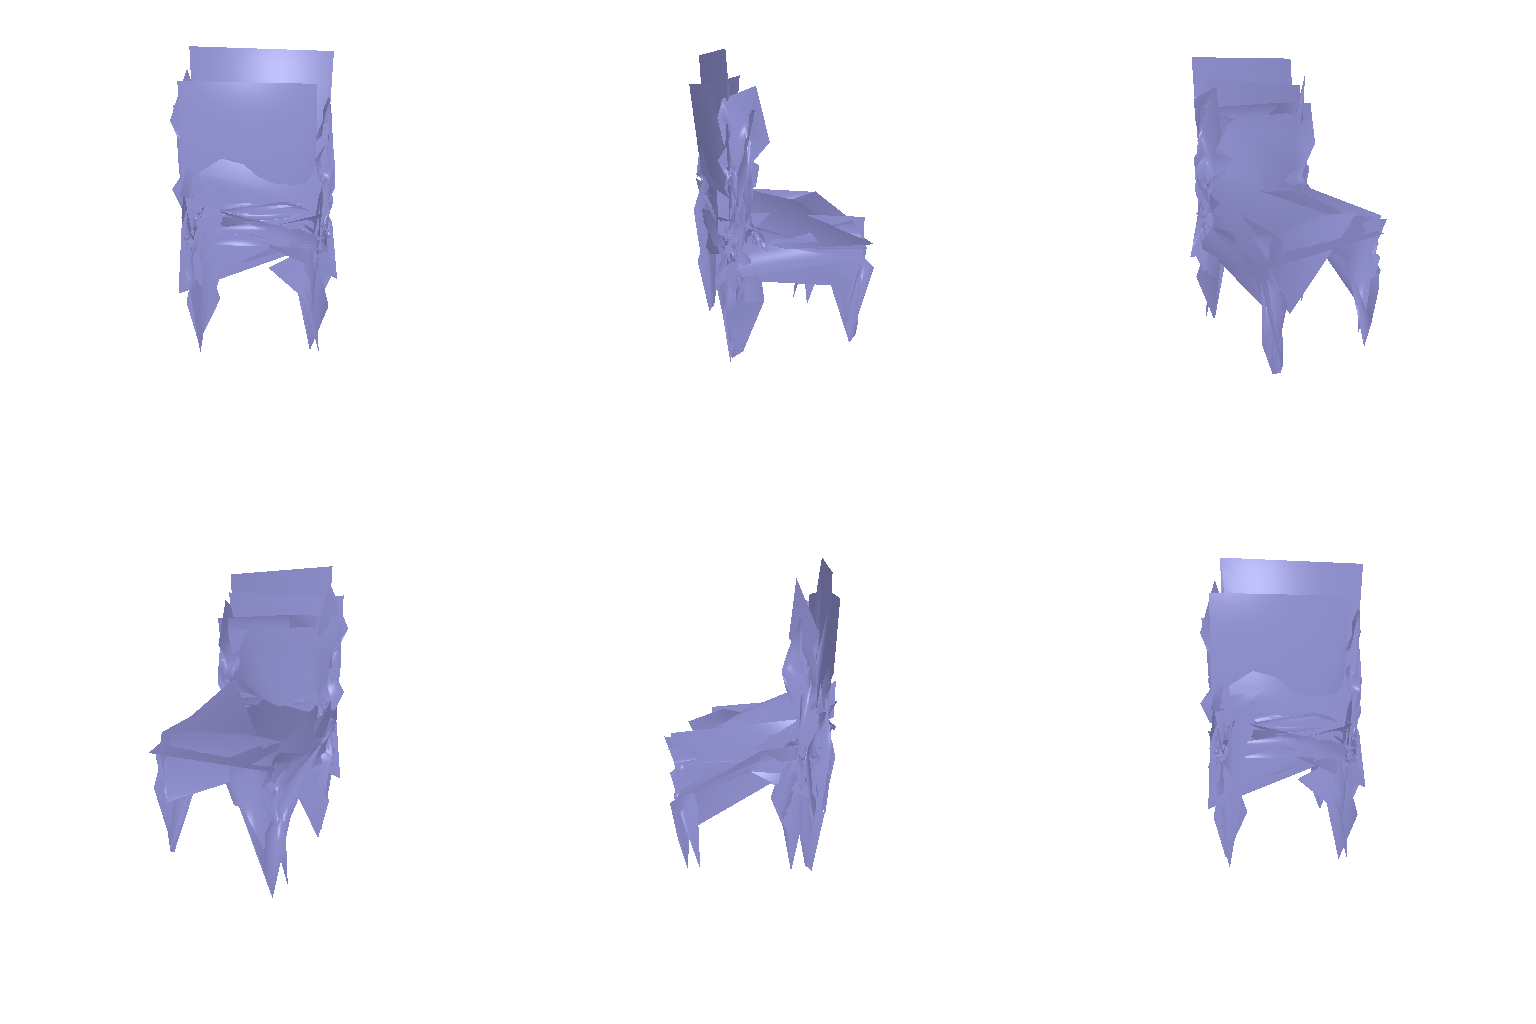
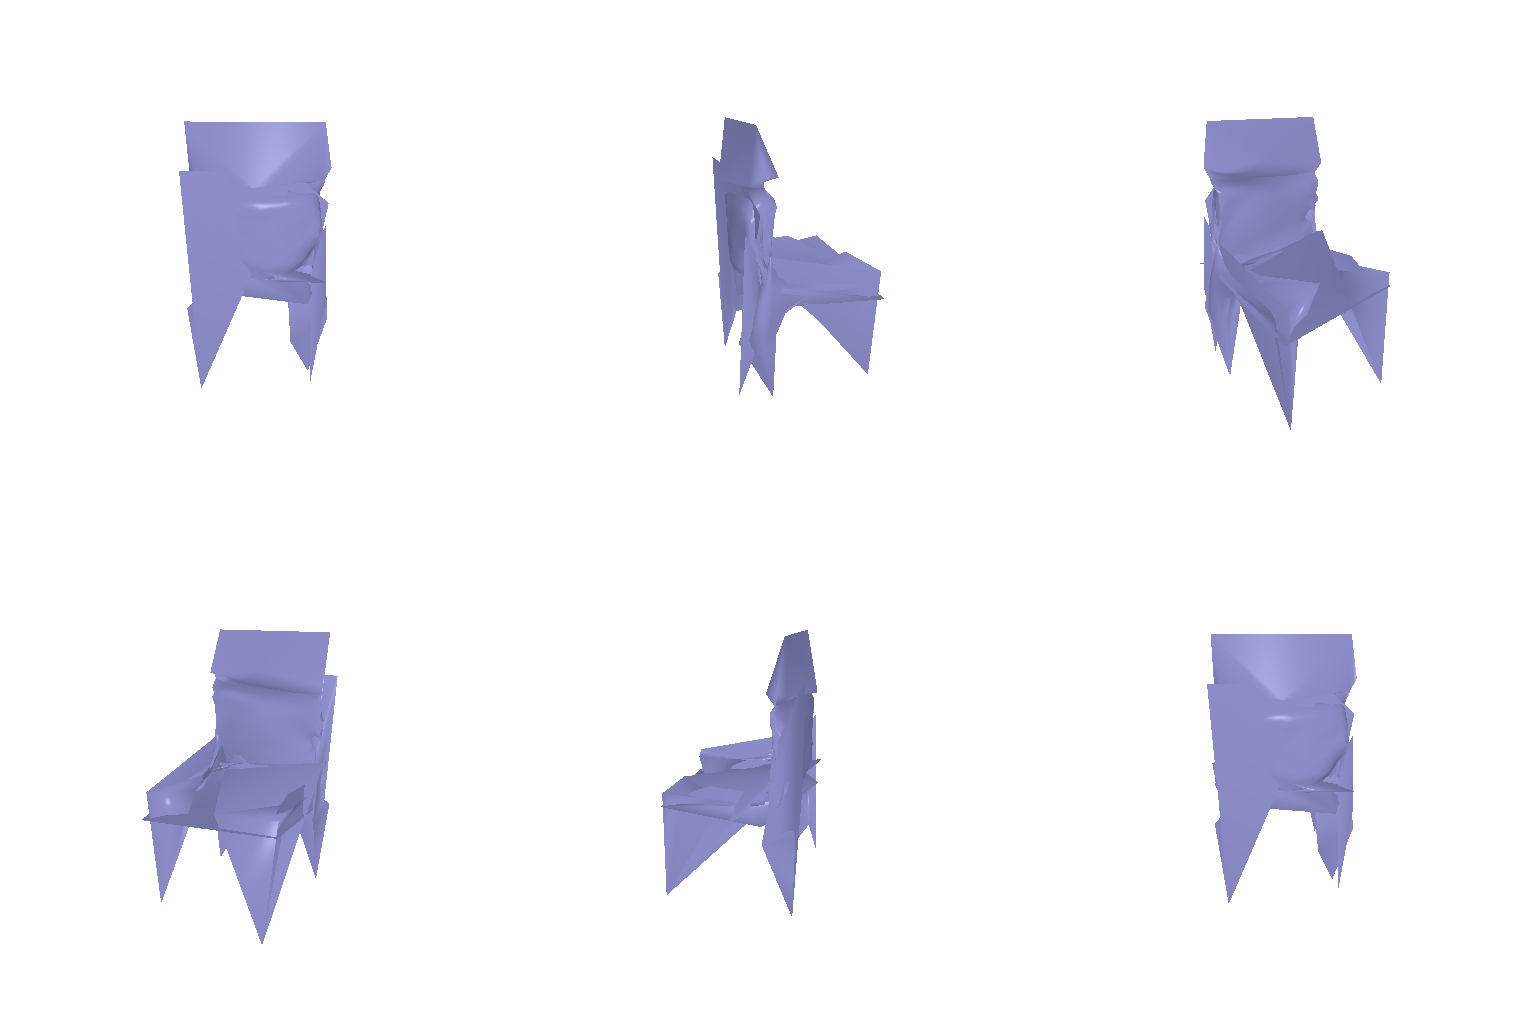
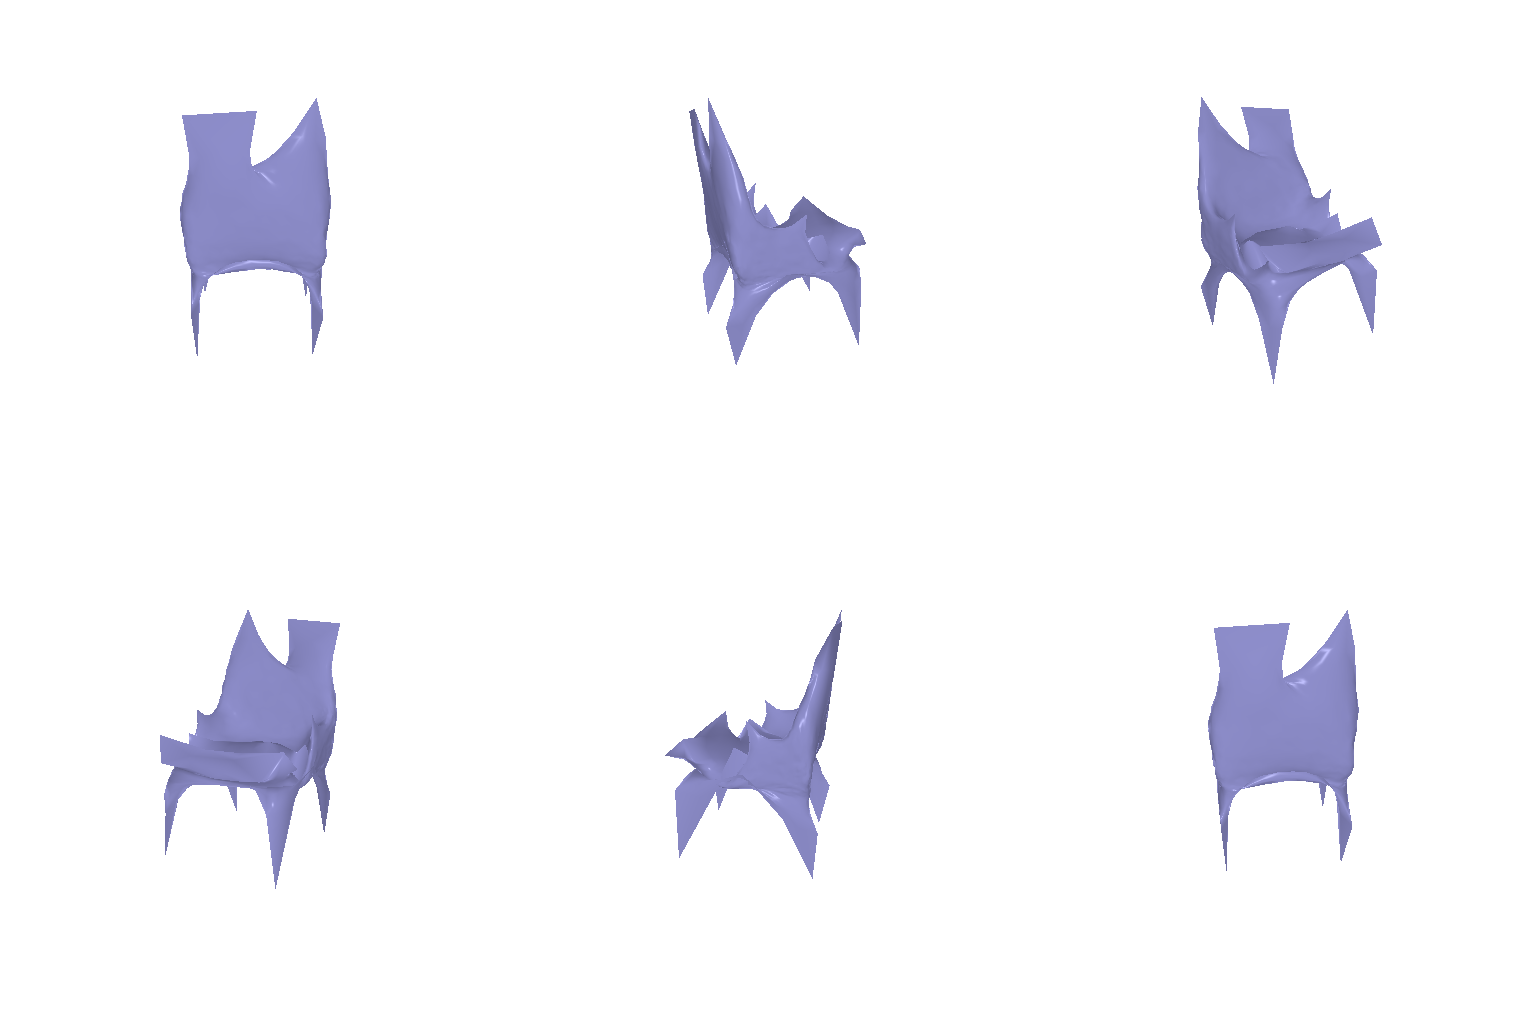
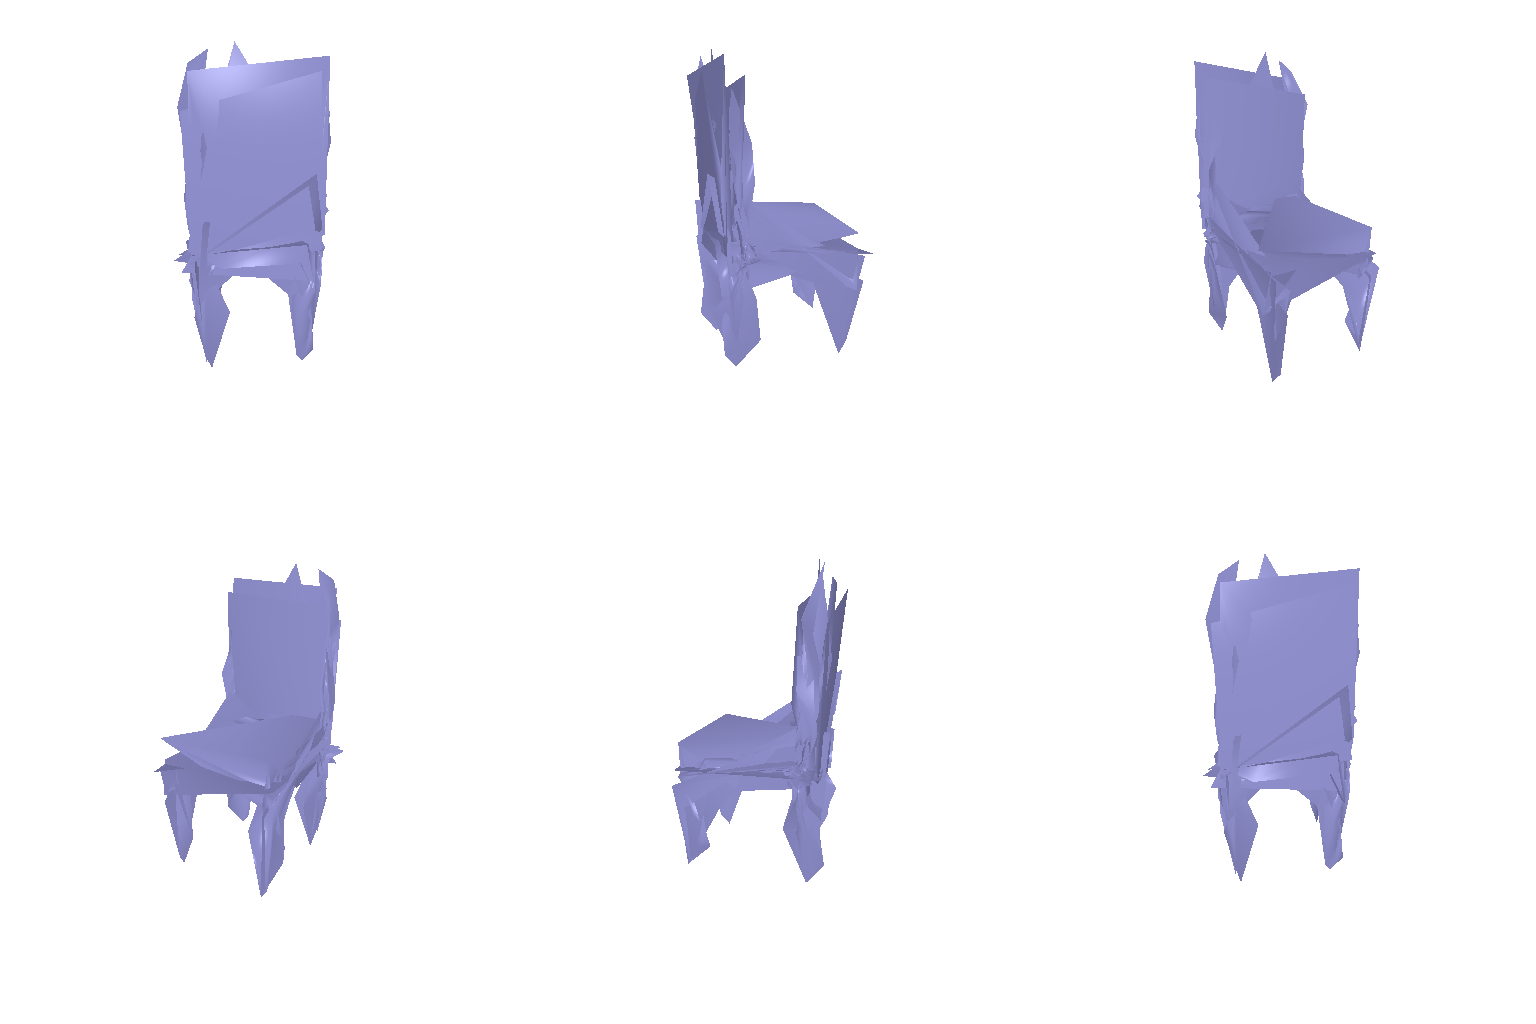
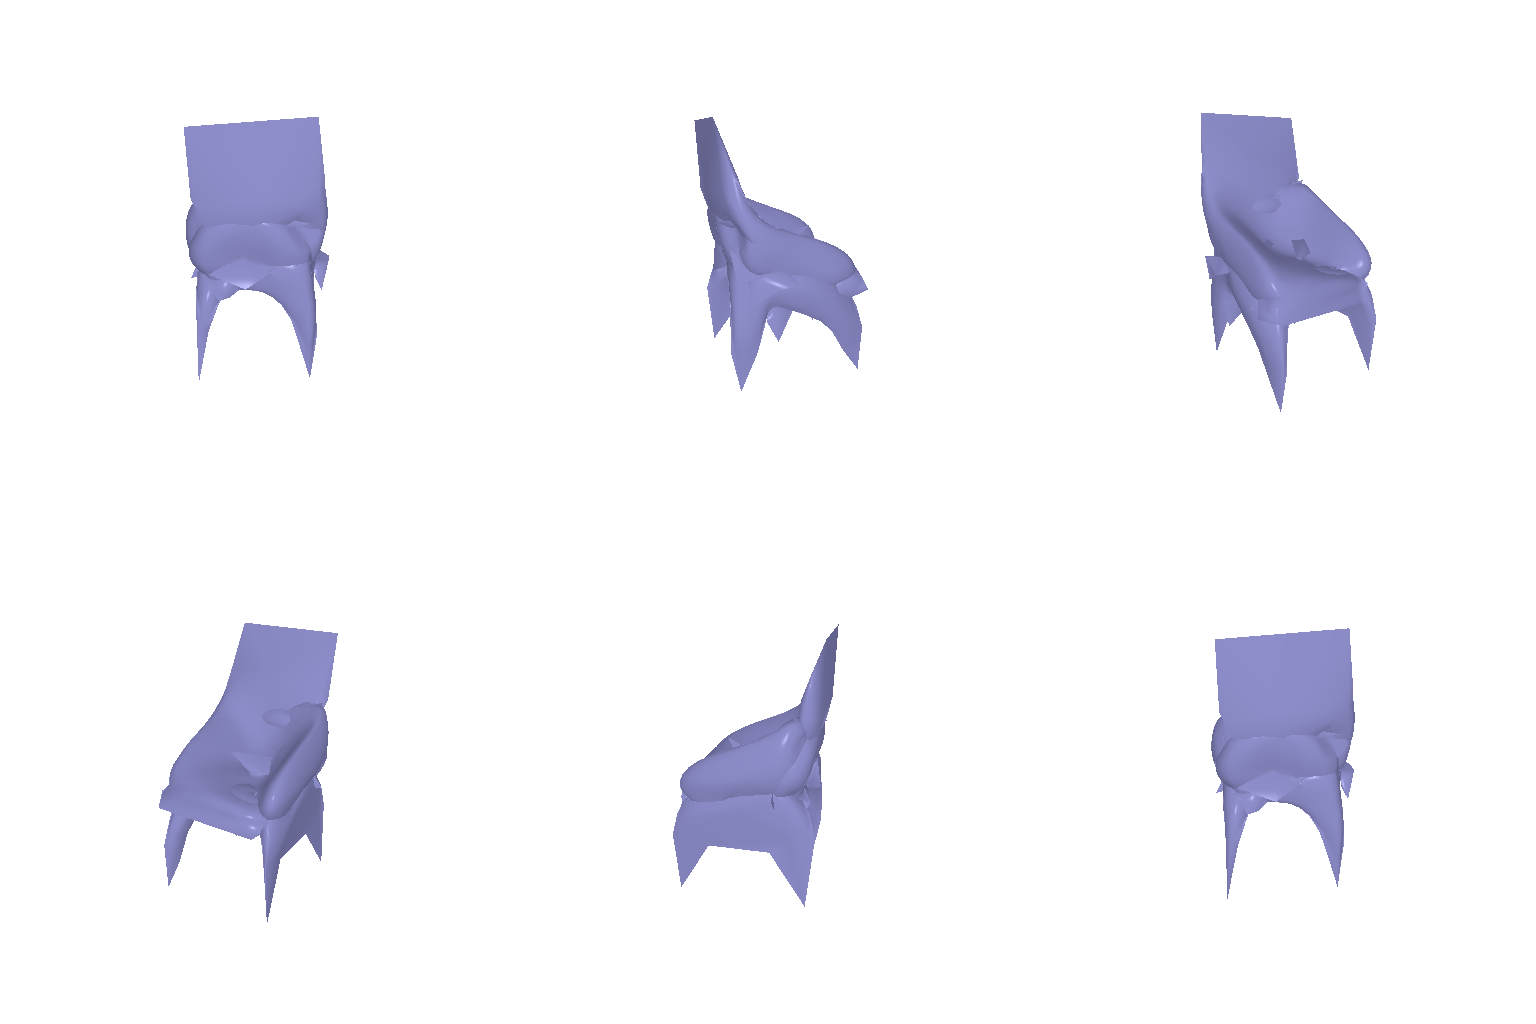
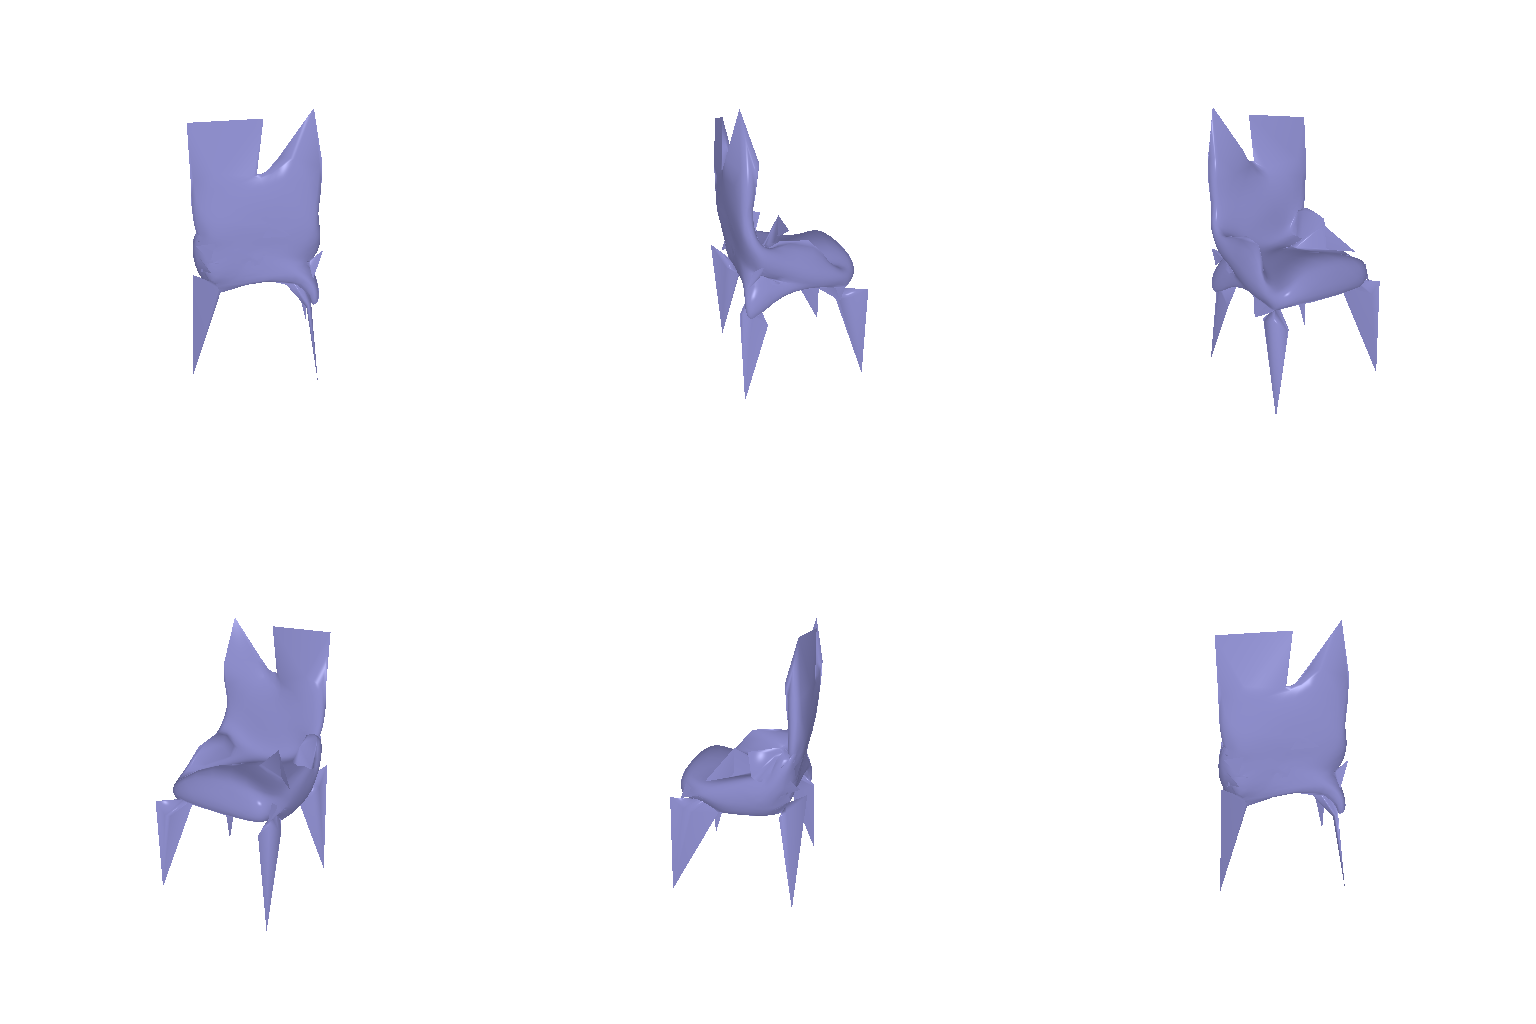
Validation numbers are in the 2.3 table.
- More Laplacian smoothing costs F1@0.05 and does not fix the surface. Raising
w_smoothfrom 0.01 to 1 lowers validation F1@0.05 from 73.1 to 67.2. The surface is smoother but still folds, and the legs shrink into narrow cones. - A smaller initial sphere helps on validation, but not reliably. Radius 0.5 (B) raises validation F1@0.05 from 73.1 to 75.0, mostly through precision (70.3 to 73.0), but scores 73.8 on test against 74.9 for radius 1.
- Edge and normal regularizers buy a clean surface for about 7 F1@0.05. The folds and self-intersecting sheets disappear, but F1@0.05 drops to about 68, mostly through precision (73.0 to 63.0), likely because the stiffer surface spans concave regions instead of pulling into them. Starting from an ellipsoid (D) instead of a sphere scores the same (67.8 vs. 67.9), so with these regularizers the initial shape barely matters.
Per-chair F1@0.05 is noisy: w_smooth 0.1 scores 40.4 on test[400] but 72.3 on average. Every choice above uses the 300-chair averages.
2.5 Interpreting the point cloud model
Interpolating between two chairs in feature space
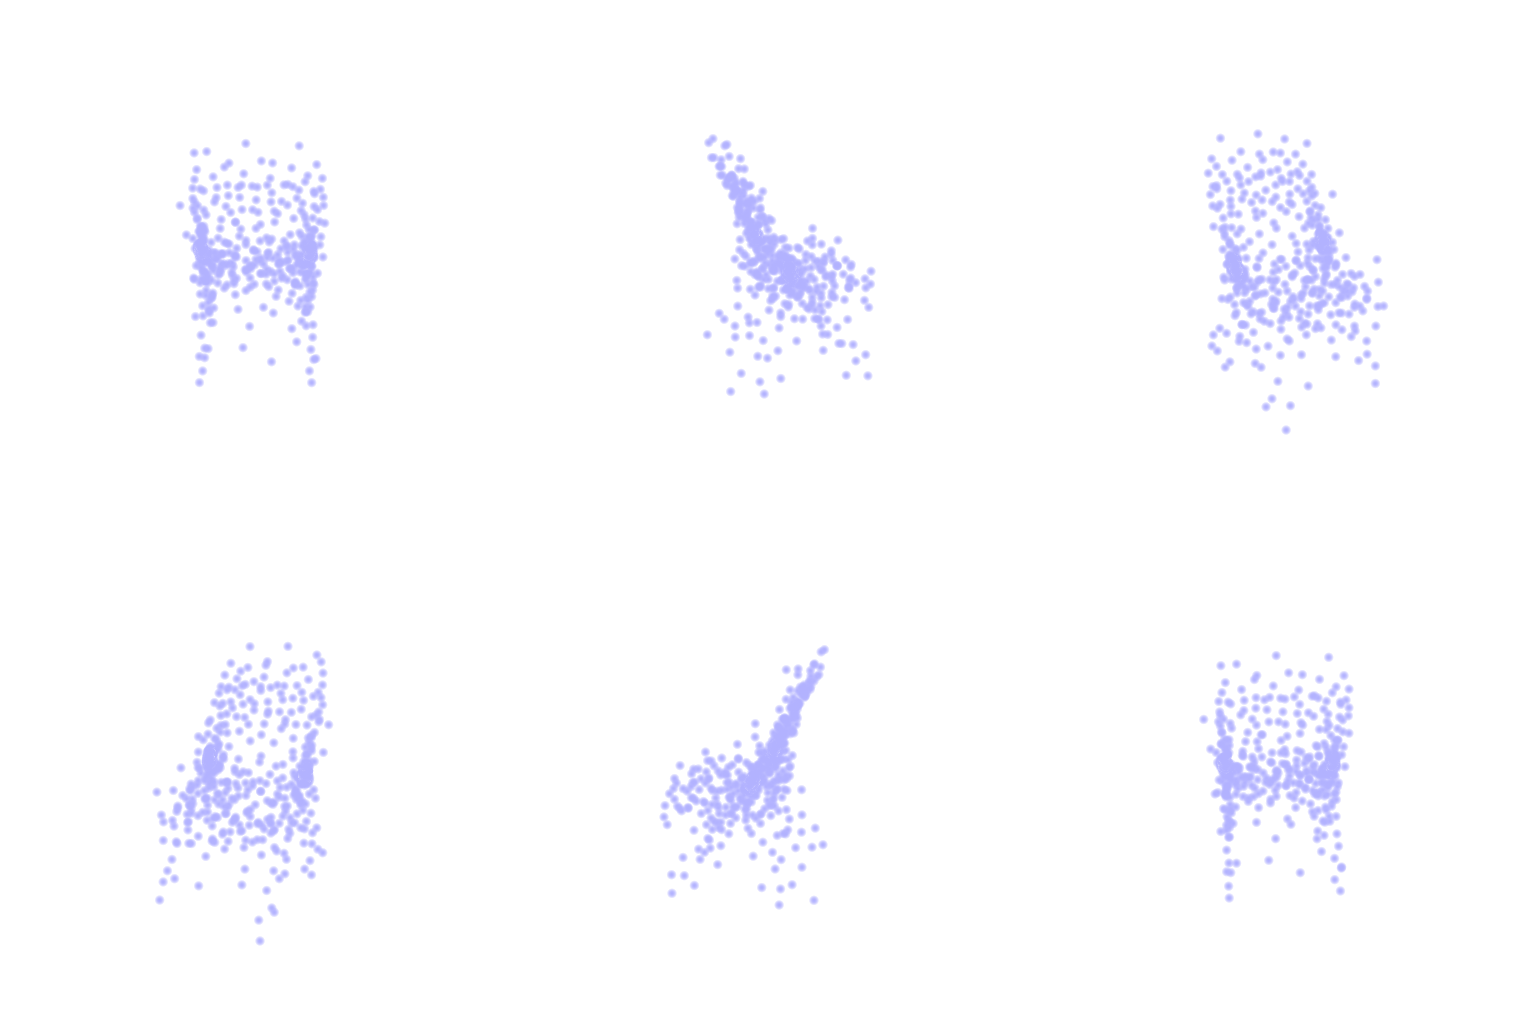
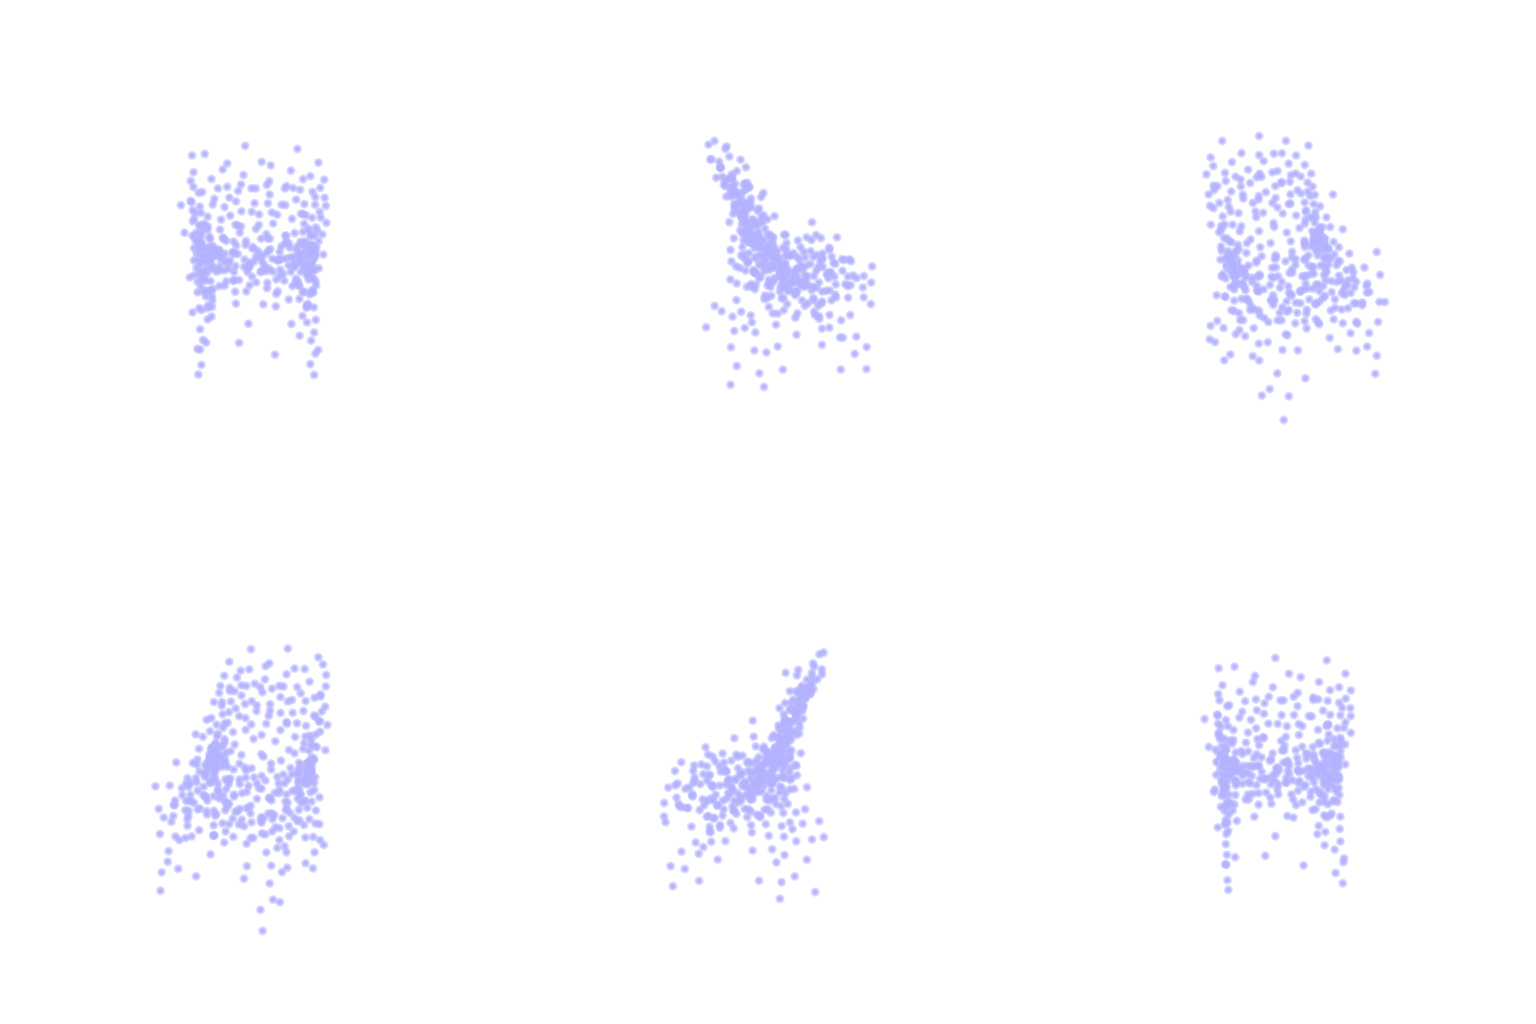
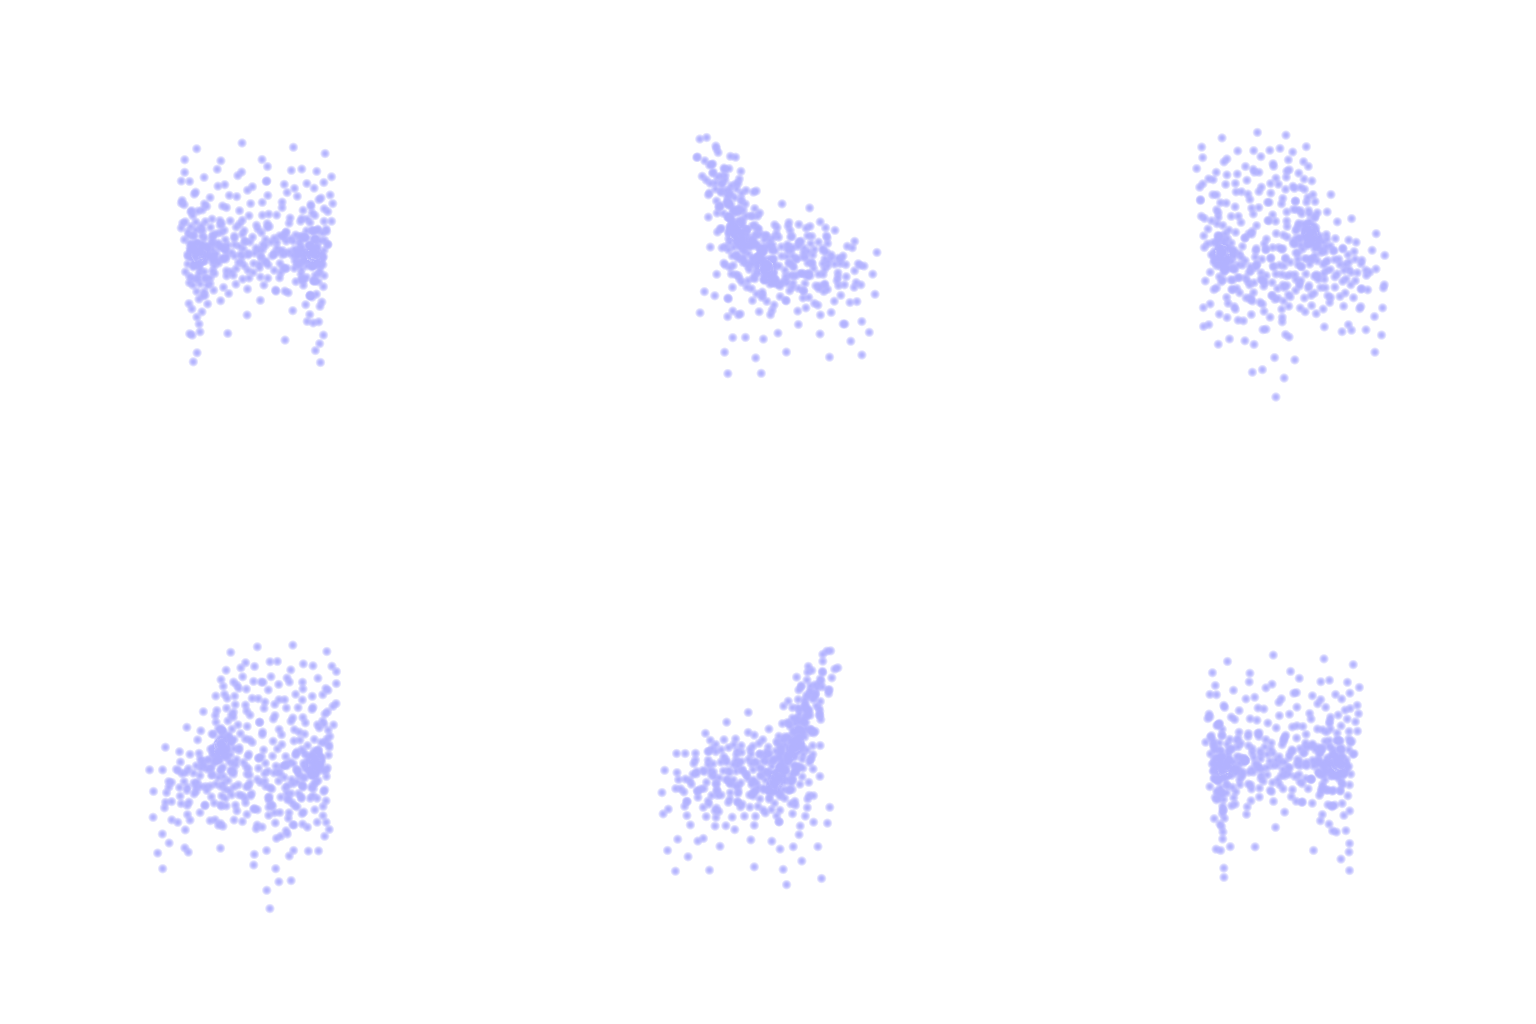
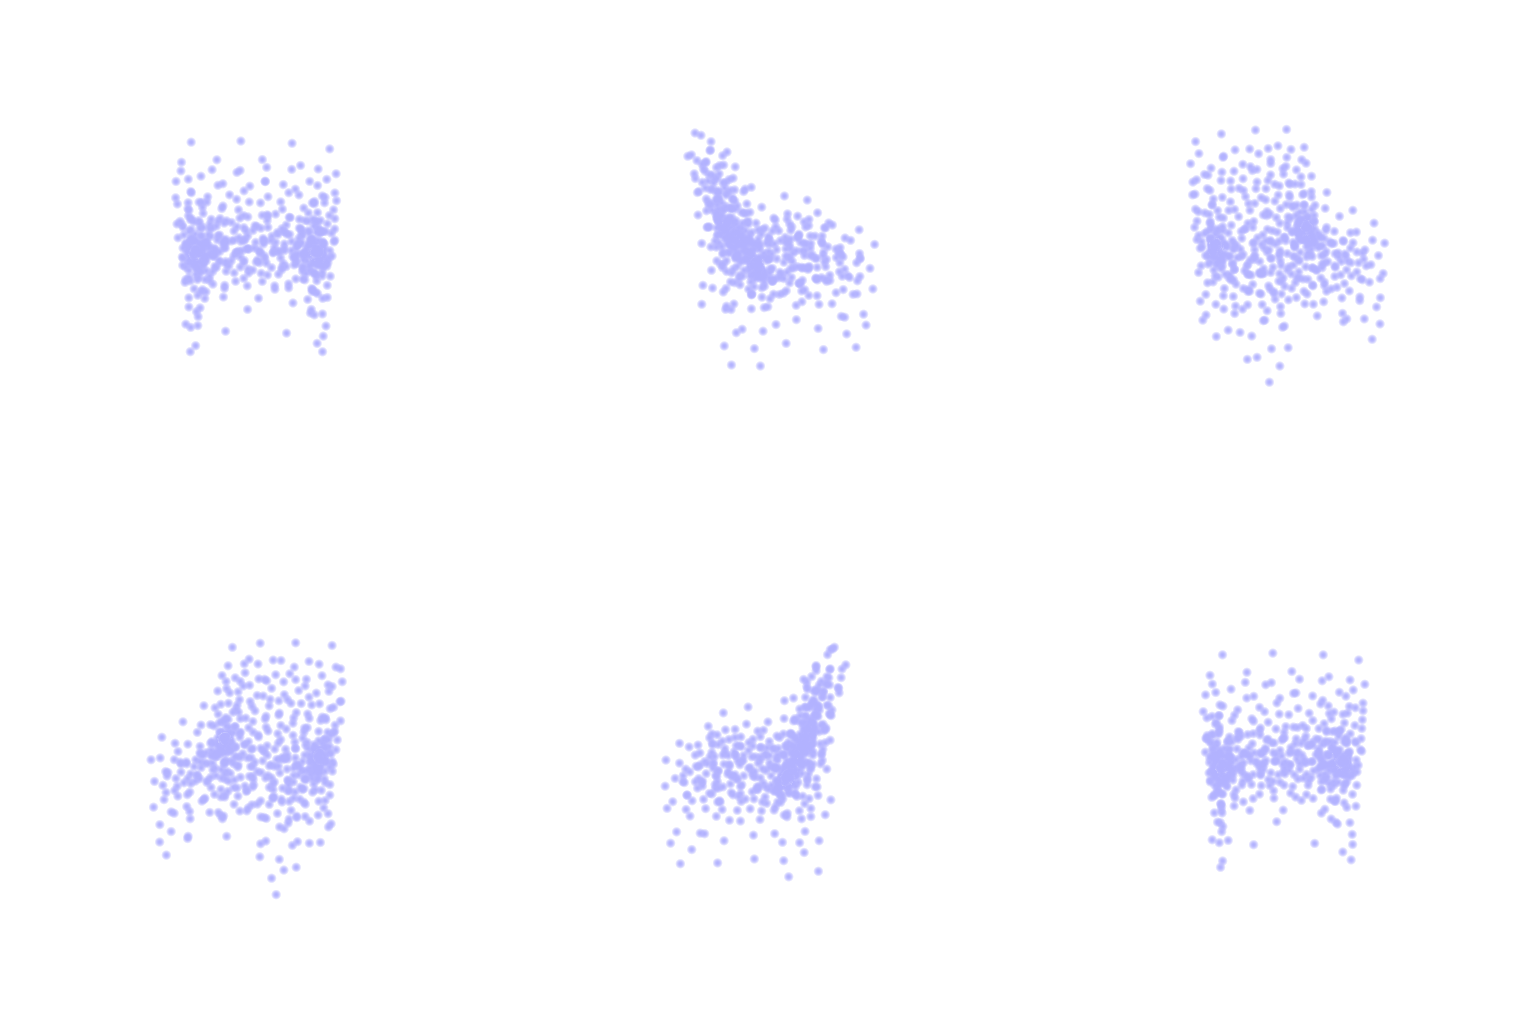
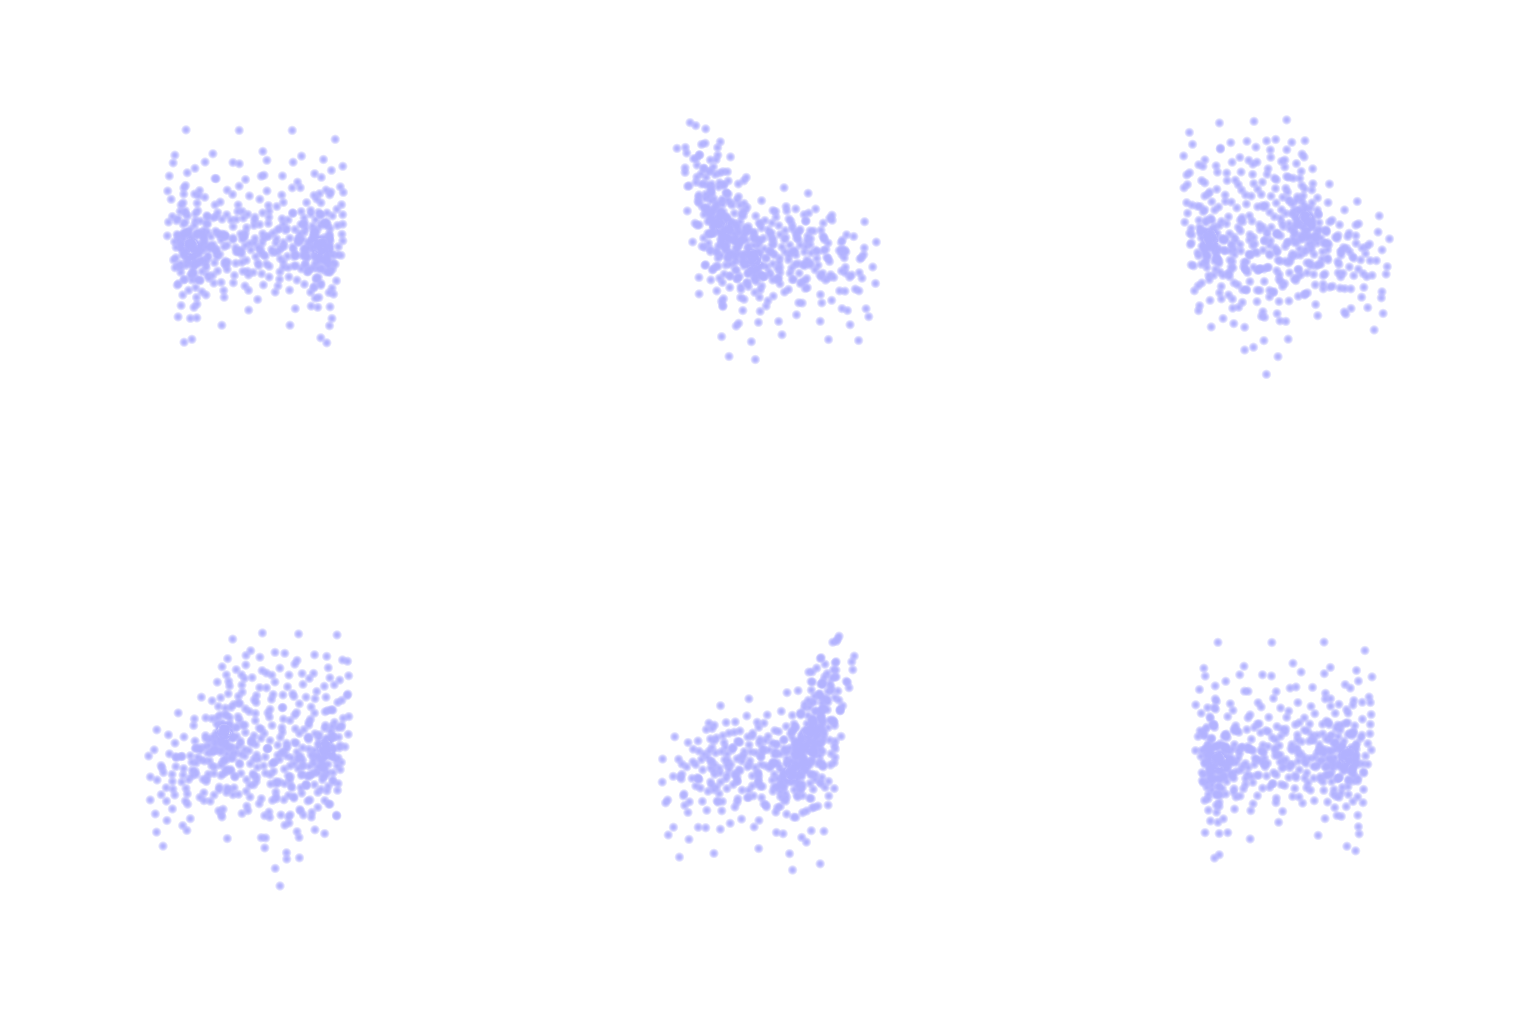
I encoded the folding chair (test[200]) and the armchair (test[0]), mixed the two 512-d features linearly in 7 steps, and decoded each mix. The thin, tilted folding chair thickens and straightens step by step into the armchair's box, with no jump between two memorized shapes: the decoder has learned a continuous map from features to plausible chairs.
The feature encodes the object, not the view
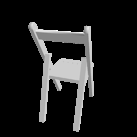
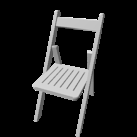
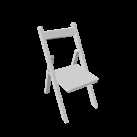

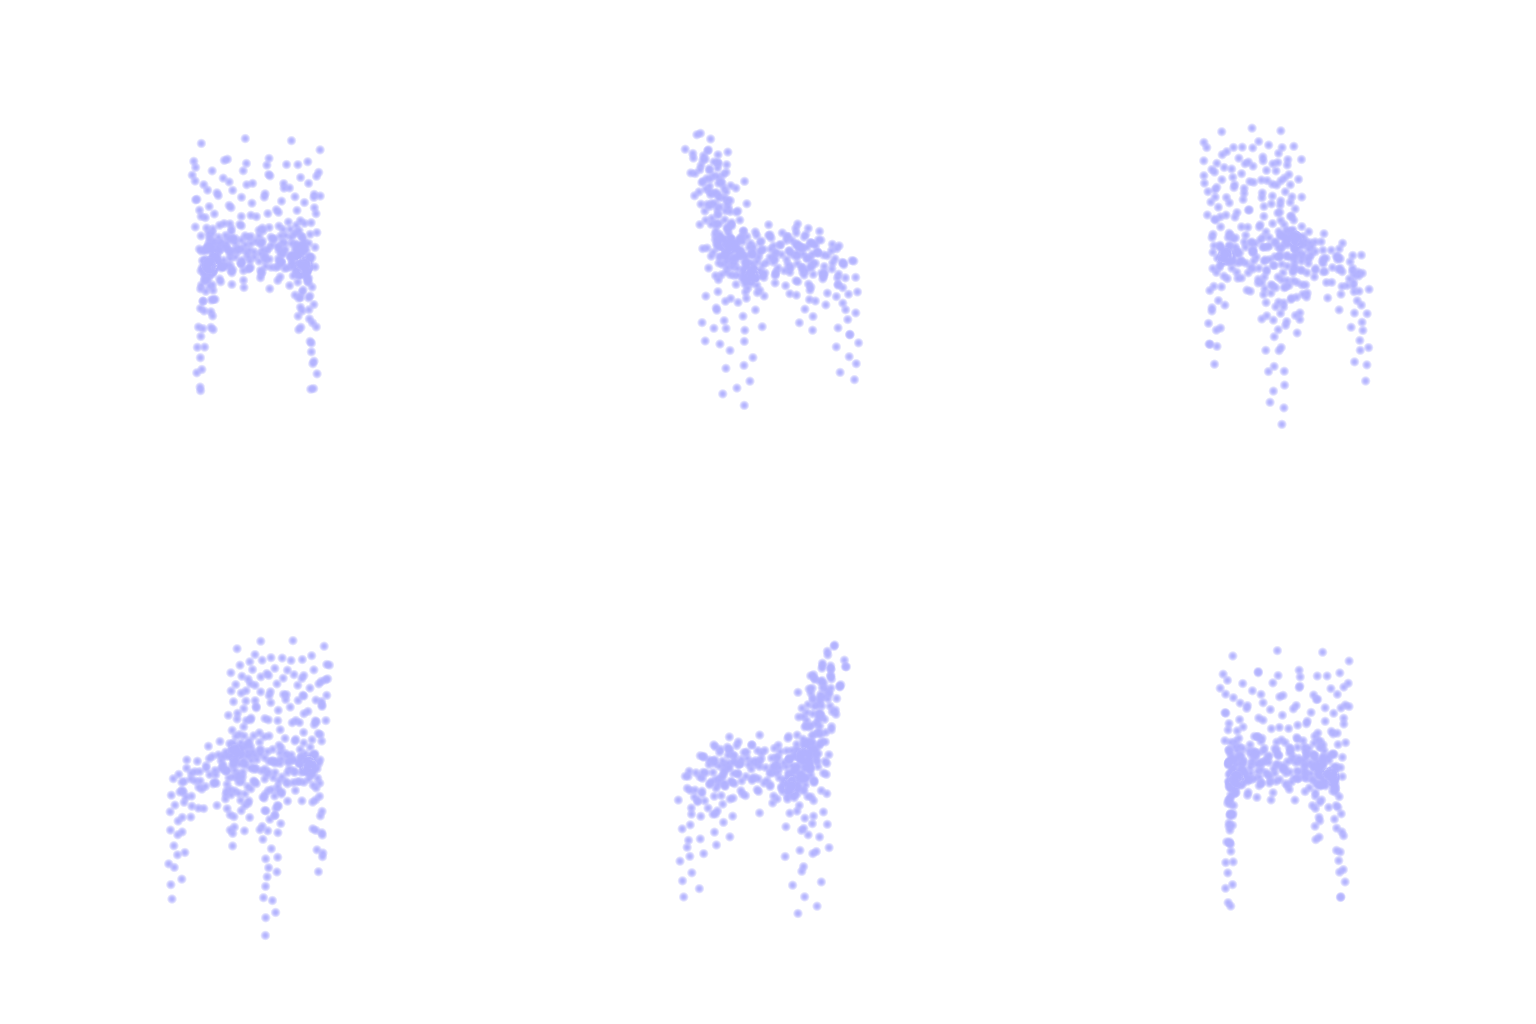
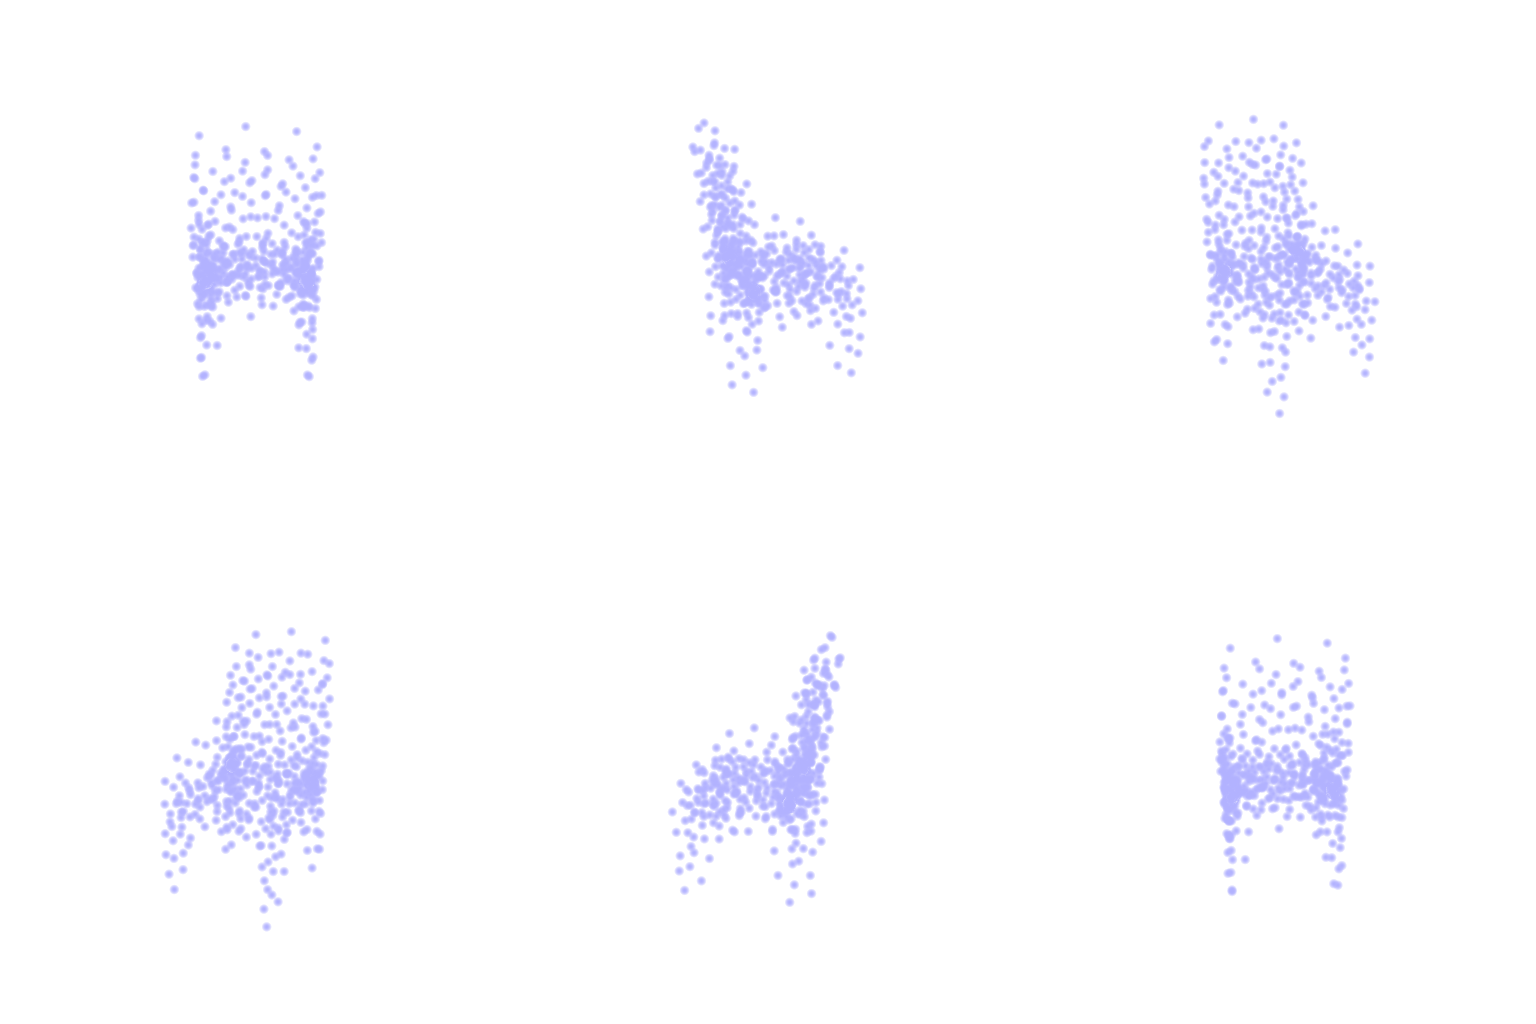
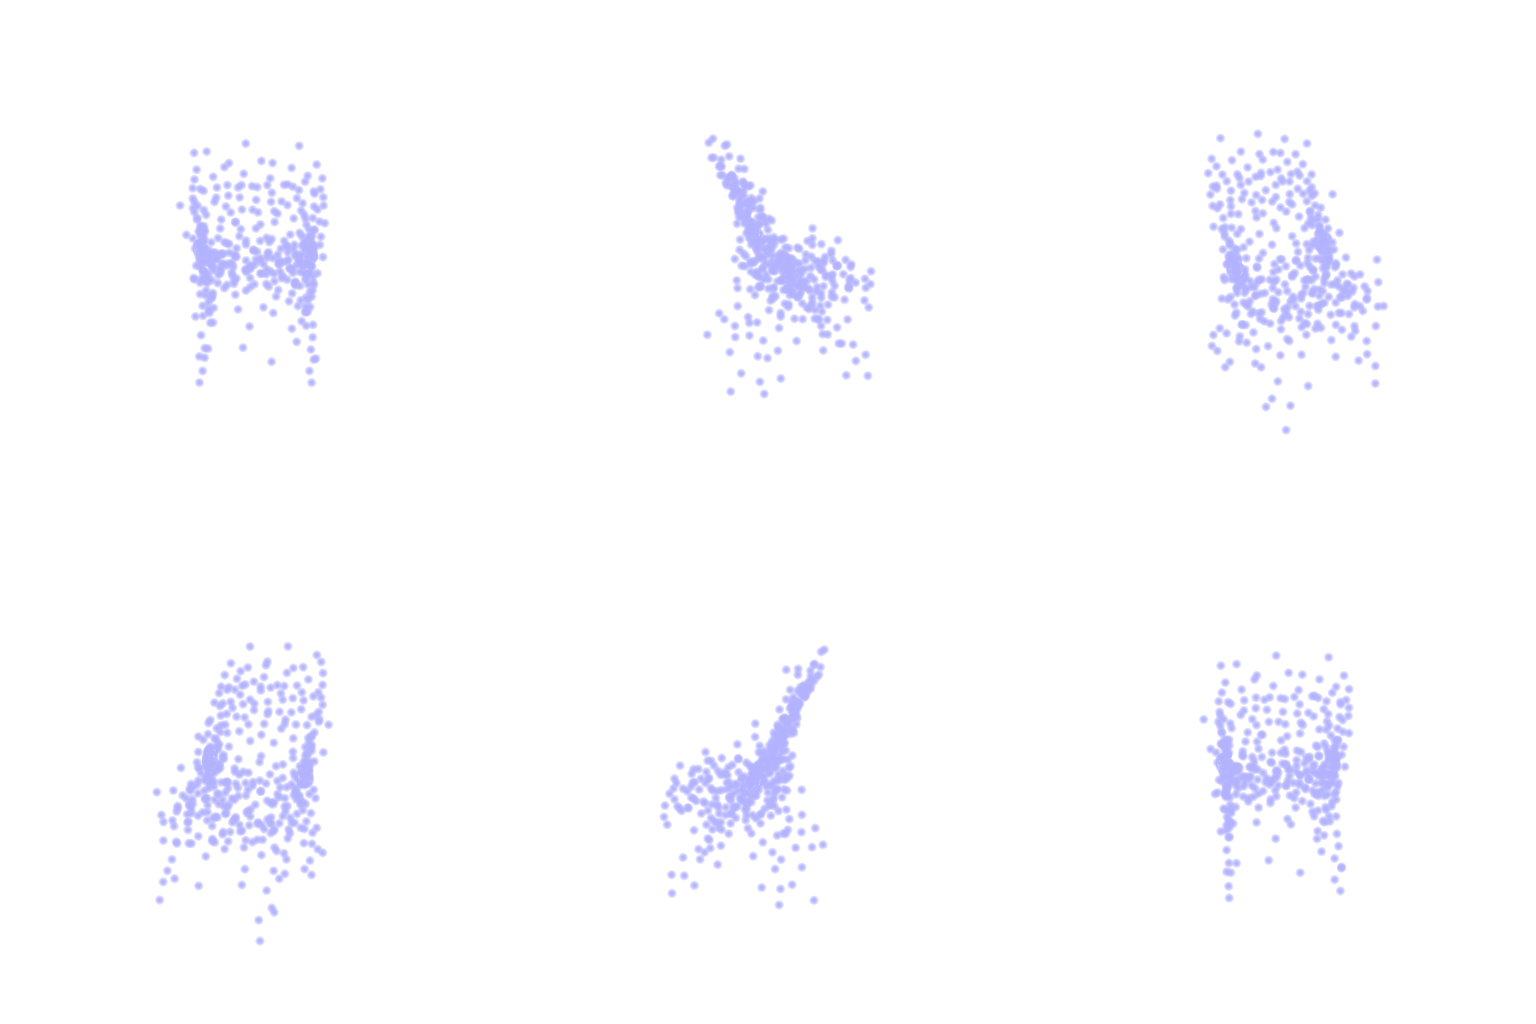
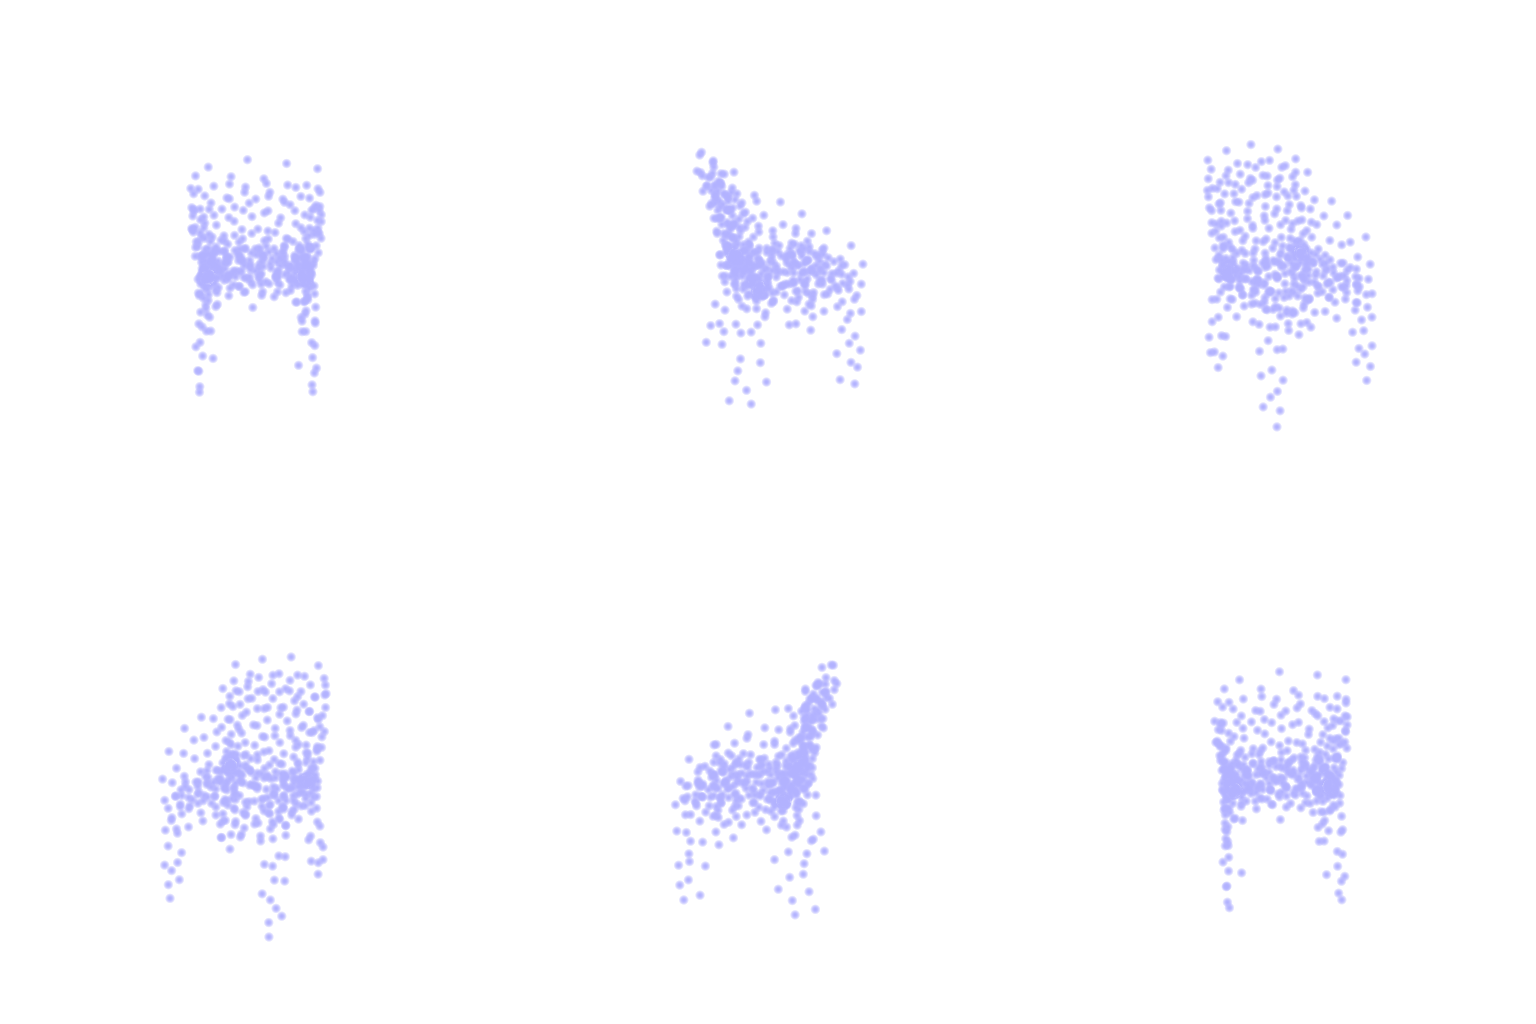
All four views of the folding chair give the same tilted chair. To measure this, I predicted
50 test chairs (every 13th) from the same four views and averaged chamfer_loss over
pairs:
| Pair | Mean chamfer |
|---|---|
| Same chair, different views (predictions) | 0.0014 |
| Different chairs, same view (predictions) | 0.0044 |
| Different chairs (ground truth) | 0.0201 |
- Changing the view moves a prediction 3.3× less than changing the chair, so the feature mostly encodes the object, not the camera.
- Predictions of different chairs are 4.5× closer to each other than the real chairs are. The model pulls every chair toward an average chair, which is why unusual ones, like the armchair, come out as vague versions of themselves.
error analysis
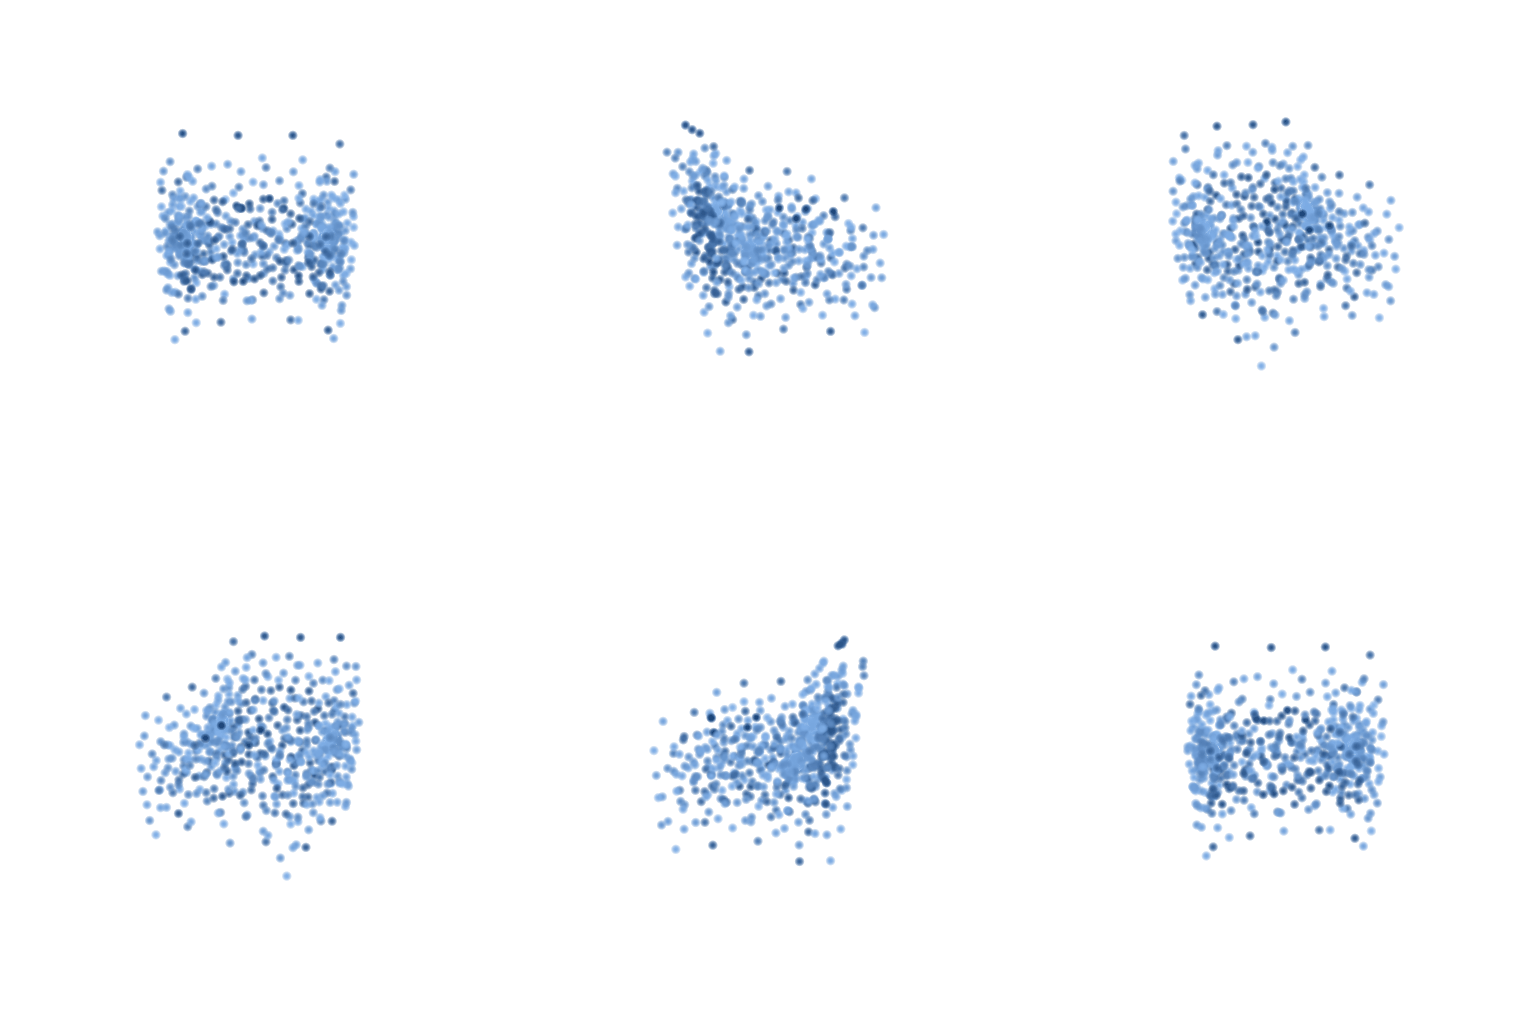
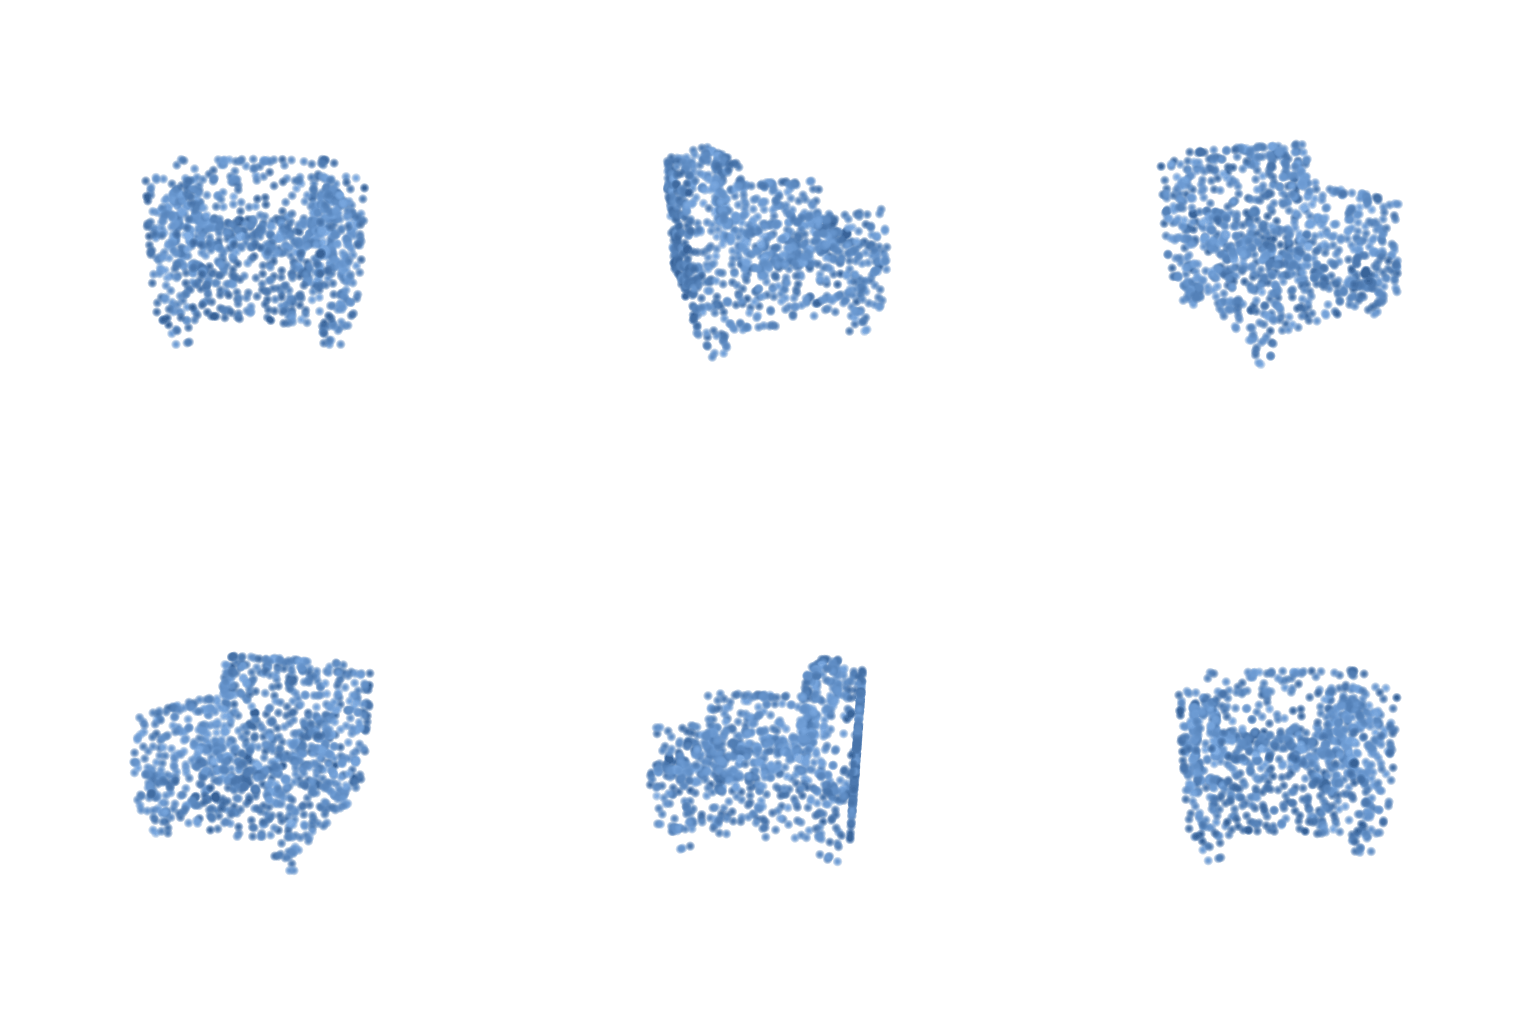
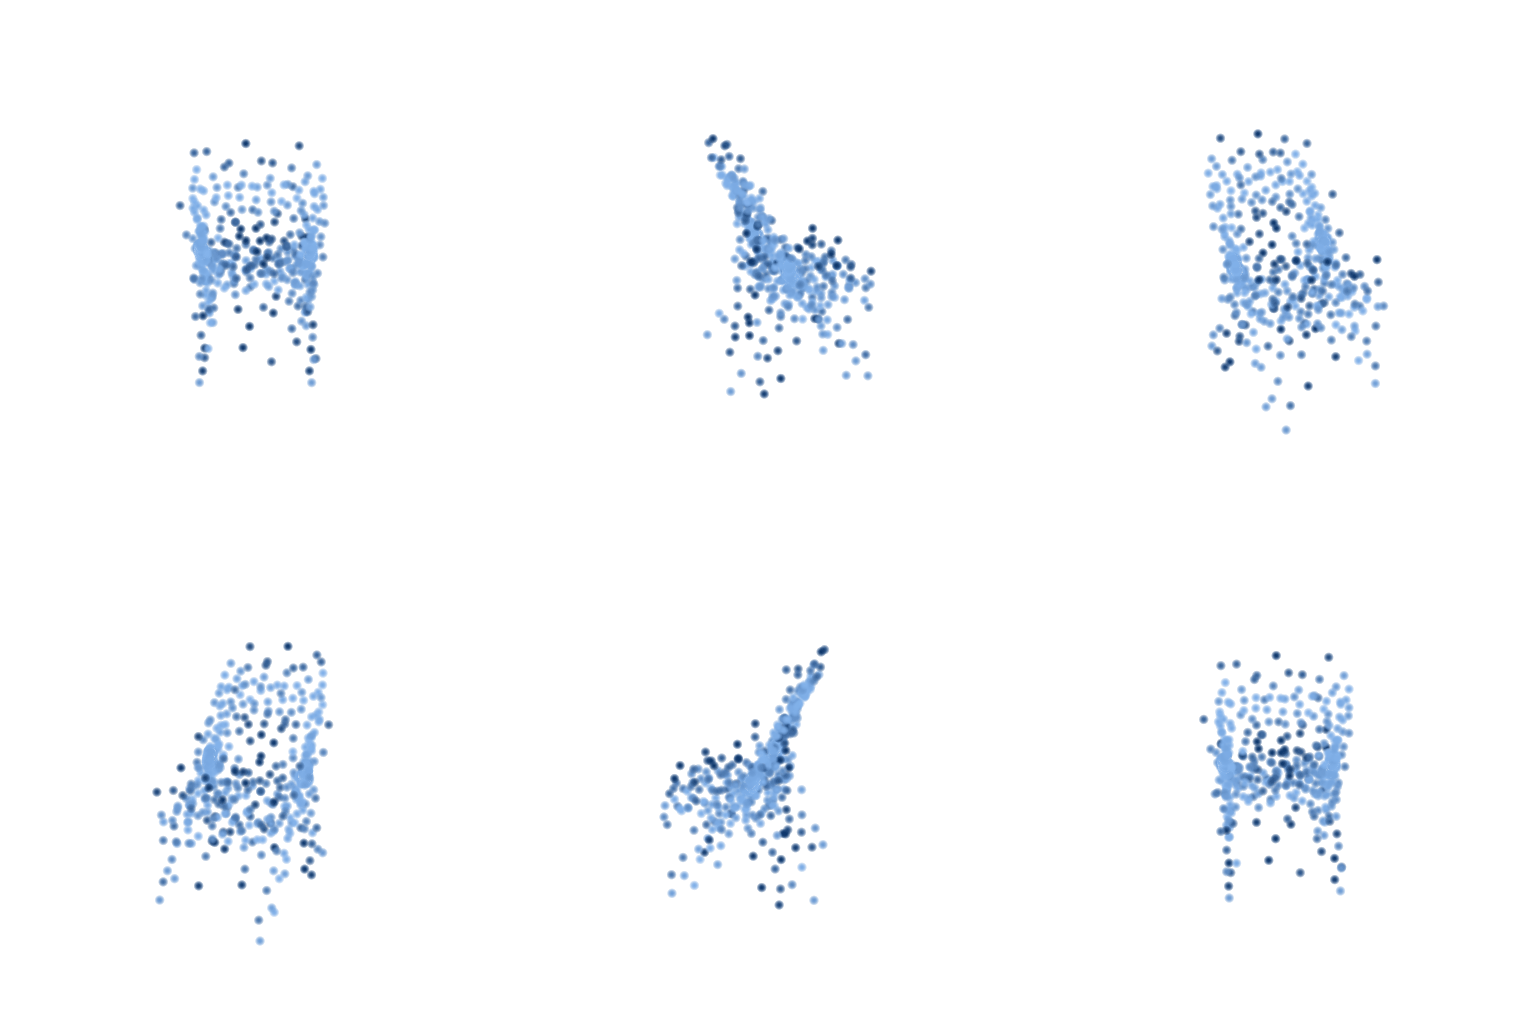
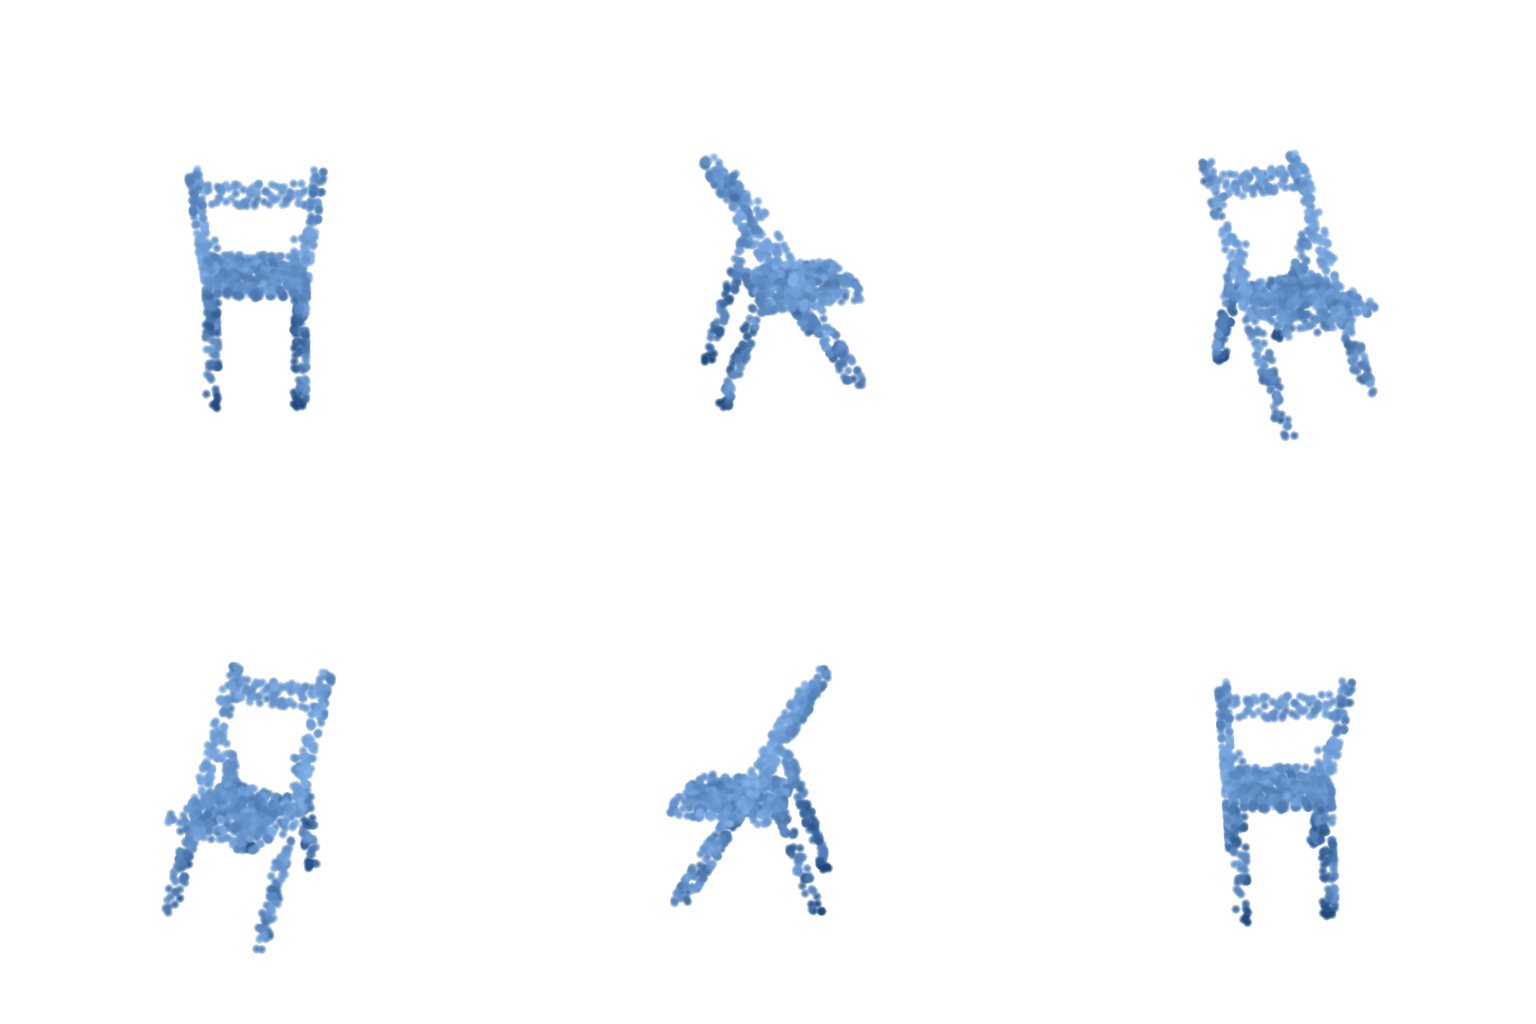
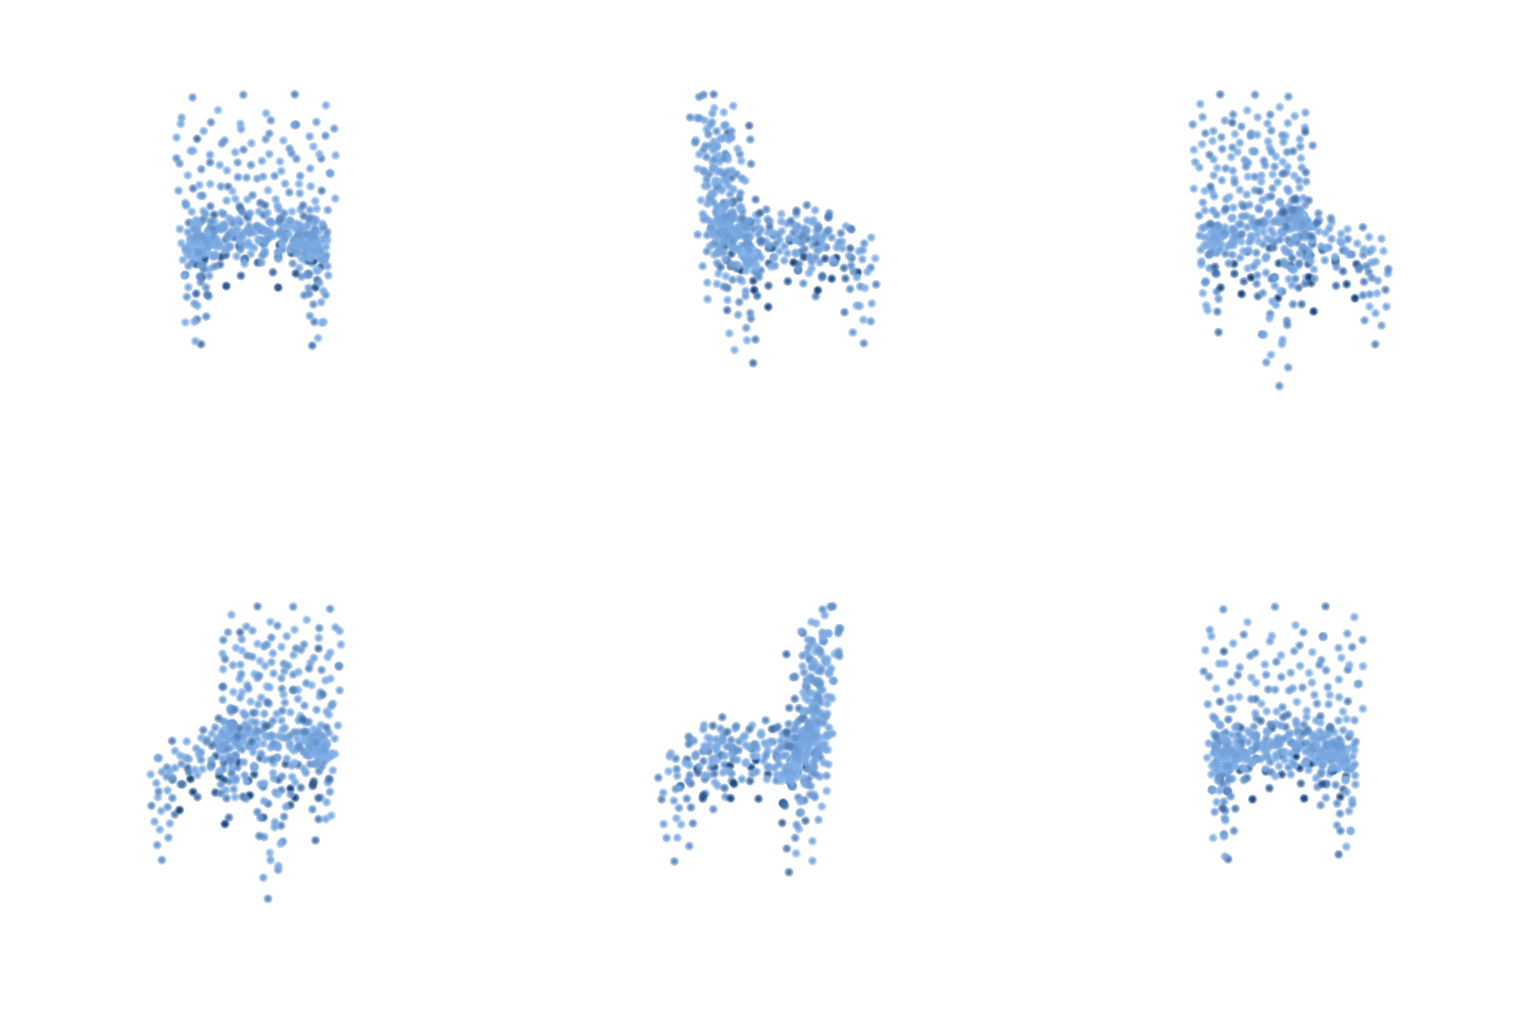
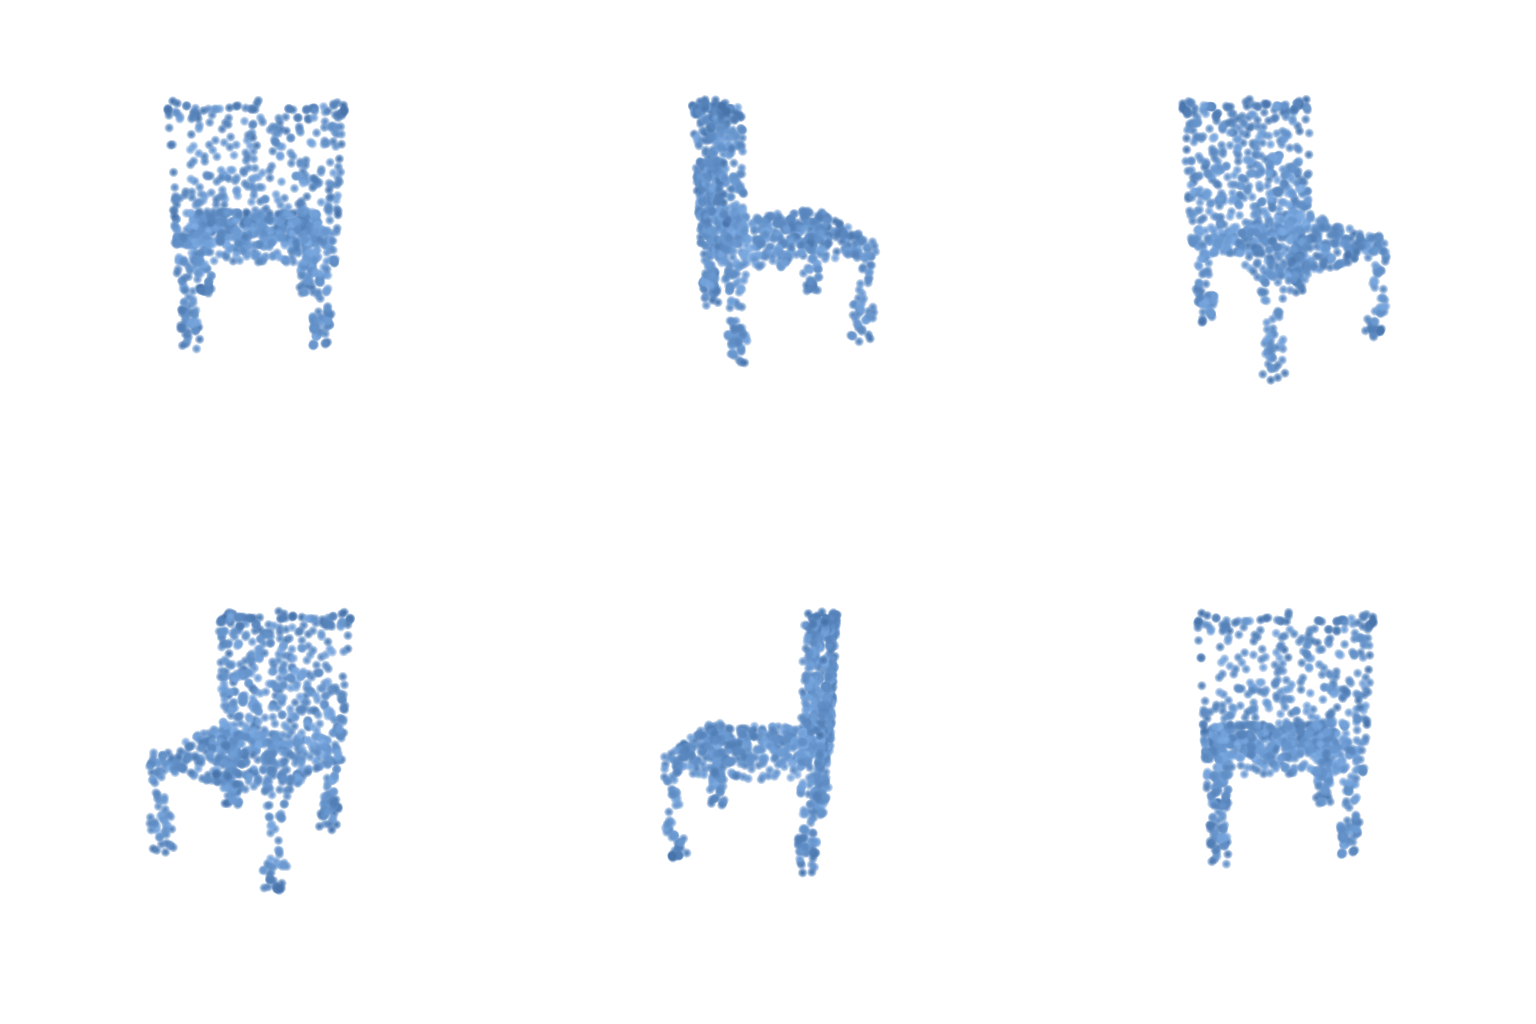

Predicted points are colored by their distance to the ground-truth surface (precision error), and ground-truth points by their distance to the nearest prediction (recall error).
- The darkest predicted points are strays floating off the chair, above the back and below the seat.
- On the ground-truth side, the darkest spots are the folding chair's leg tips, which the prediction does not reach.
- The bulk of each cloud is right; the errors are a thin halo of outliers plus the ends of thin parts.
3. Exploring other architectures
3.1 Implicit network
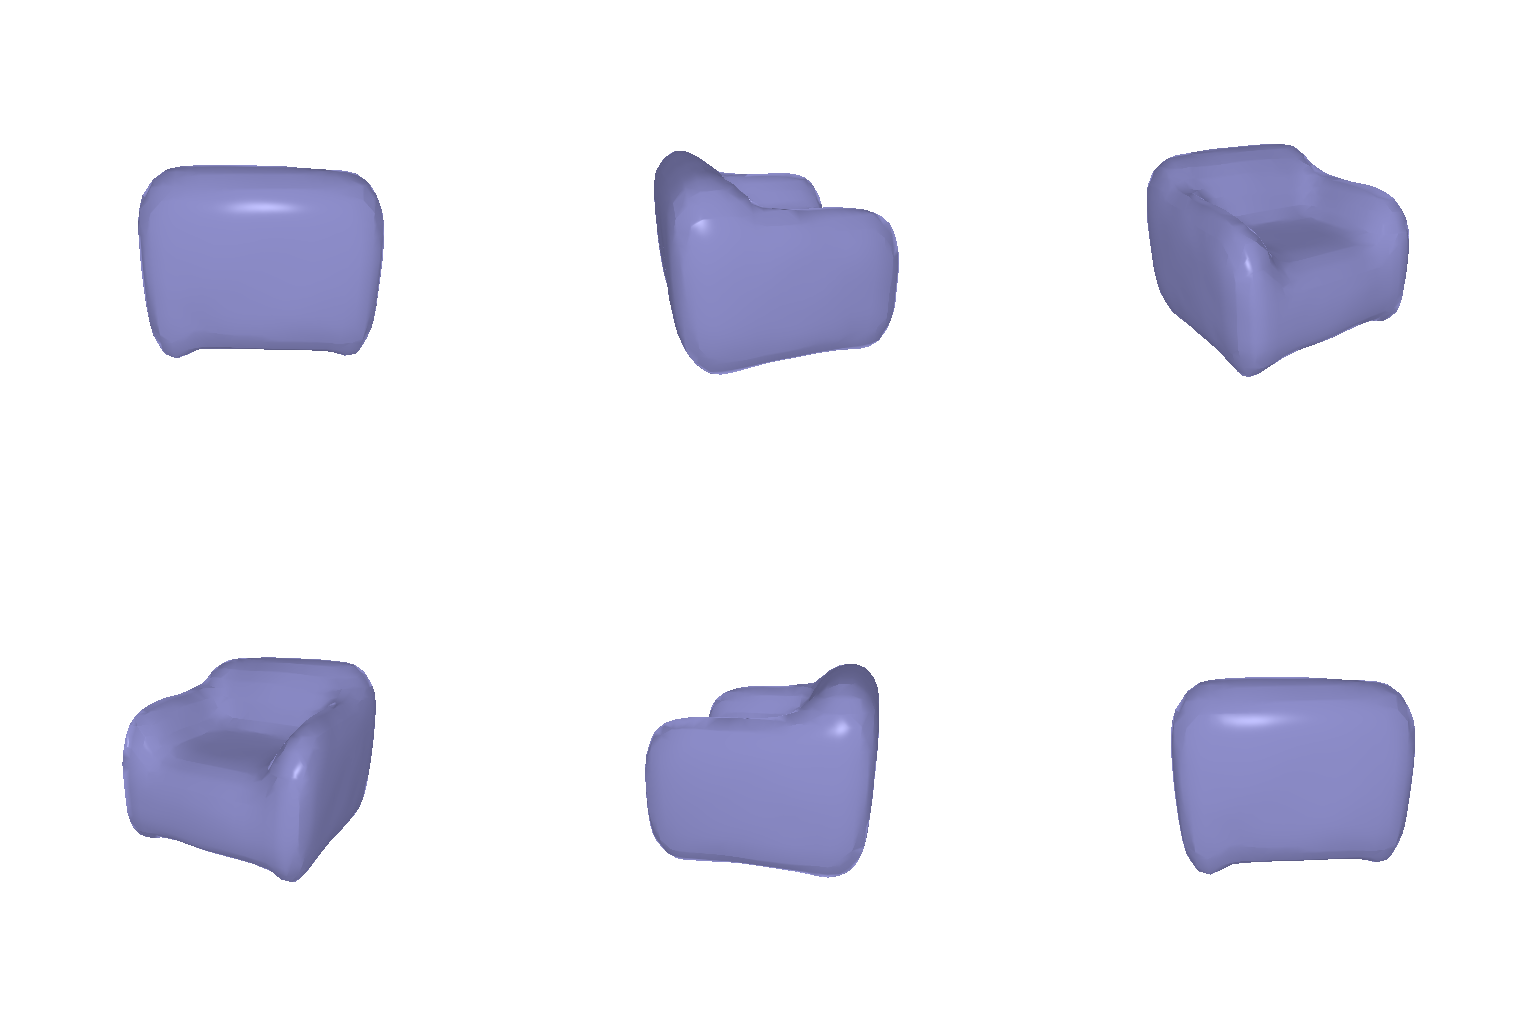
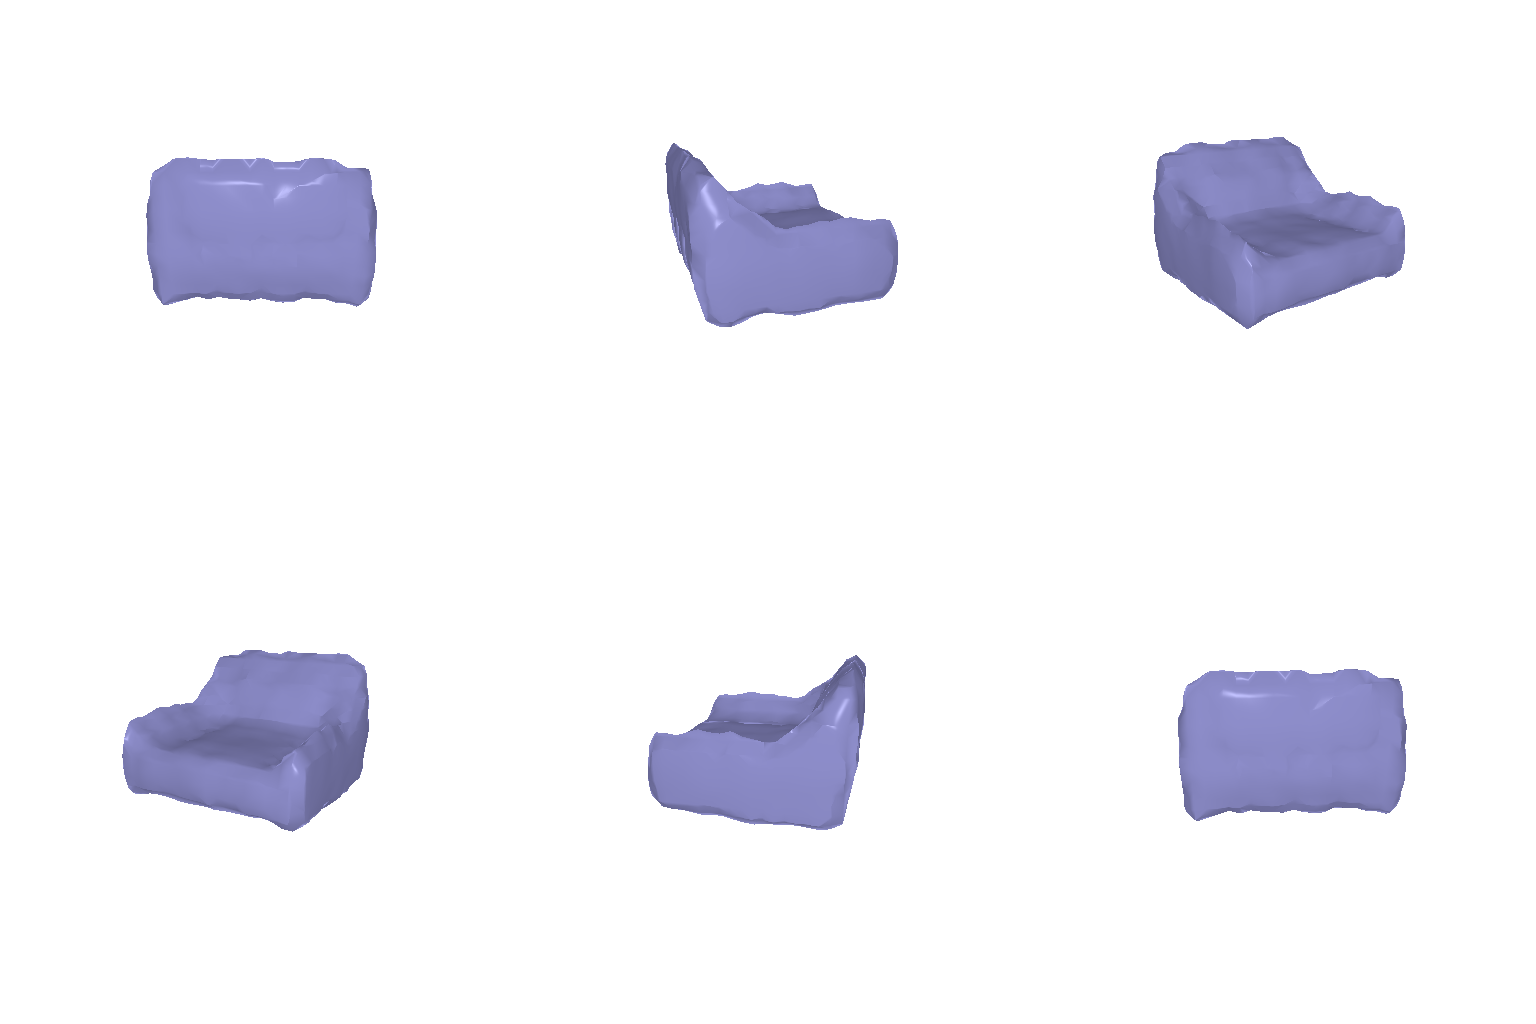
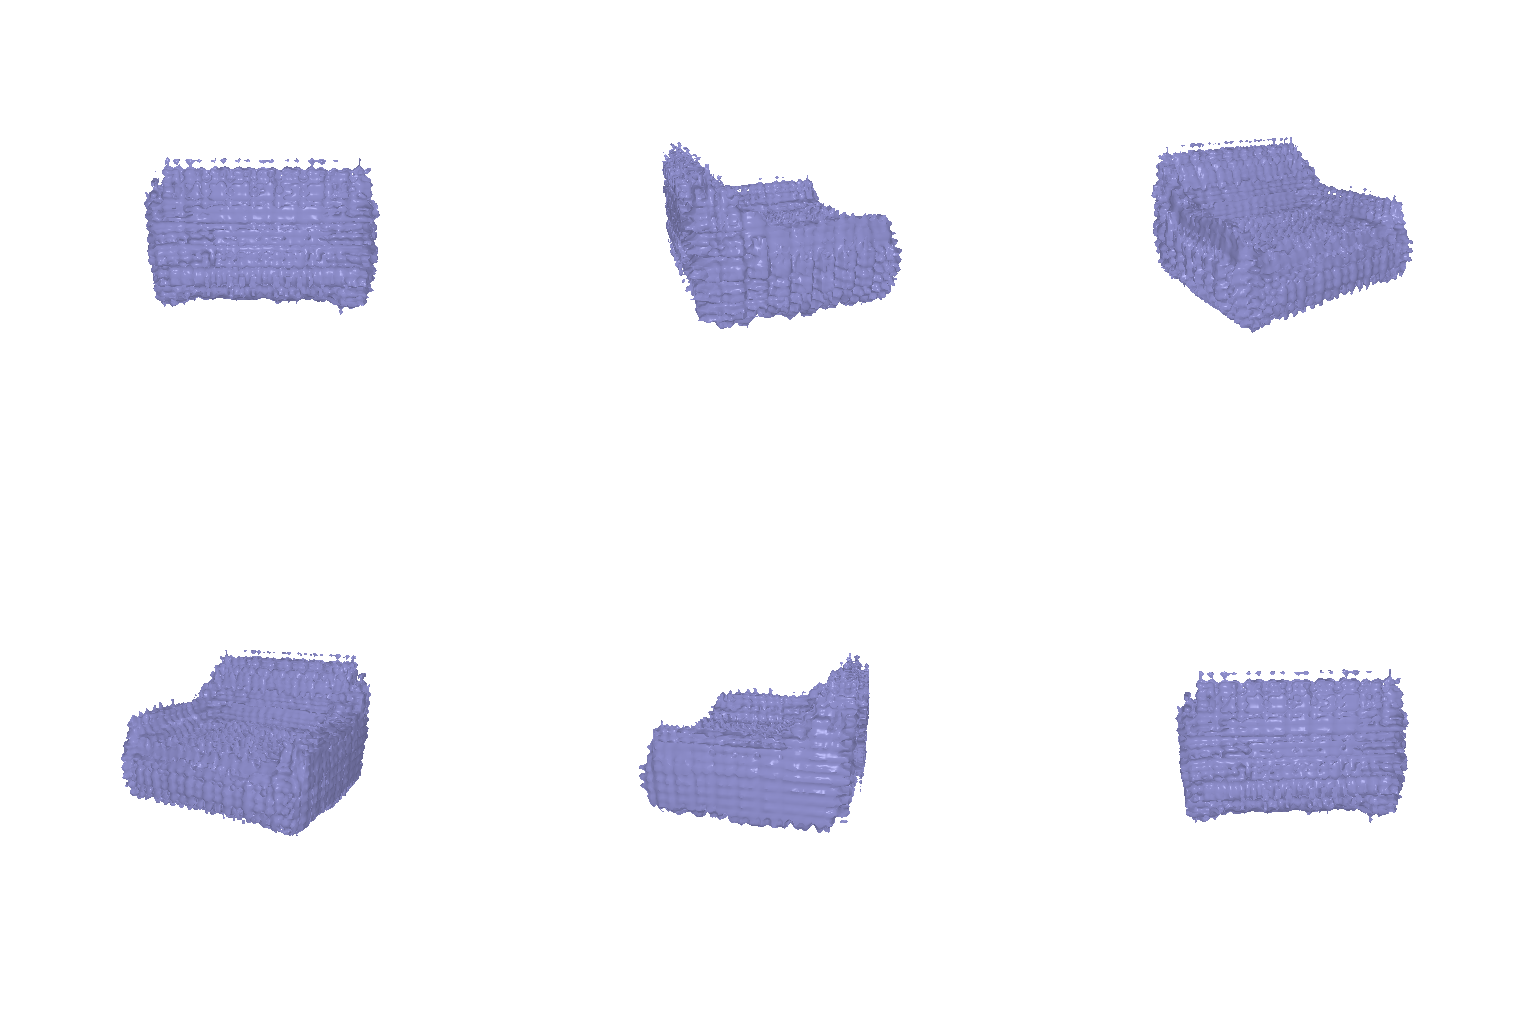
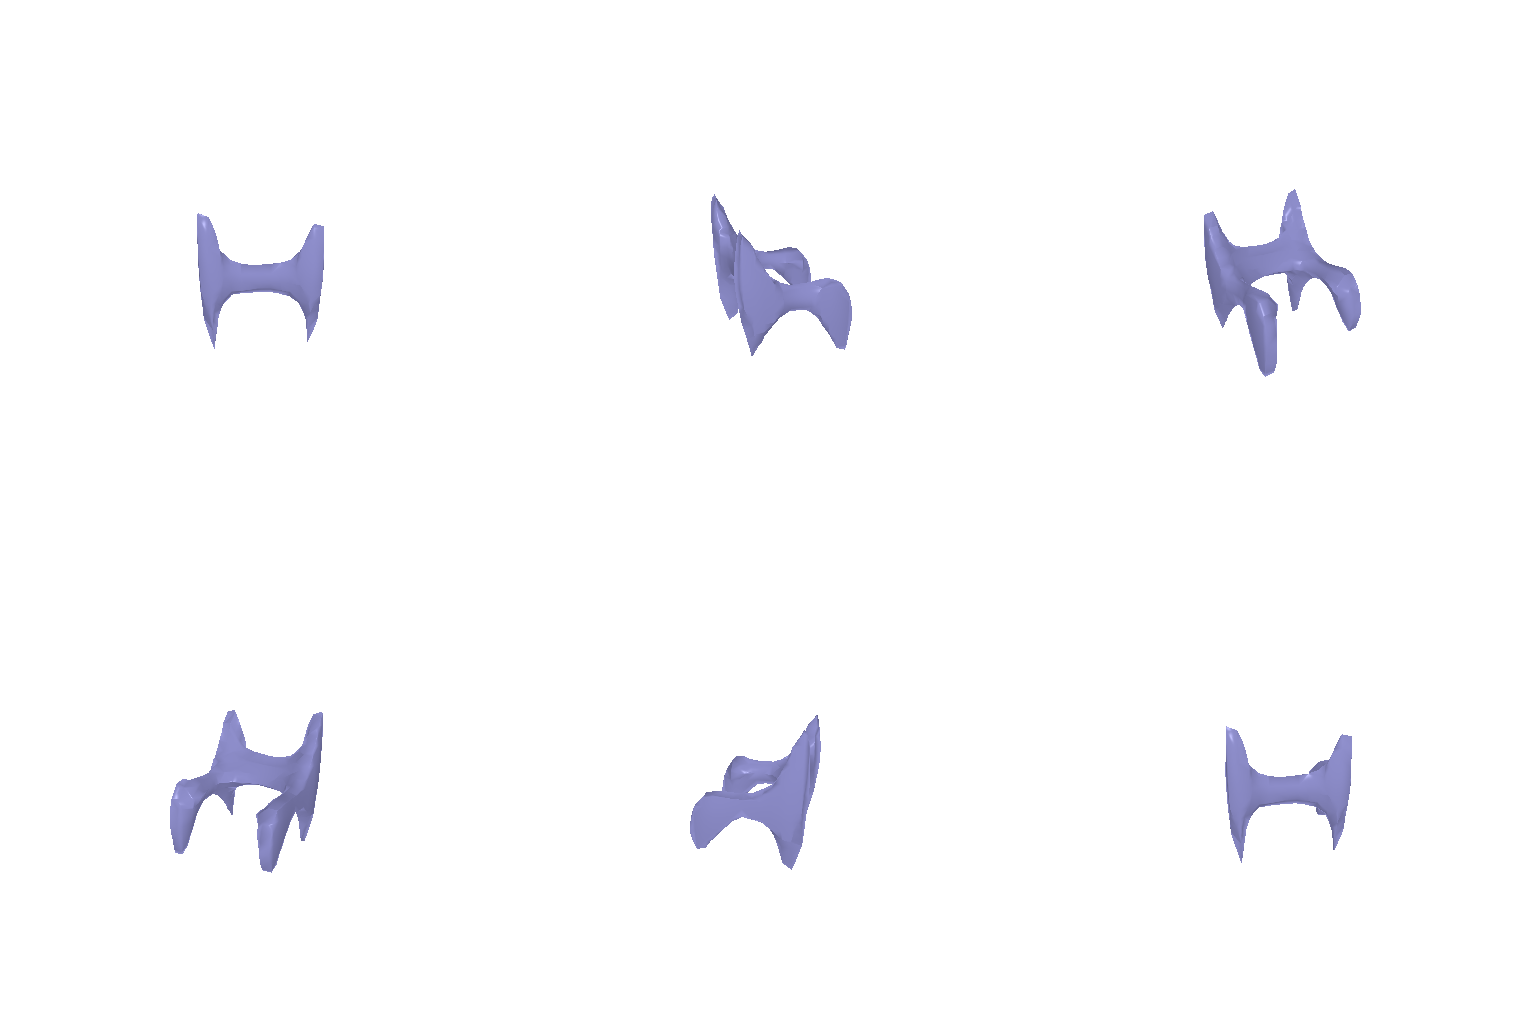
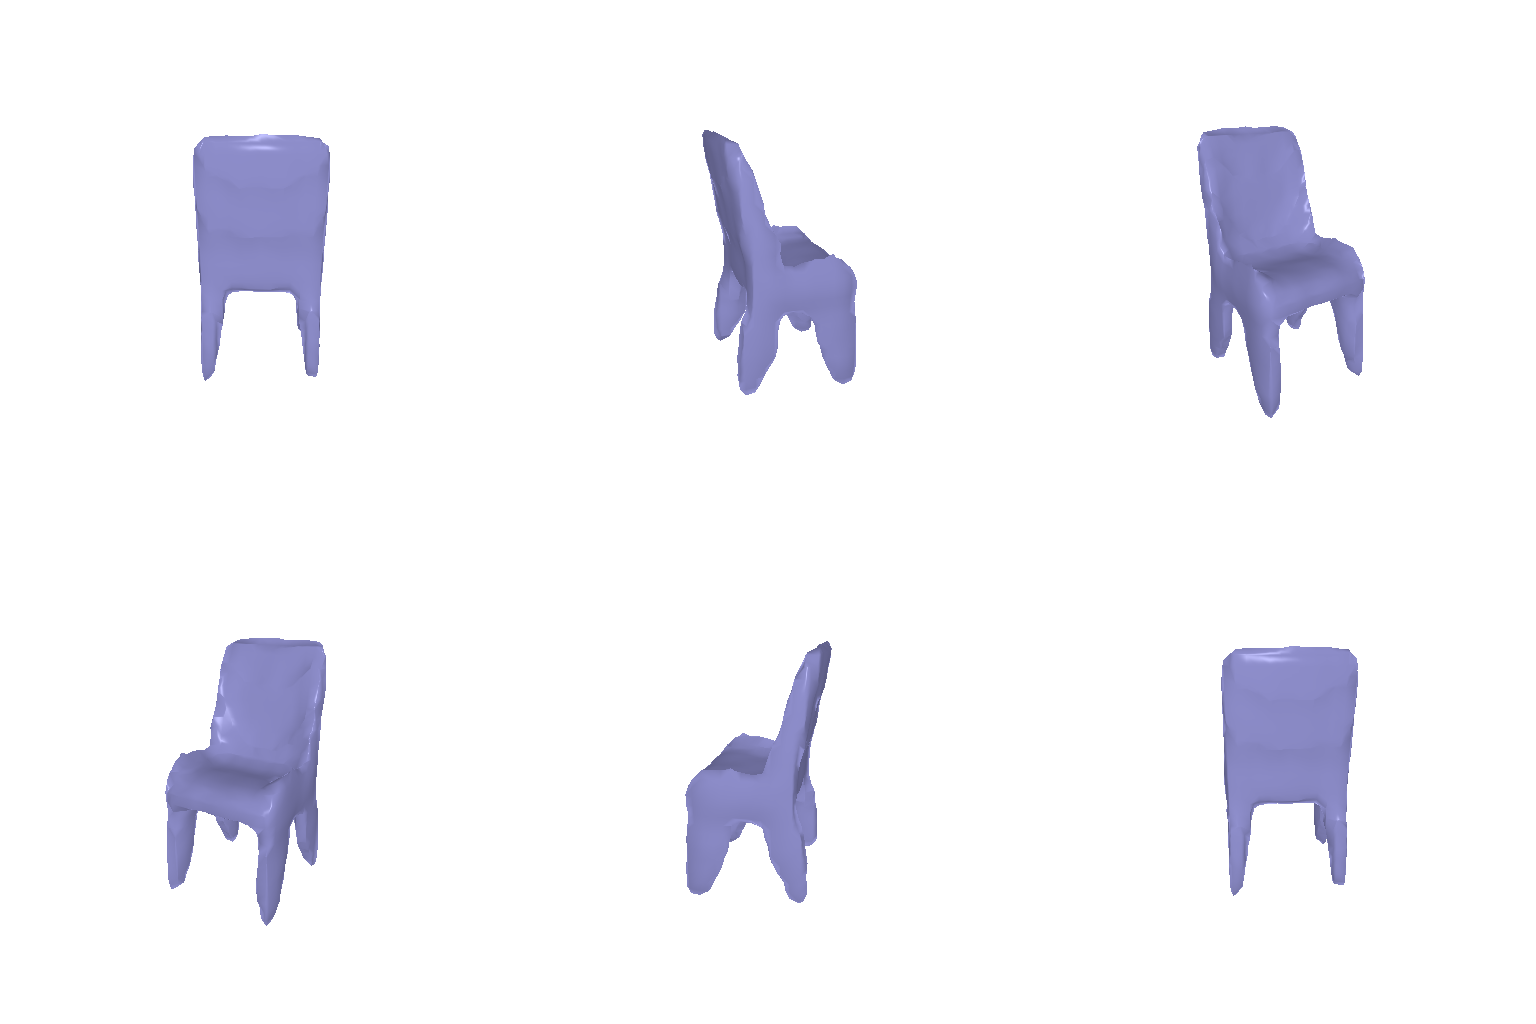
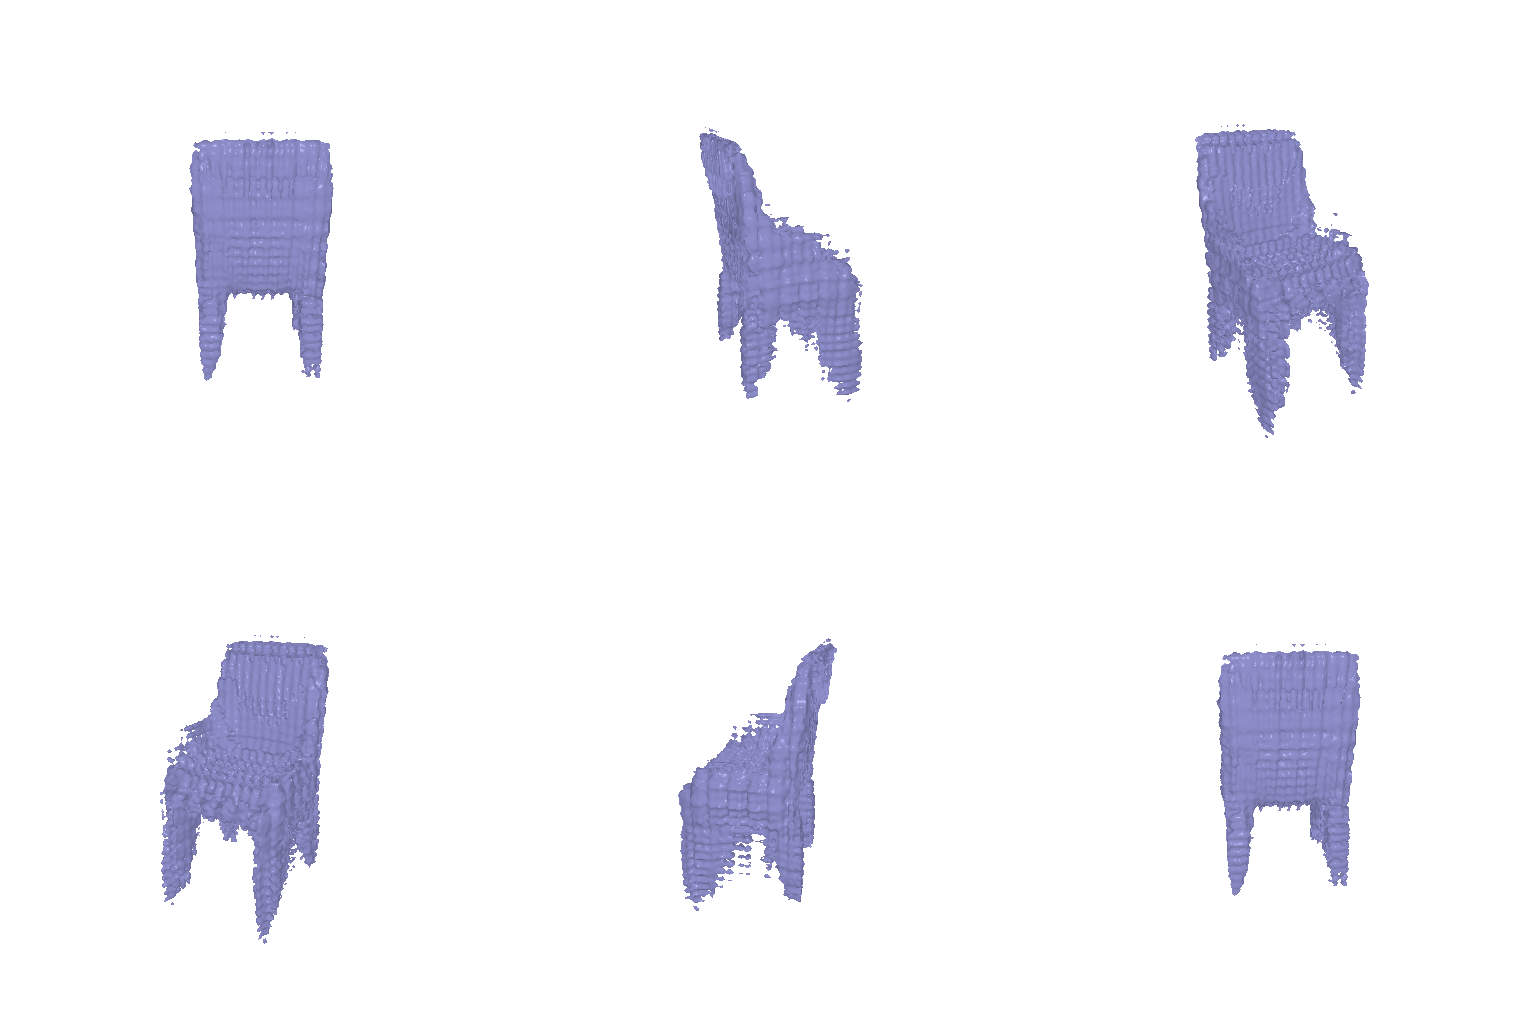
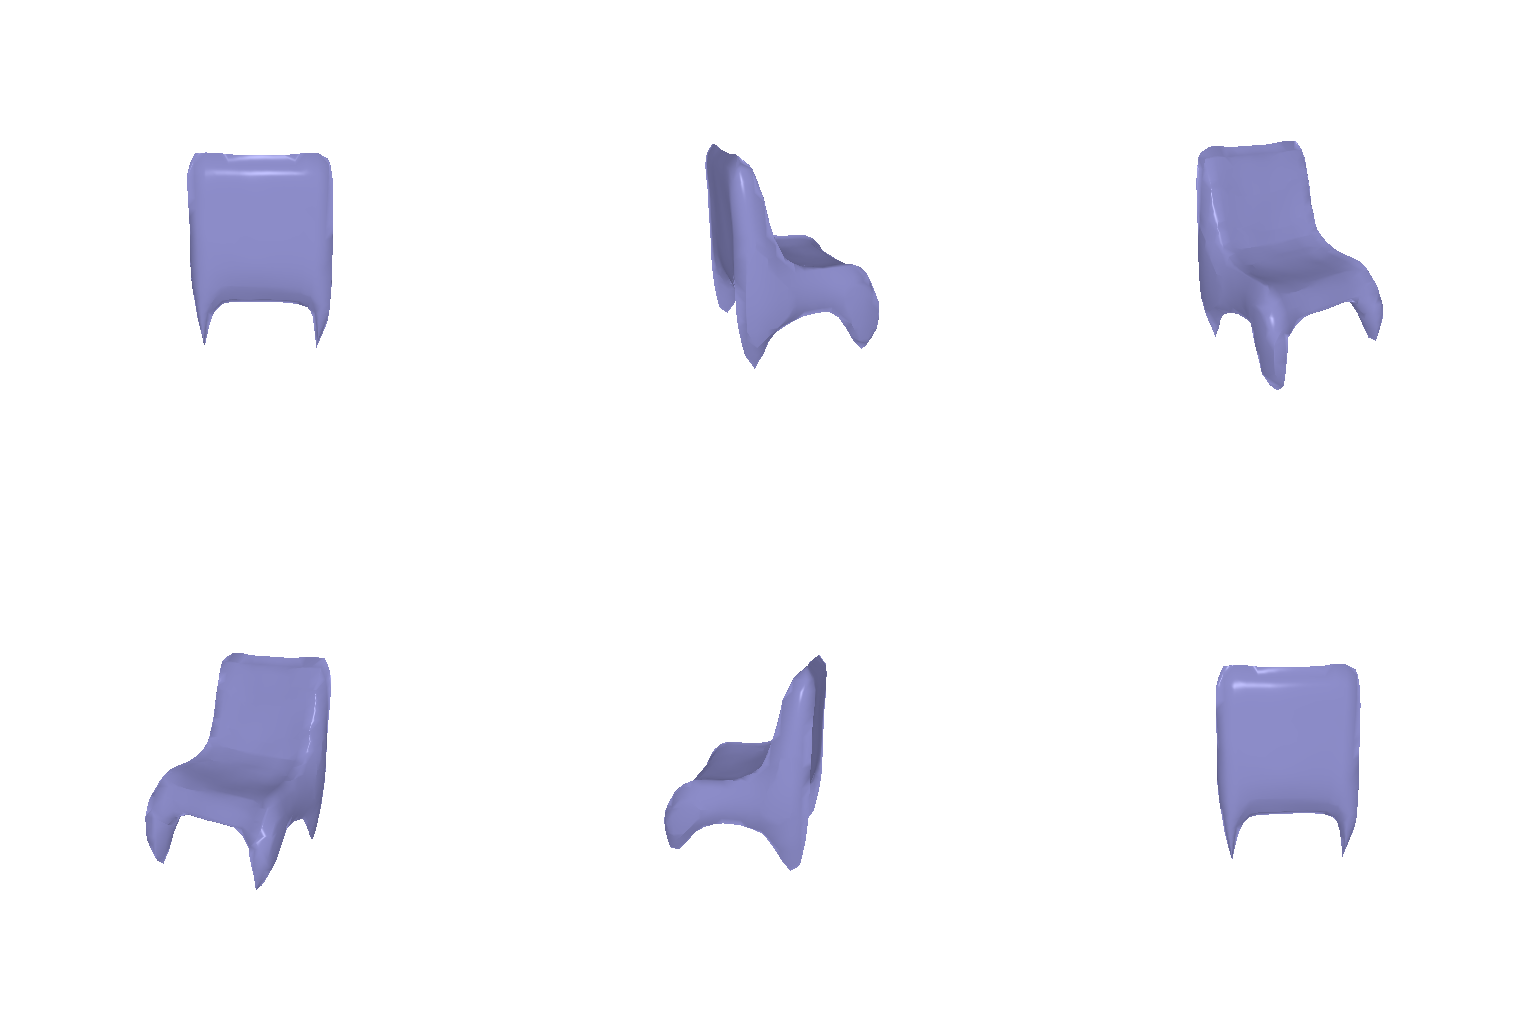
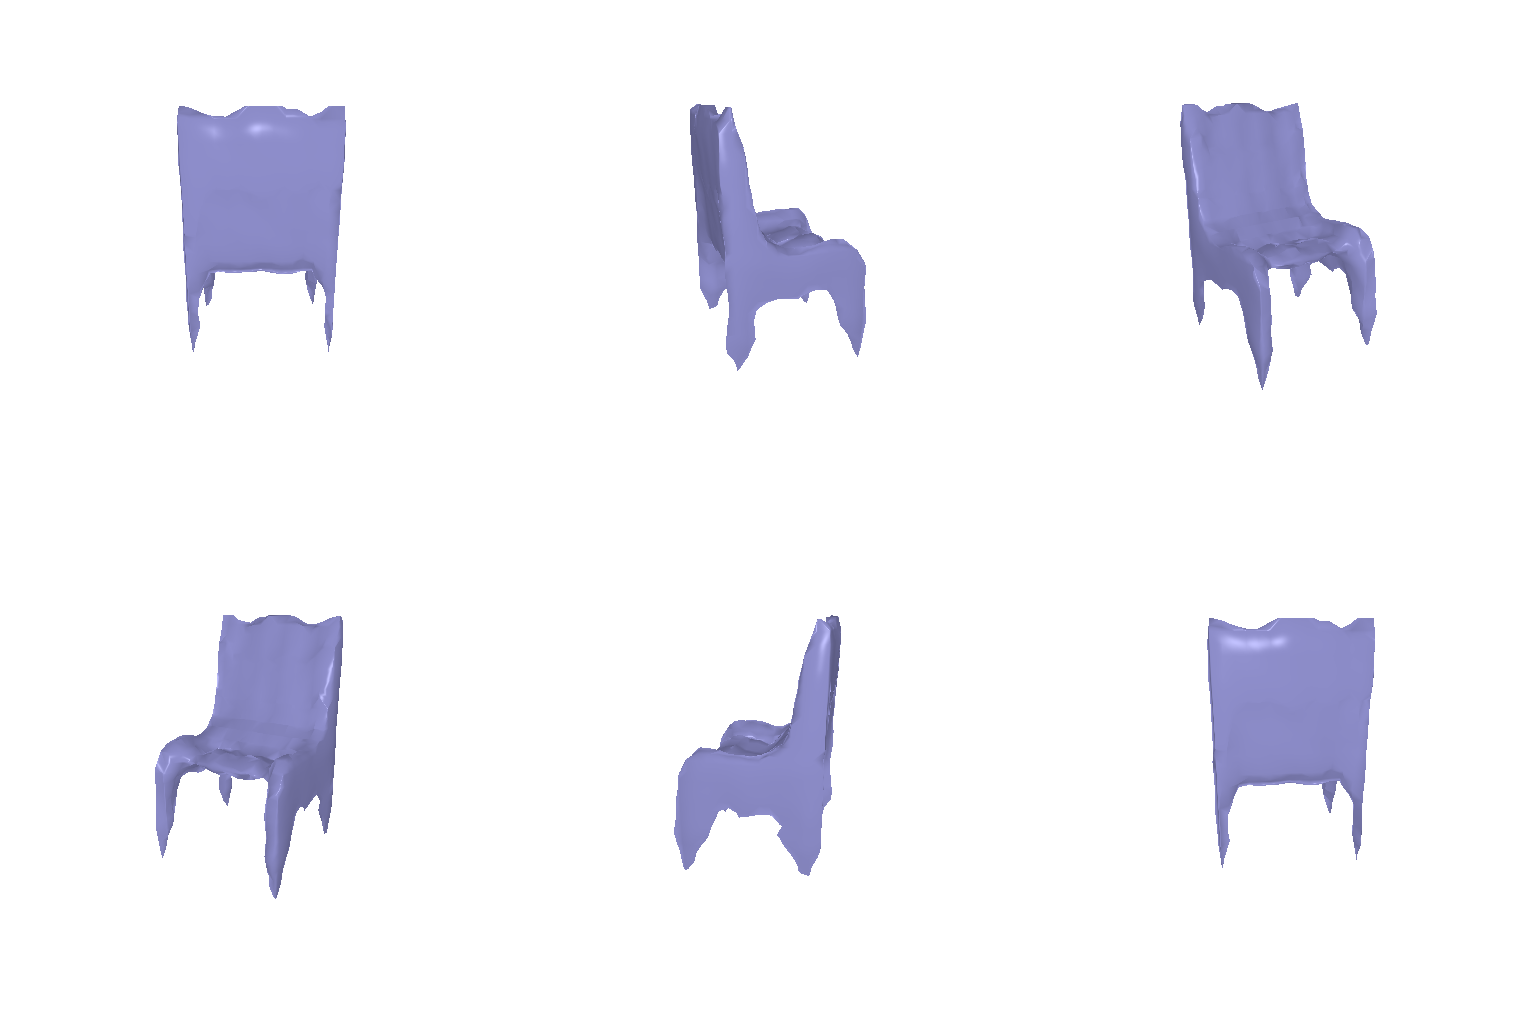
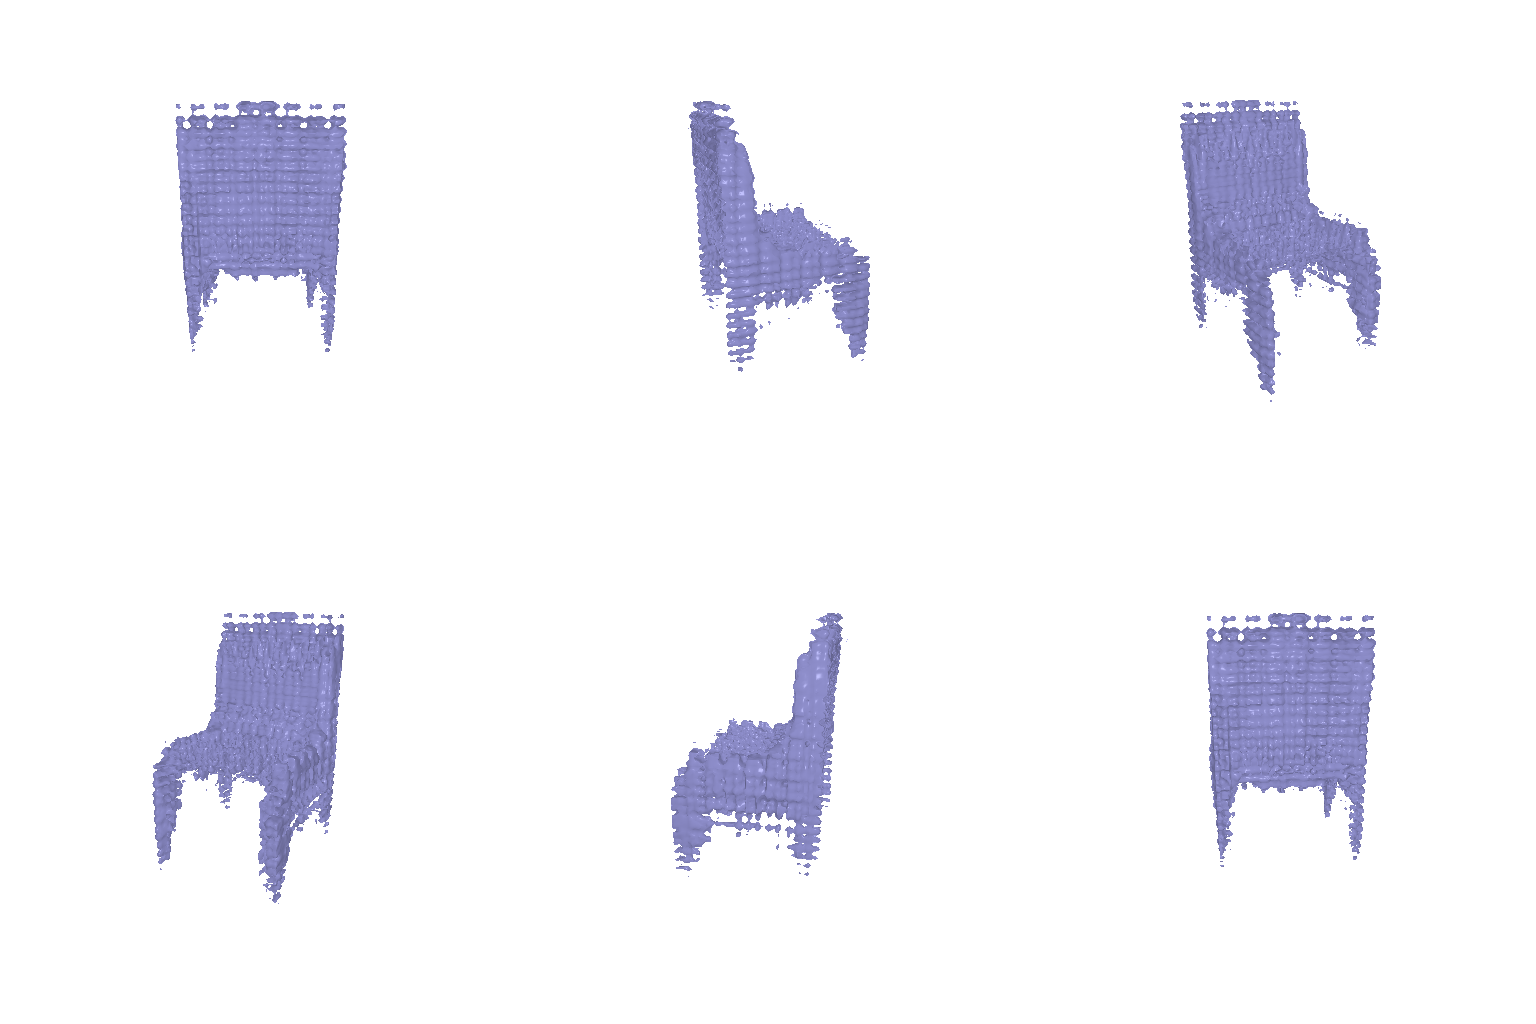
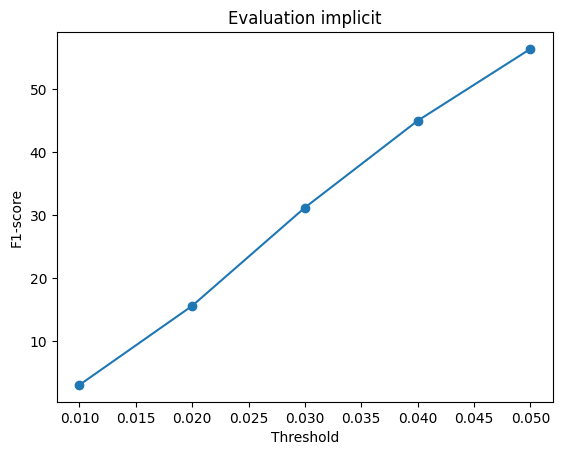
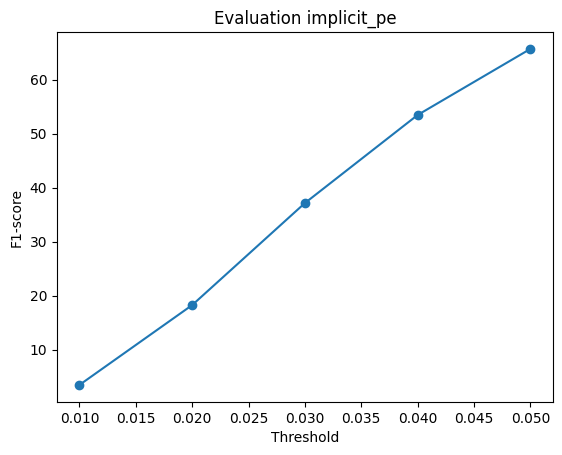
Implicit surfaces are extracted with marching cubes at each model's chosen occupancy threshold (0.3 for step 2, 0.7 for step 4). The steps are explained below.
Decoder
The decoder is a function f(c, p) from the 512-d image feature c and a 3D location p in (−1, 1)³ to an occupancy logit:
- As in Occupancy Networks (ONet) [1]: 5 fully connected residual blocks of width 256, a 3→256 input layer and a 256→1 output layer (1.3M parameters).
- Instead of the paper's conditional batch norm, c is injected as in Convolutional Occupancy Networks [2]: a separate linear projection of c is added to the hidden state before every block. (ONet's ablation shows that feeding c only at the input is clearly worse.)
- For a full prediction the decoder is queried at the 32³ cell centers −1 + (i + 0.5)·2/32, in the R2N2 voxel layout, so it returns the same 1×32×32×32 output as 2.1 and is evaluated identically.
Each training step queries 2,048 cell centers per chair, drawn uniformly (ONet found uniform sampling best; here the ground truth only exists at cell centers). The loss is plain BCE. A full 32³ query per chair would not fit in 4 GB at batch size 32.
Choosing the occupancy threshold
ONet picks the extraction threshold on validation data (0.2 for single-view reconstruction) rather than using 0.5:
| Threshold | 0.2 | 0.3 | 0.4 | 0.5 |
|---|---|---|---|---|
| Validation F1@0.05 | 50.9 | 58.3 | 55.6 | 43.6 |
| Precision | 45.8 | 56.9 | 64.4 | 59.2 |
| Recall | 58.6 | 61.1 | 52.6 | 38.4 |
The threshold plays the role of pos_weight in 2.1. A chair occupies only 4.6%
of the cells on average (median 3.4%), so plain BCE learns low occupancies and a 0.5 cut
under-fills: 149 of the 678 test chairs come out completely empty at 0.5, but only 9 at
0.3.
How the decoder evolved
Each step changes one thing and keeps the same encoder, training length and protocol (train on 5,800 chairs, choose the threshold on the 300 held-out, report the test set):
| Step | Change | Threshold | Val F1@0.05 | Test F1@0.05 | Test P / R | Empty test predictions |
|---|---|---|---|---|---|---|
| 1 | Global-feature decoder, uniform sampling | 0.5 | 43.6 | 40.0 | 57.2 / 35.1 | 149 |
| 2 | Threshold chosen on validation | 0.3 | 58.3 | 56.4 | 54.5 / 60.1 | 9 |
| 3 | + attended local image features | 0.4 | 49.0 | – | – | – |
| 4 | Step 2 + Fourier features + balanced sampling | 0.7 | 63.5 | 65.7 | 62.3 / 71.1 | 0 |
For reference, the 2.1 voxel decoders score 58.0 (plain BCE) and 62.1 (pos_weight 2) on the test set, so only step 4 beats them.
Step 2 → the global feature looked like the bottleneck. With a tuned threshold the implicit decoder (56.4) lands next to the 2.1 decoder trained with the same plain BCE (58.0). Both read the same 512-d feature, which suggested the limit was the global code — the problem Convolutional Occupancy Networks [2] solves with local features. Its renders are smooth blobs, and the folding chair's thin frame is reduced to fragments.
Step 3: local features (did not help). The natural single-image version of local features is pixel-aligned, as in PIFu [3]: project each query point into the image and read the feature map there. The R2N2 cameras do not line up with these meshes, though. Projecting ground-truth surfaces through the provided camera parameters, under every axis convention I tried, put at best 81% of the points on the chair's silhouette, with chair-dependent misalignment; the renders were most likely made from differently normalized ShapeNet models. Instead, each query point cross-attends to the ResNet18 layer3 and layer4 maps (106 positions with learned position embeddings) and learns the correspondence itself. This overfit: training loss ended lower than step 2's (0.087 vs. 0.090) but validation F1@0.05 was 9 points worse. Learned attention has no built-in link between a 3D location and an image location, so the extra capacity went into fitting the training images. I stopped it before the final retrain, so it has no test score.
Step 4: Fourier features and balanced sampling. Both target weaknesses that the global decoder exposed:
- The query point enters as [p, sin(2kπp), cos(2kπp)], k = 0…5 (39 dimensions), instead of raw xyz — the positional encoding of NeRF [4]. An MLP on raw coordinates is biased toward smooth functions [5], which suits blobs but not thin legs.
- Each chair's 2,048 training cells are a third occupied, a third empty within two cells of the surface, and a third uniform. Uniform sampling gives only about 5% occupied cells, which is why step 2 under-filled. Balanced sampling moves the problem to the other side: the model now over-fills and its best threshold rises to 0.7 (I extended the search to 0.9). At 0.5 the test F1@0.05 would be only 53.1.
Together they raise test F1@0.05 from 56.4 to 65.7, past the weighted voxel decoder. The difference already shows when overfitting a single chair: step 2 still predicted an empty grid after 400 steps, while step 4 reached IoU 1.0 after 300. The two changes were added together, so the table does not separate their contributions. In the renders, the folding chair goes from fragments to a connected back, seat and legs, and every test chair gets a non-empty prediction.
Evaluation
| Model (678 test chairs) | F1@0.05 | Precision | Recall | Empty |
|---|---|---|---|---|
| 2.1 voxel decoder, pos_weight 1 | 58.0 | 69.3 | 54.5 | 17 |
| 2.1 voxel decoder, pos_weight 2 | 62.1 | 61.4 | 64.8 | 0 |
| Implicit step 2, threshold 0.3 | 56.4 | 54.5 | 60.1 | 9 |
| Implicit step 4, threshold 0.7 | 65.7 | 62.3 | 71.1 | 0 |
Querying at higher resolution
A continuous decoder can be queried on any grid, which a voxel decoder cannot. Test F1@0.05 over all 678 chairs:
| Query grid | Step 2 | Step 4 |
|---|---|---|
| 32³ (training grid) | 56.5 | 65.7 |
| 64³ | 56.7 | 66.2 |
| 128³ | 56.7 | 66.3 |
- Step 2 gains nothing (+0.2), and its 128³ surfaces look like the 32³ ones. It was only supervised at the 32³ cell centers, so between them it interpolates smoothly and has no finer detail to reveal. (The 56.5 vs. 56.4 difference to the standard evaluation is point-sampling noise.)
- Step 4 gains a little (+0.6, mostly recall: 71.2 to 74.8), but at 128³ its surfaces show grid-aligned ripples: the Fourier features' high frequencies are free to oscillate between the supervised cell centers, the artifact [5] warns about when the frequencies are too high for the sampling.
- Real gains from resolution would need supervision between cell centers, such as occupancies of points tested against a watertight mesh, as in ONet [1].
References
- [1] Occupancy Networks: Learning 3D Reconstruction in Function Space.
Represents a shape as the decision boundary of a network that maps a 3D point and an image (or shape) code to an occupancy probability, so a mesh can be extracted at any resolution. Used here: the residual fully connected decoder, uniform point sampling, and choosing the extraction threshold on validation data. - [2] Convolutional Occupancy Networks.
Replaces ONet's single global code with convolutional features on planes or a 3D grid that each query point interpolates, so the decoder sees local detail. Used here: adding the projected code before every block, and the motivation for local features in step 3. - [3] PIFu: Pixel-Aligned Implicit Function for High-Resolution Clothed Human Digitization.
Projects each 3D query point into the image with the known camera and conditions the implicit decoder on the image feature at that pixel and the point's depth. Used here: the intended step-3 design, which the misaligned R2N2 cameras ruled out. - [4] NeRF: Representing Scenes as Neural Radiance Fields for View Synthesis.
Fits a scene with a coordinate MLP whose inputs first pass through sines and cosines at octave frequencies (positional encoding). Used here: the step-4 encoding of the query point with 6 frequencies. - [5] Fourier Features Let Networks Learn High Frequency Functions in Low Dimensional Domains.
Shows that MLPs on raw coordinates are biased toward low frequencies and that a Fourier feature mapping removes this bias; frequencies set too high cause noisy artifacts. Used here: why step 4 helps thin parts, and why its 128³ surfaces ripple.
3.2 Parametric network

Decoder
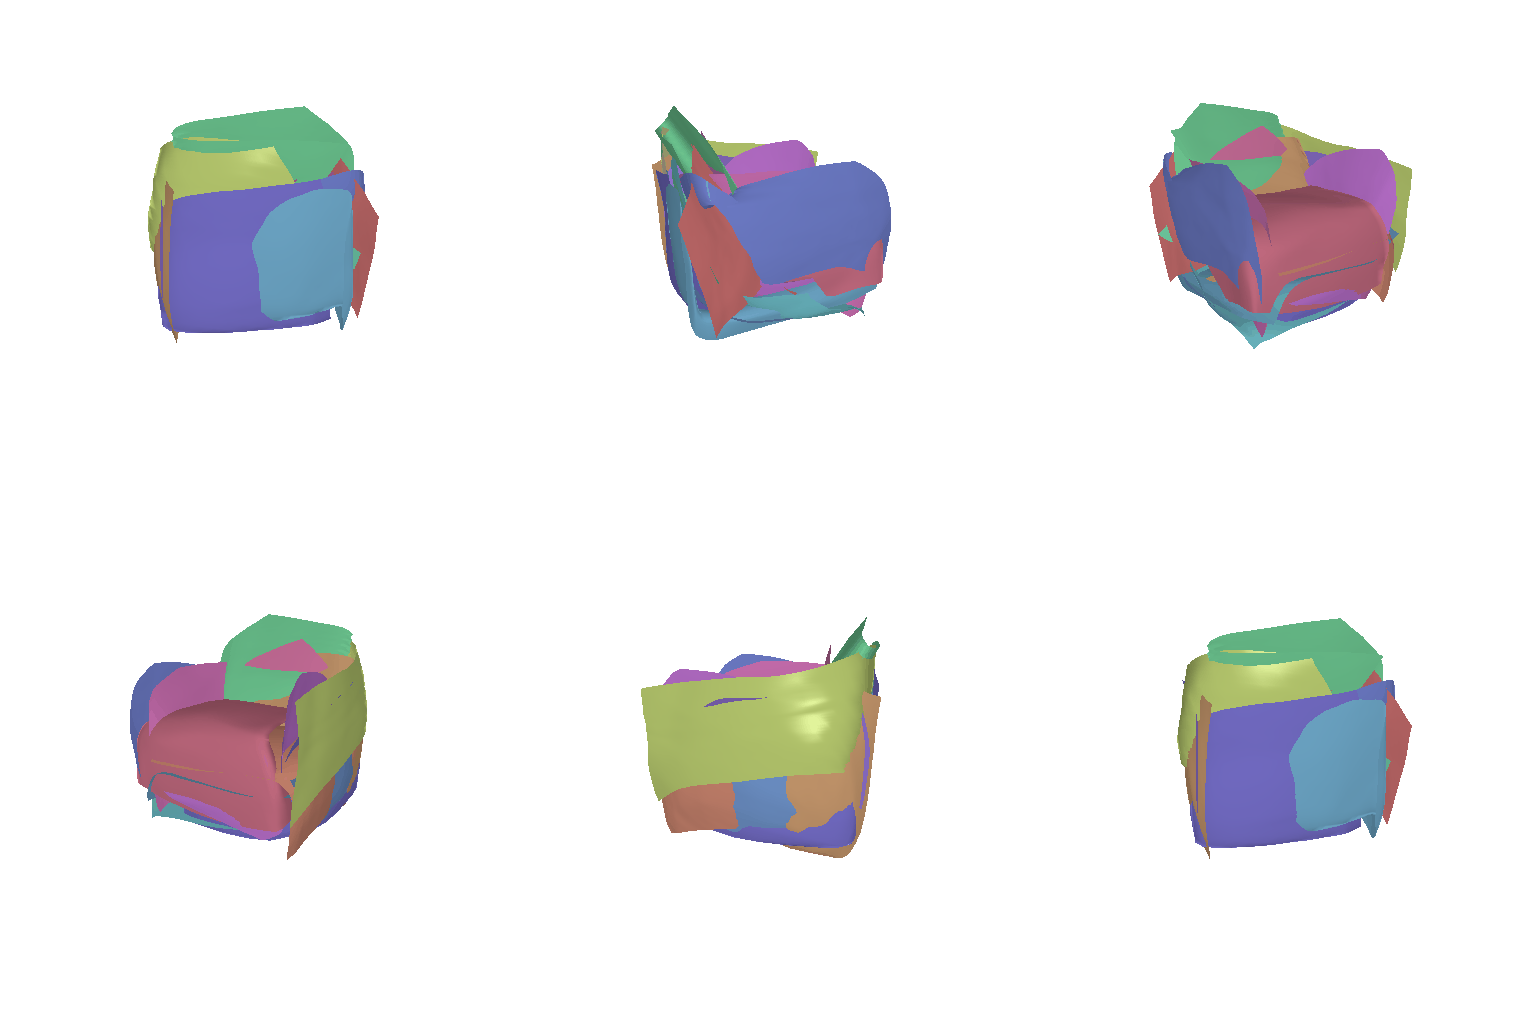
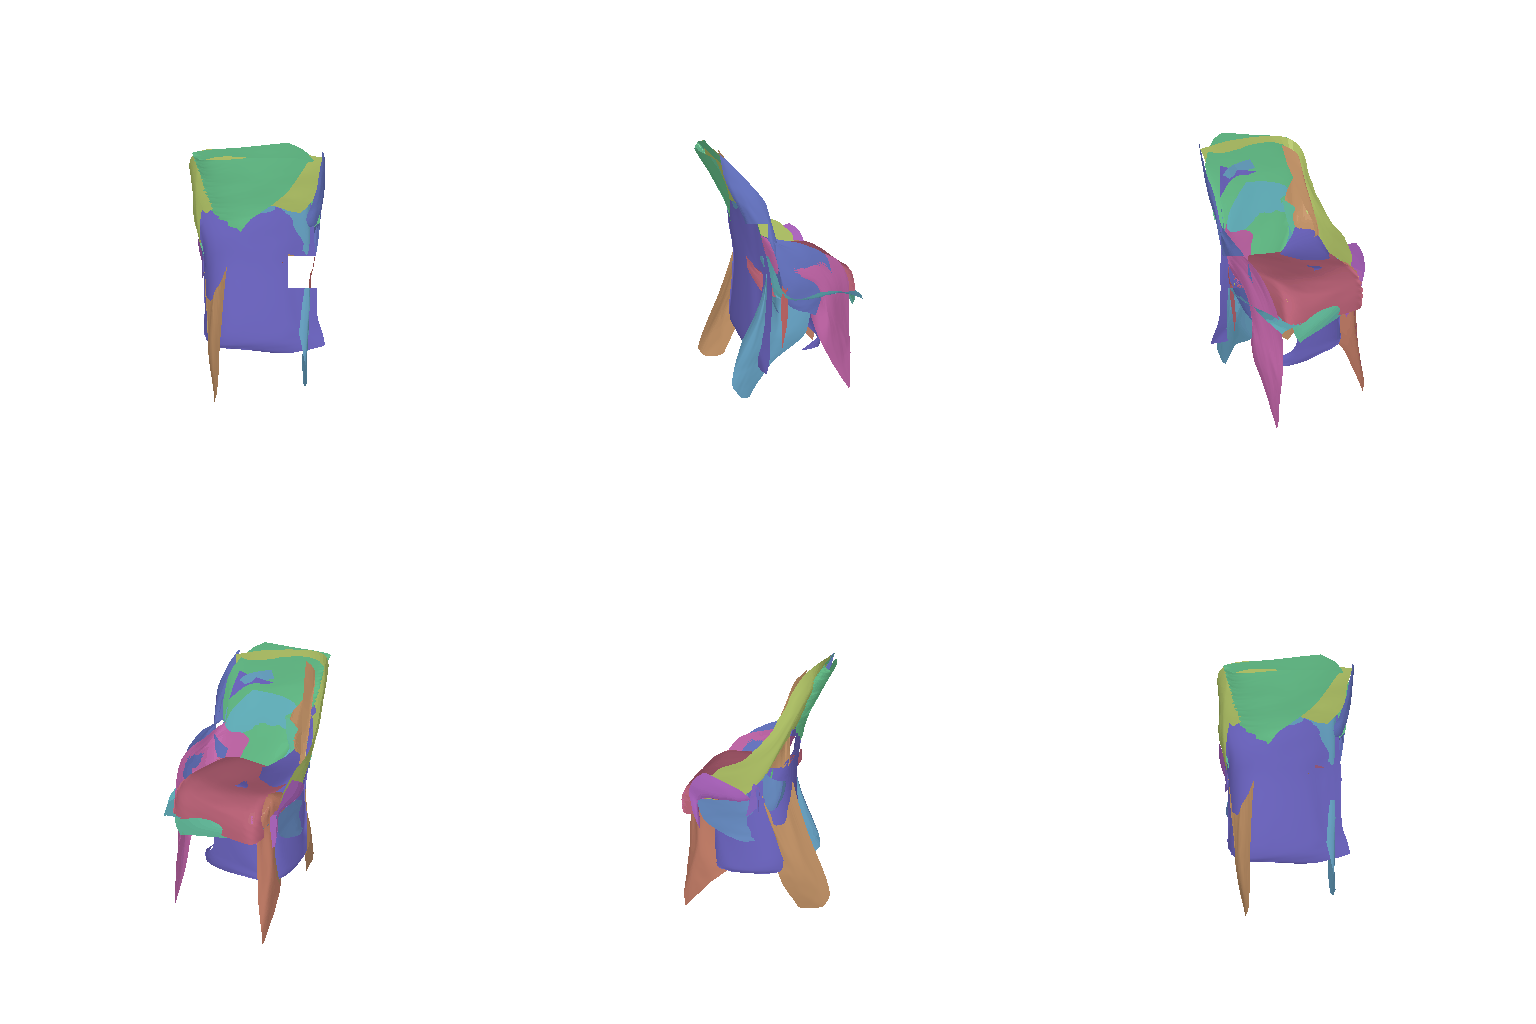
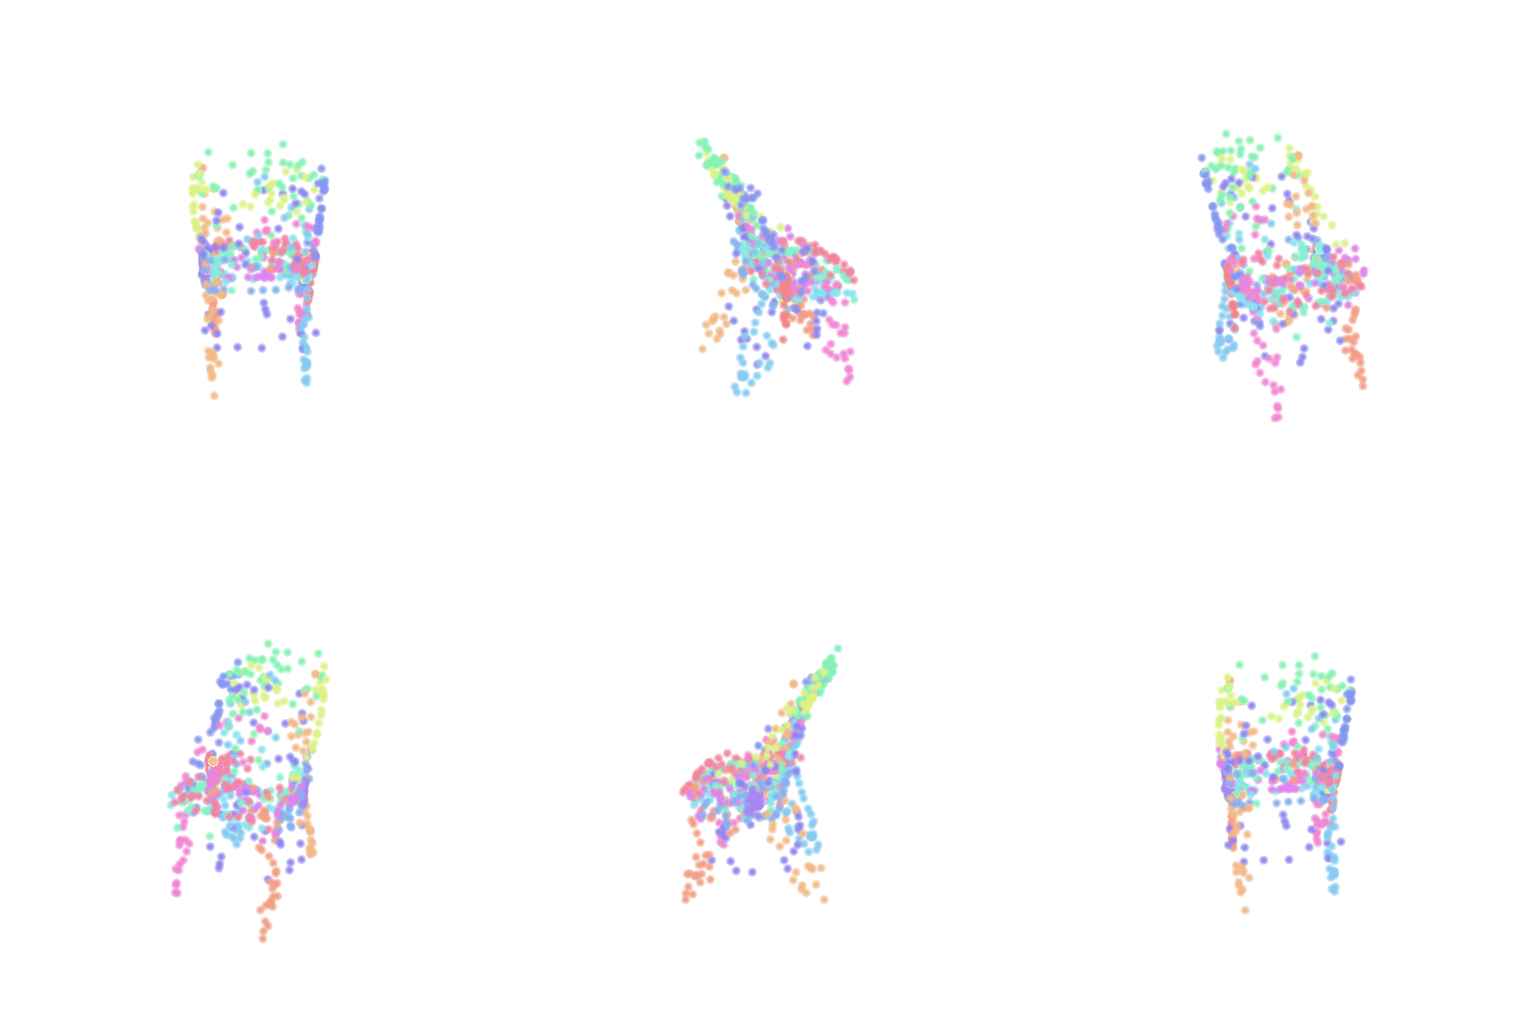
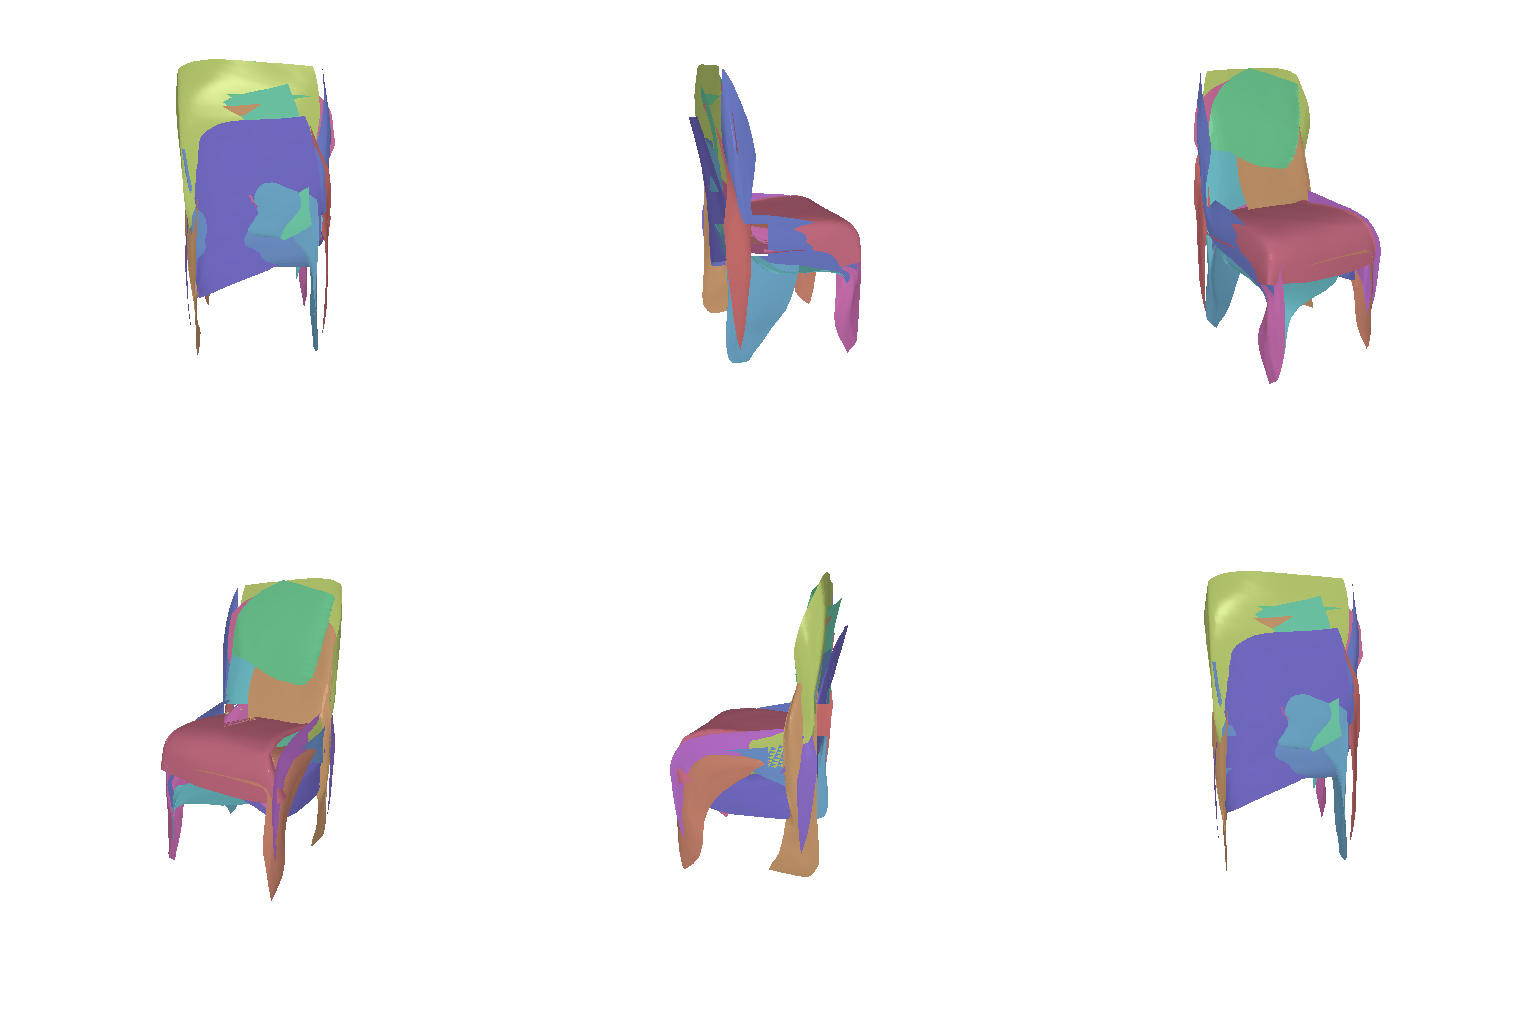
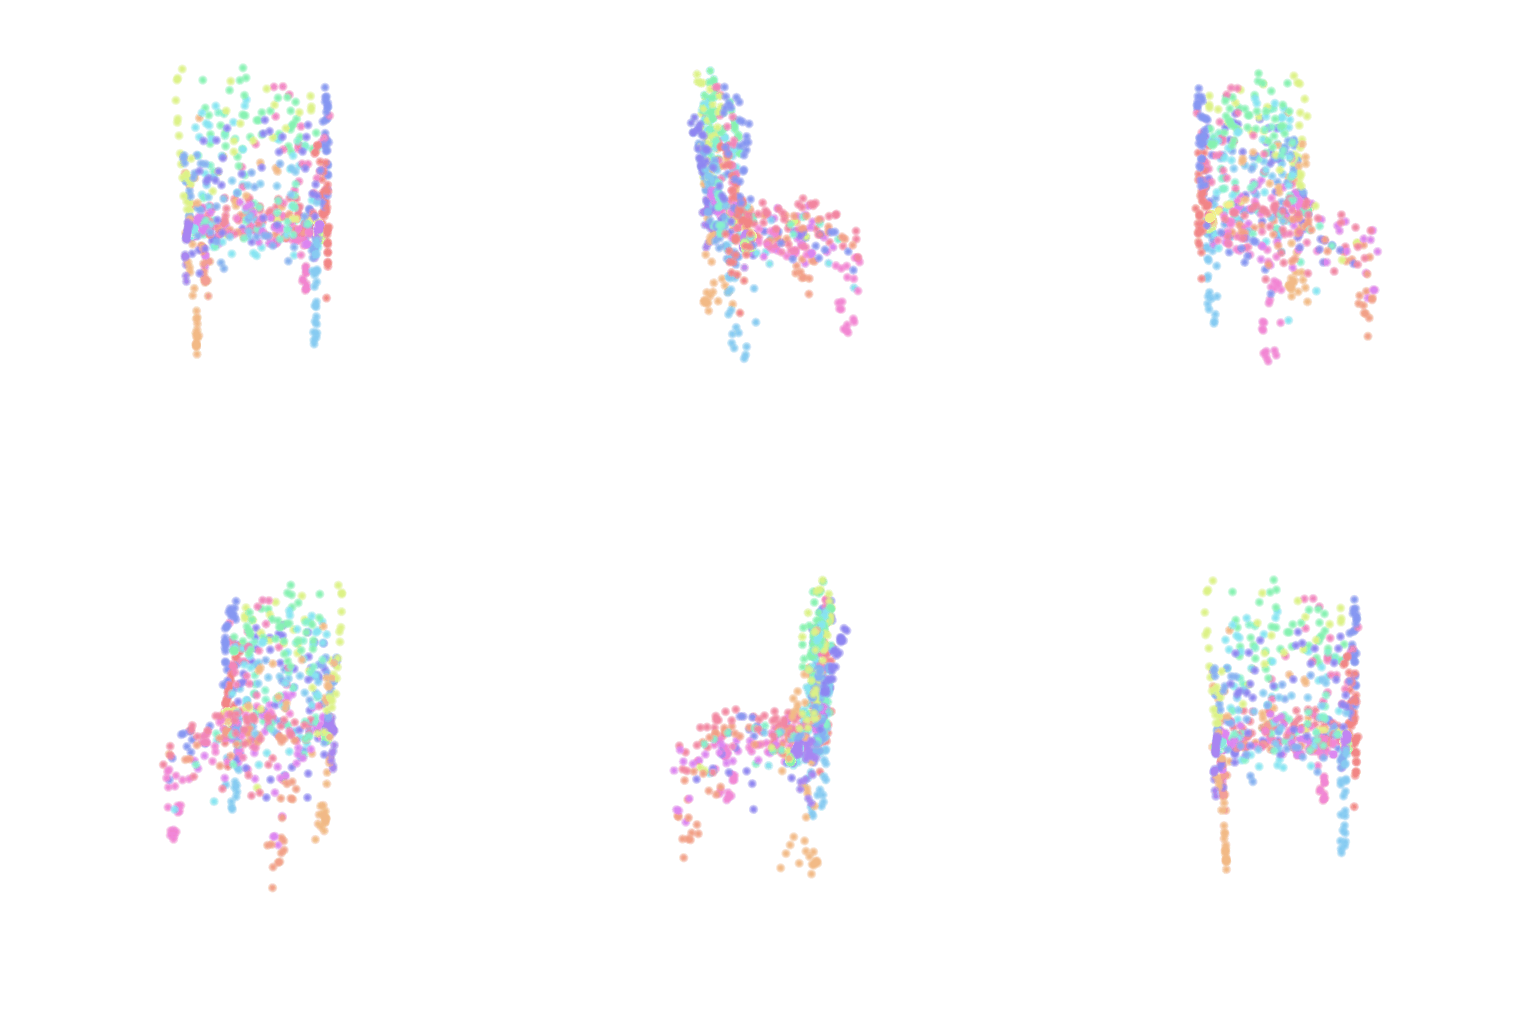
The decoder follows AtlasNet [6]: the surface is the union of K learned parametrizations. Each patch is its own MLP fk(c, u) that maps a point u of the unit square, concatenated with the image feature c, to a 3D point (widths 1024, 512, 256, 128, ReLU, tanh output). The paper's sphere variant samples u on the unit sphere instead, giving one closed patch.
The model outputs 1,000 points, 1000/K per patch, with fresh random u every
step, and trains with chamfer_loss against 1,000 ground-truth surface points; it
is scored like 2.2. For the mesh renders, each square patch is sampled on a 32×32 grid
whose connectivity is carried to 3D (the sphere uses level-4 ico-sphere faces).
Number of patches
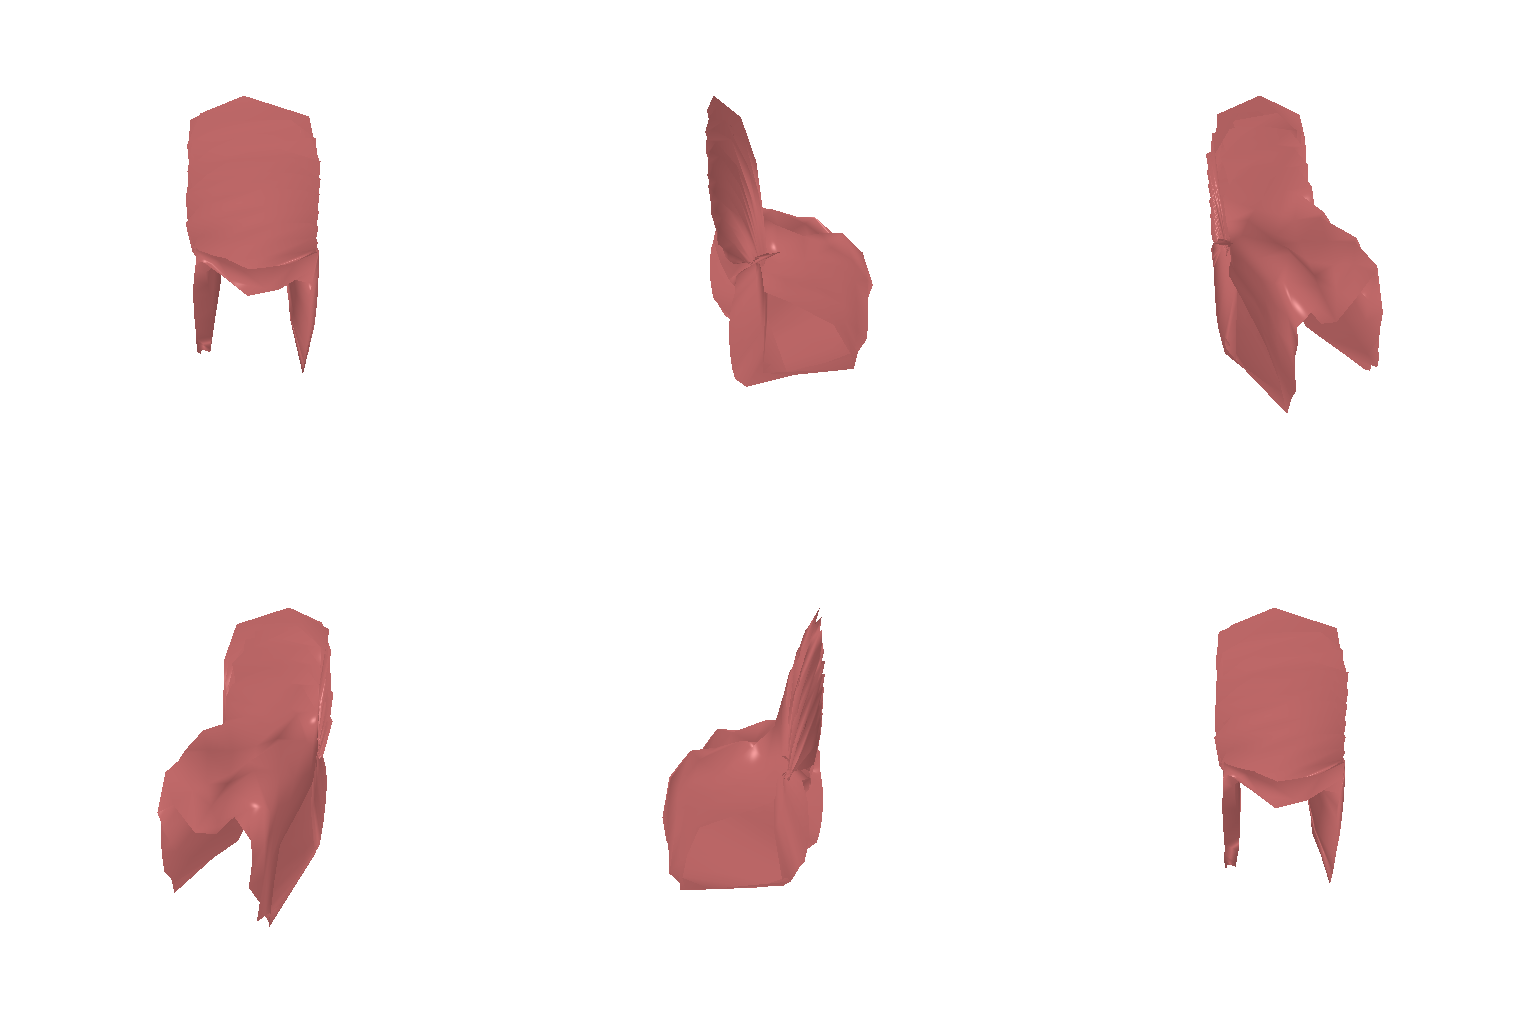
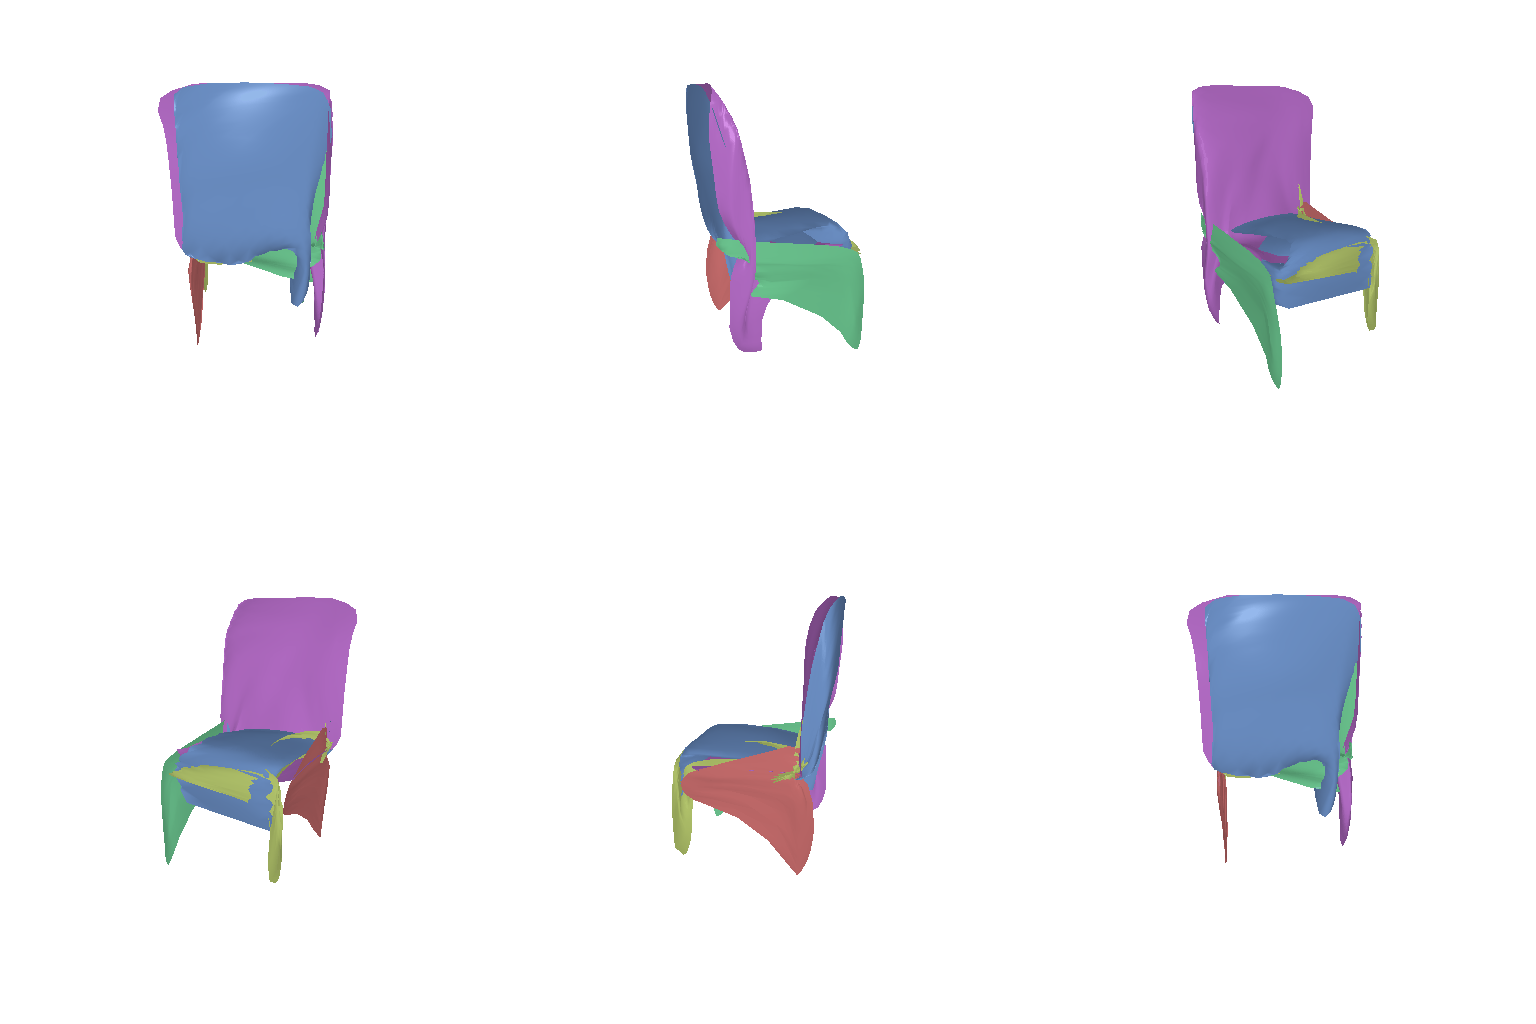
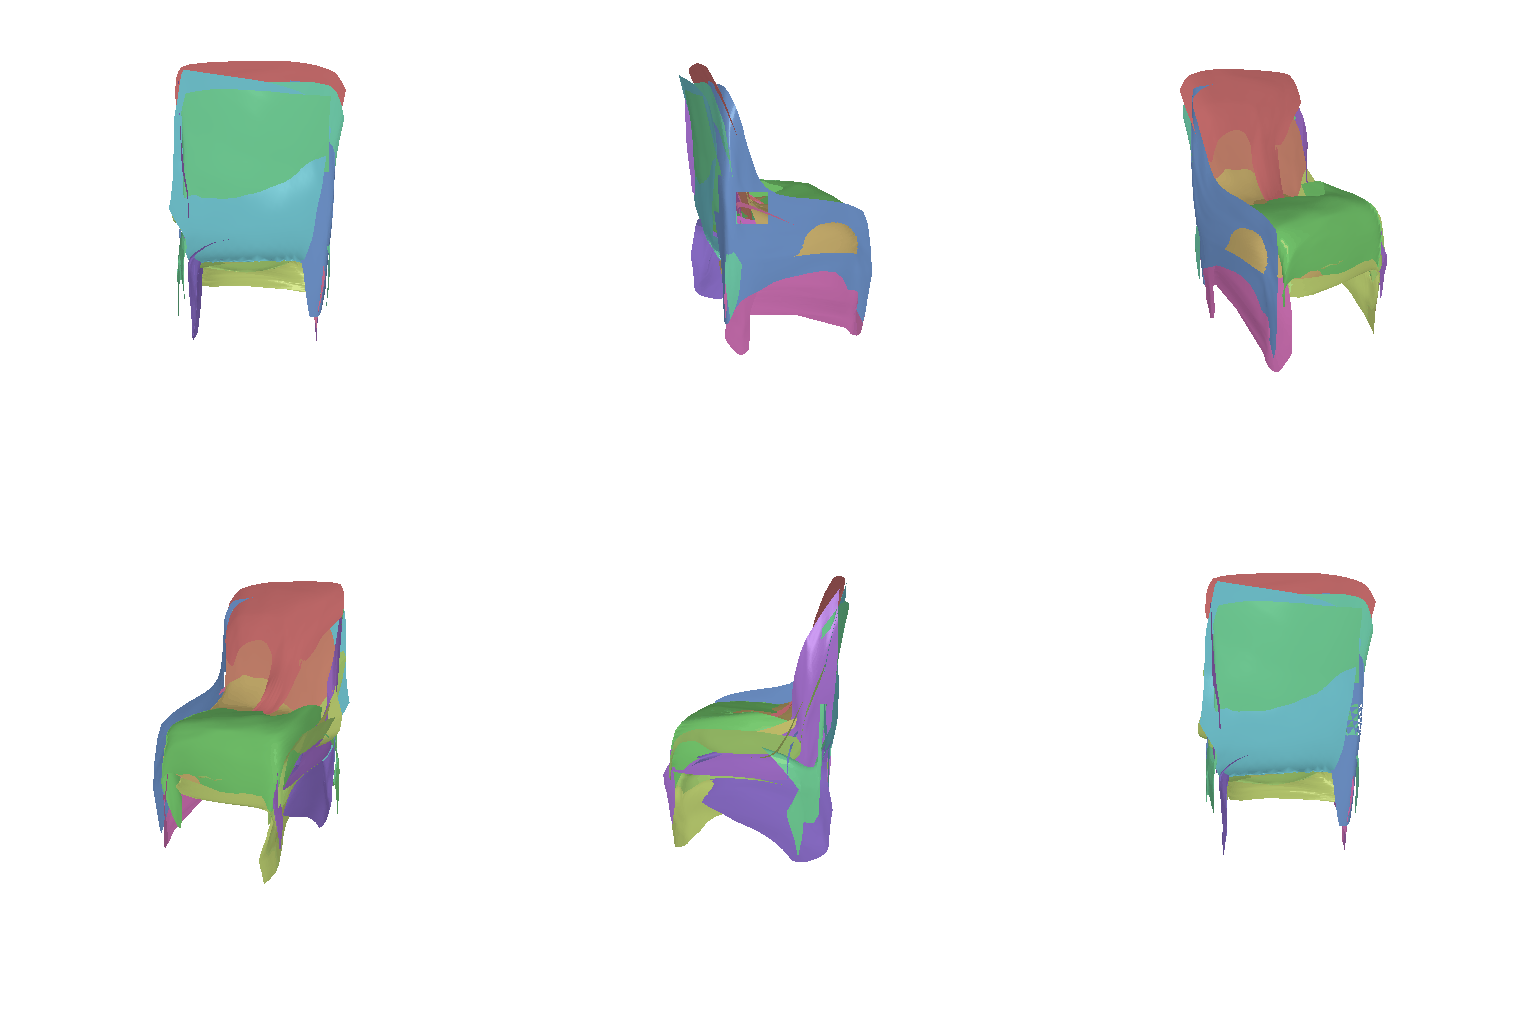
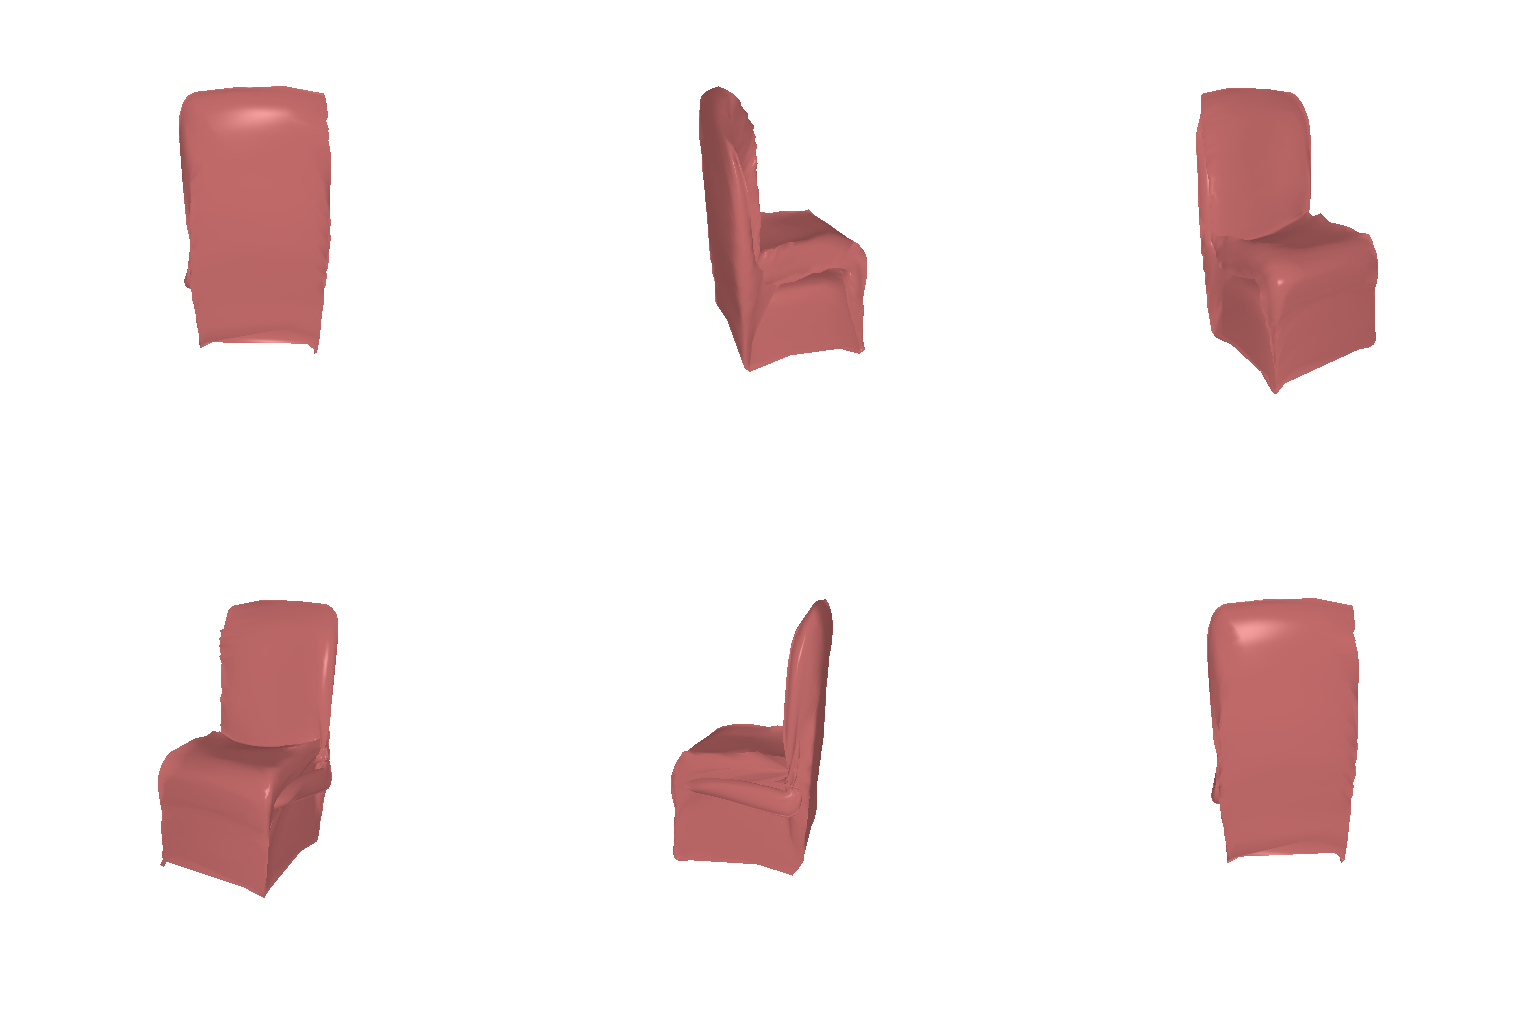
| Variant | 1 patch | 5 patches | 25 patches | 1 sphere |
|---|---|---|---|---|
| Validation F1@0.05 | 71.1 | 74.2 | 75.1 | 73.5 |
| Precision | 76.8 | 77.1 | 77.4 | 73.8 |
| Recall | 68.2 | 72.8 | 74.3 | 74.7 |
- The ranking matches AtlasNet's Table 1: more patches are better with diminishing returns, and the sphere lands between one and five squares.
- Most of the gain is recall (68.2 to 74.3). A single square must fold and stretch to reach the whole chair; with more patches, each covers one part (the back, the seat, a leg).
- The sphere has the best recall but the worst precision: like the 2.3 mesh, it is one closed surface that has to span the gaps between legs.
The final model uses 25 patches, the paper's choice for single-view reconstruction, retrained on all 6,100 chairs.
Evaluation
Test F1@0.05 over 678 chairs: 76.5 (precision 78.5, recall 75.9), no empty predictions.
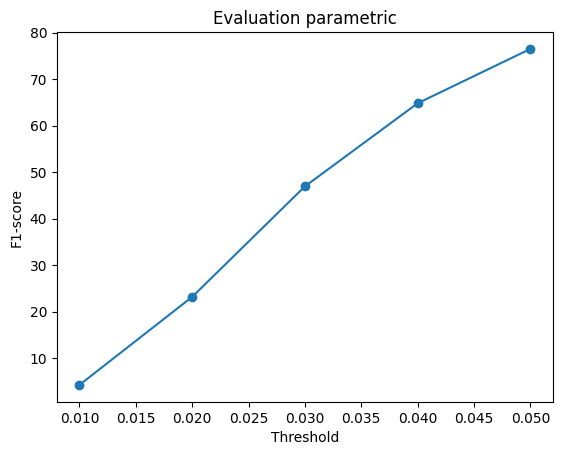
| Final model (678 test chairs) | F1@0.05 | Output |
|---|---|---|
| 2.1 voxel decoder | 62.1 | 32³ grid |
| 3.1 implicit decoder (step 4) | 65.7 | occupancy at any point |
| 2.3 deformed ico-sphere | 74.9 | one closed mesh |
| 3.2 AtlasNet, 25 patches | 76.5 | points and a patch mesh |
| 2.2 point decoder | 80.1 | 1,000 points |
- Between free points and one mesh. Tying each point to a continuous patch costs 3.6 F1@0.05 against the 2.2 point decoder. The patches are independent and may overlap or leave gaps, so they avoid the single-surface constraint of 2.3 and gain 1.6 F1@0.05 over it.
- The cost of that freedom is visible. The chairs are recognizable, including the folding chair's back, seat and legs, but the surface is a papier-mâché of overlapping patches with seams and small holes, not one watertight mesh. AtlasNet names the same limitations and fixes them with Poisson reconstruction or the sphere variant.
- Link to Deep Geometric Prior [7]. It uses local charts too, but fits one small network per chart to a single point cloud with no training set, uses a Wasserstein loss for explicit correspondences, and adds a consistency loss so overlapping charts agree. Our model has nothing that makes neighboring patches agree, and the seams are the result; such a consistency term is the natural next step.
References
- [6] AtlasNet: A Papier-Mâché Approach to Learning 3D Surface Generation.
Represents a surface as the union of K learned parametrizations: each MLP maps points of a unit square (or one sphere) plus a shape code to 3D, trained with the Chamfer distance, so points or a mesh can be generated at any resolution. Used here: the decoder, the patch counts and the sphere variant. - [7] Deep Geometric Prior for Surface Reconstruction.
Reconstructs a surface from a single noisy point cloud, with no training set, by fitting one small MLP per local chart with an optimal-transport loss and a consistency loss between overlapping charts. Used here: a contrast that explains the seams between AtlasNet patches.
3.3 Extended dataset for training
I retrained the 2.2 point decoder on the extended dataset (split_3c.json): the
3D-R2N2 [8] renderings of three ShapeNet [9] classes.
| Split | Chairs | Cars | Planes | Total |
|---|---|---|---|---|
| Train | 6,100 | 3,146 | 3,640 | 12,886 |
| Test | 678 | 368 | 405 | 1,451 |
- The chair lists in
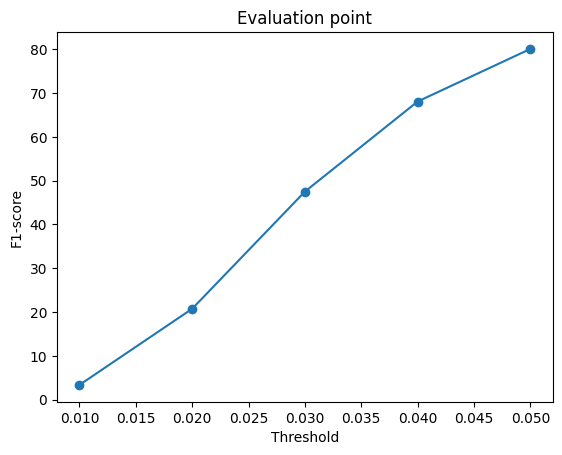
split_3c.jsonare identical tosplit_03001627.json, views included, so both models are scored on exactly the same 678 test chairs. dataset_location.pyswitches to the 48 GB extended dataset withL3D_FULL=1;eval_model.py --synsetscores one class of the test set.- Same protocol as 2.2: held-out F1@0.05 was 86.9 / 87.9 / 88.0 at 10k / 20k / 30k steps, so the final model trains for 30k steps. On chairs alone 10k was best; with twice the data, overfitting has not started by 30k.
Quantitative comparison
| Test F1@0.05 (precision / recall) | Chairs (678) | Cars (368) | Planes (405) | All (1,451) |
|---|---|---|---|---|
| Trained on chairs | 80.1 (81.2 / 81.3) | 68.5 (75.6 / 64.6) | 68.0 (63.9 / 79.3) | – |
| Trained on 3 classes | 79.9 (81.4 / 80.5) | 93.5 (93.9 / 93.7) | 96.7 (97.1 / 96.5) | 88.5 (89.5 / 88.5) |
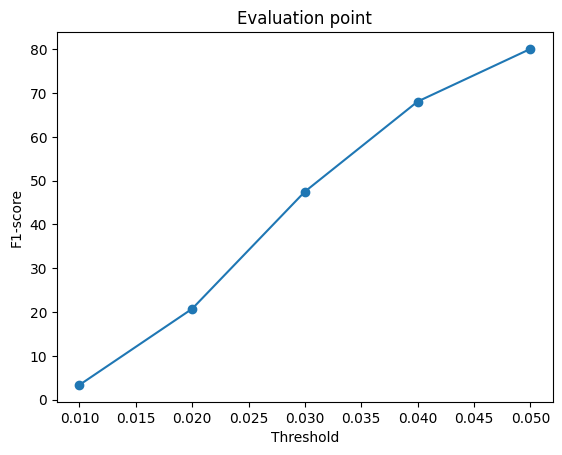
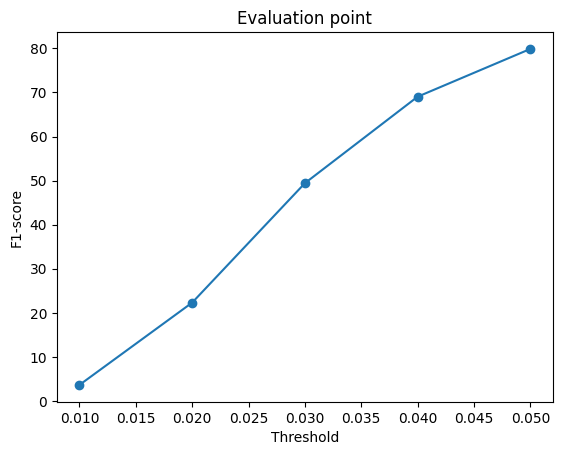
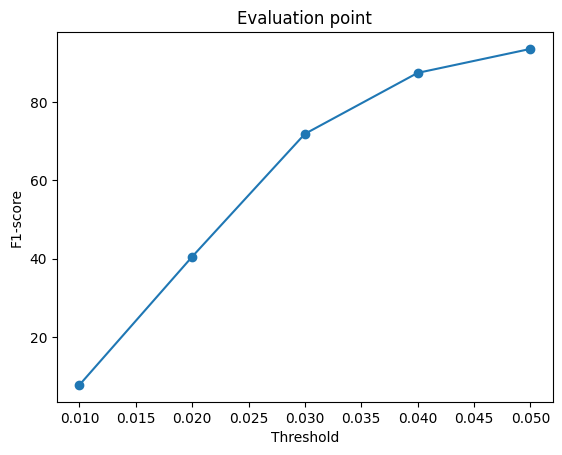
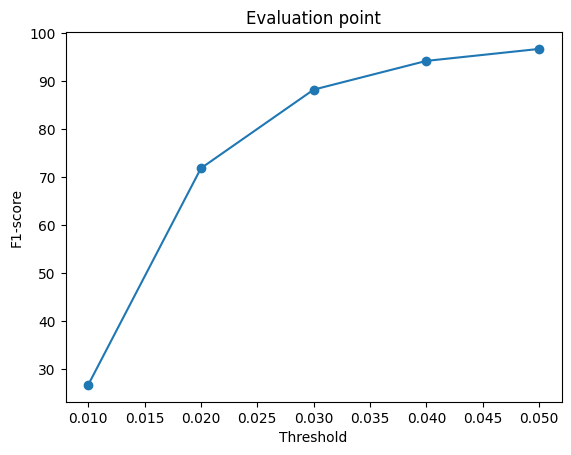
- Chair F1@0.05 does not change. On the same chairs and views it moves from 80.1 to 79.9, well within the ~1 F1@0.05 that separate runs differ by, and the F1 curves are nearly identical. The model learns two new classes at no measurable cost to chairs, although only 47% of its training data is chairs.
- Cars and planes are easier than chairs. They vary much less within their class: the ground-truth chamfer between two different test shapes is 0.0039 for cars and 0.0053 for planes, against 0.0201 for chairs. Chairs also have thin legs and holes.
- The chair-only model cannot leave its class. It scores 68 on cars and planes, and only that high because a chair-sized cloud still overlaps part of a car body or fuselage at a 0.05 threshold.
Qualitative comparison

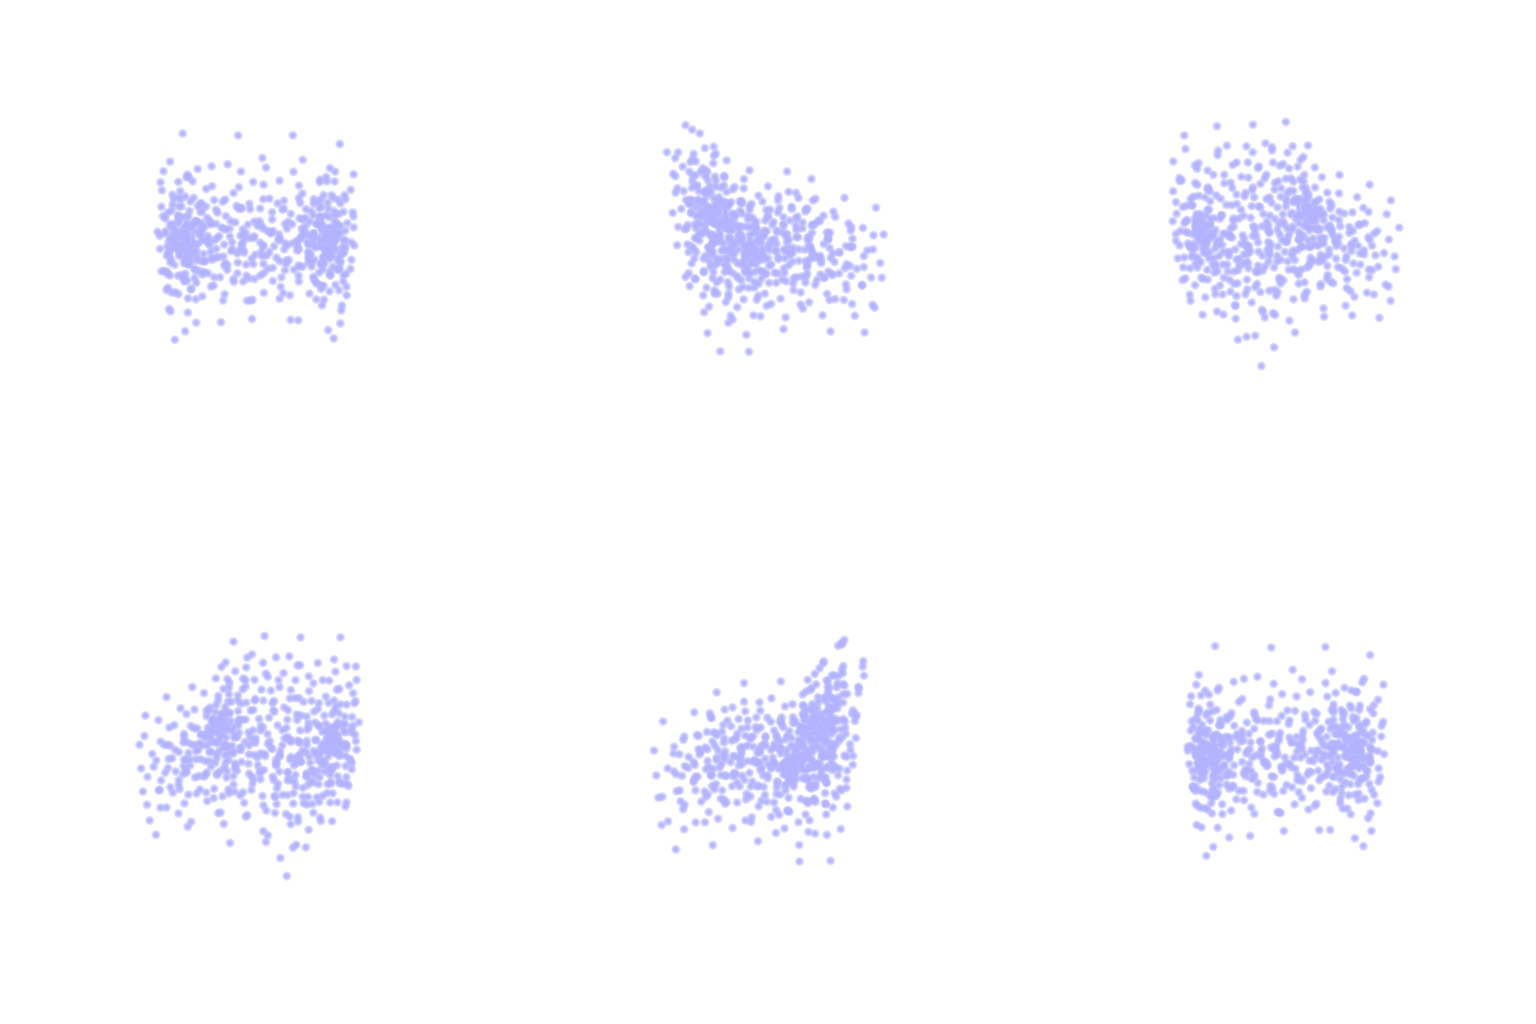
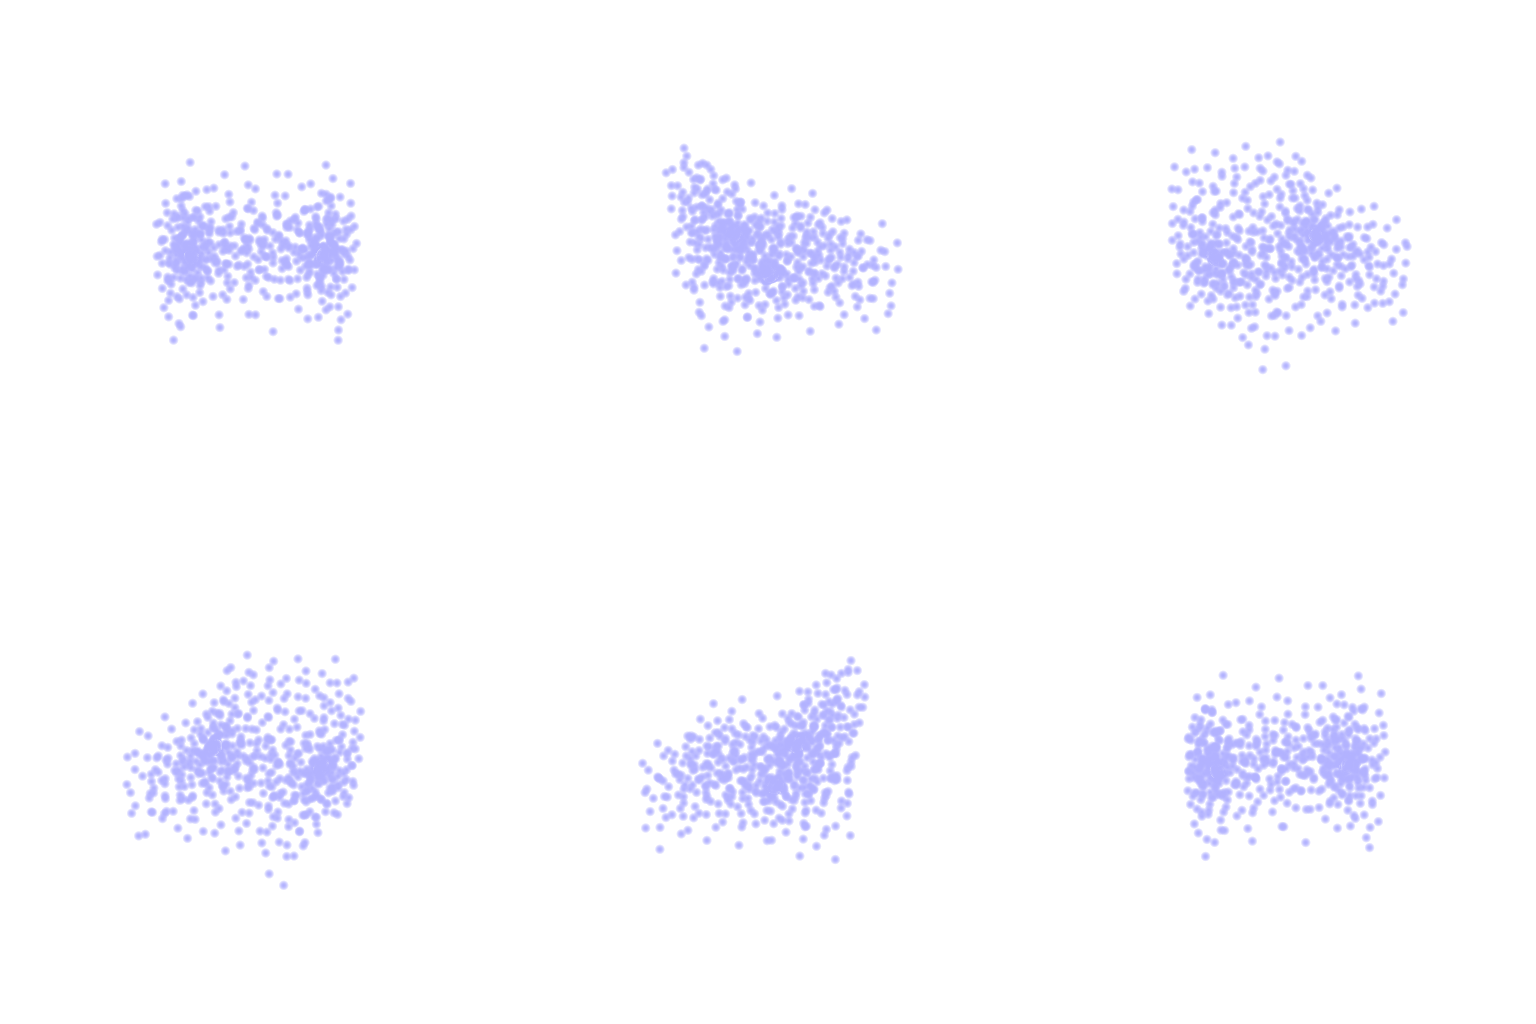


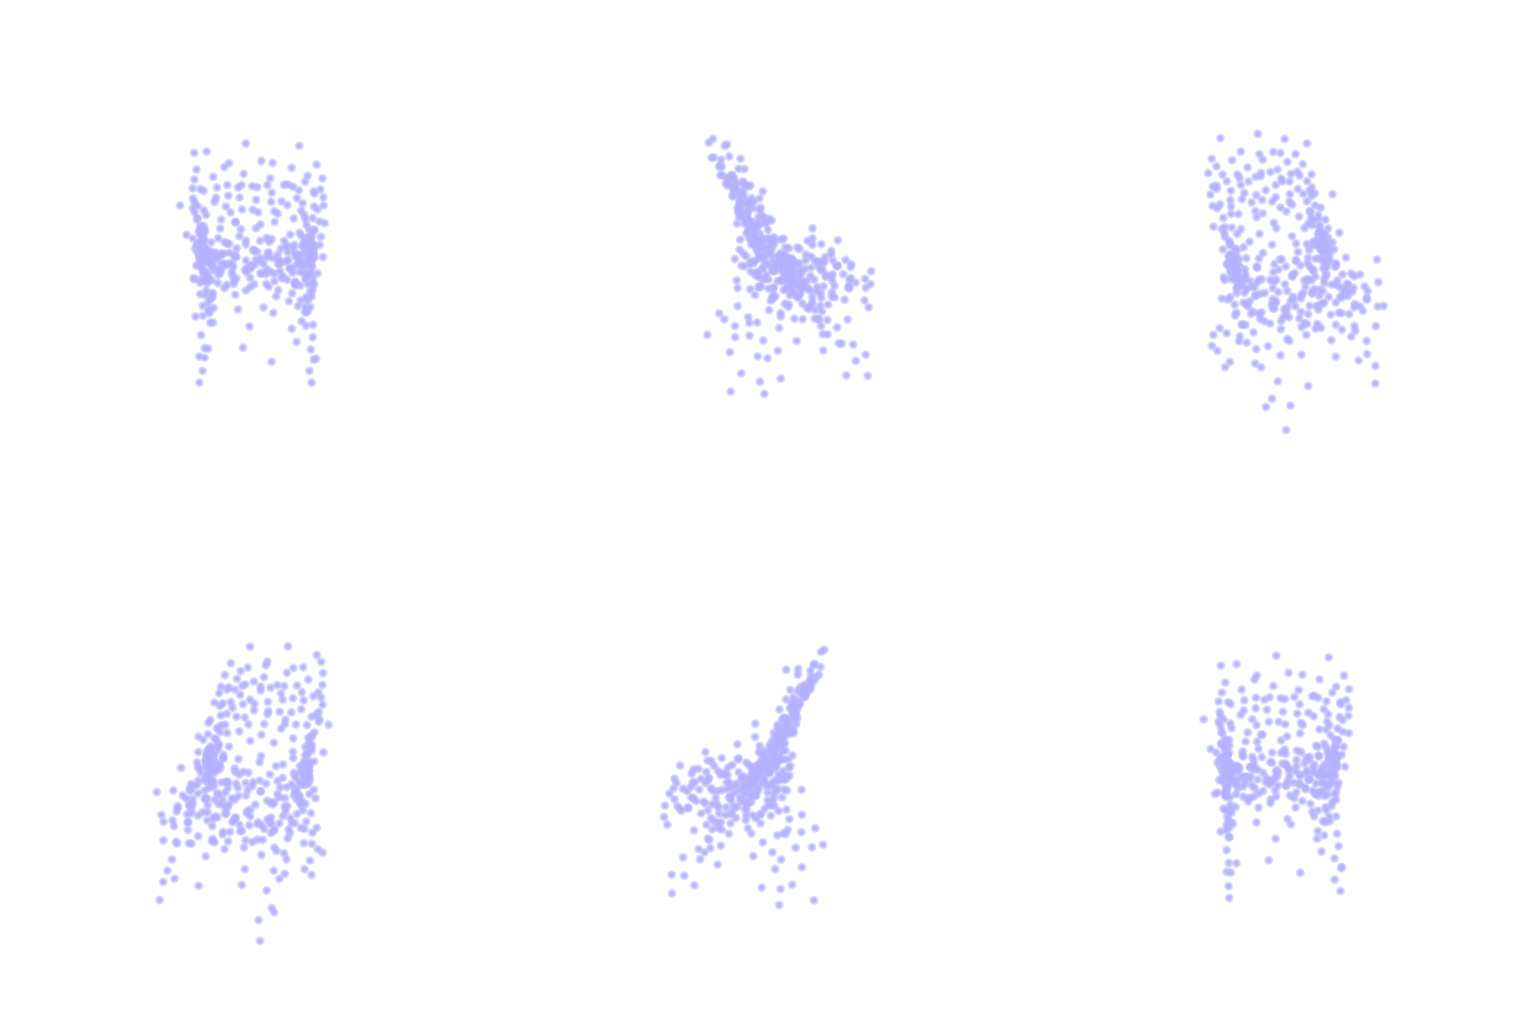
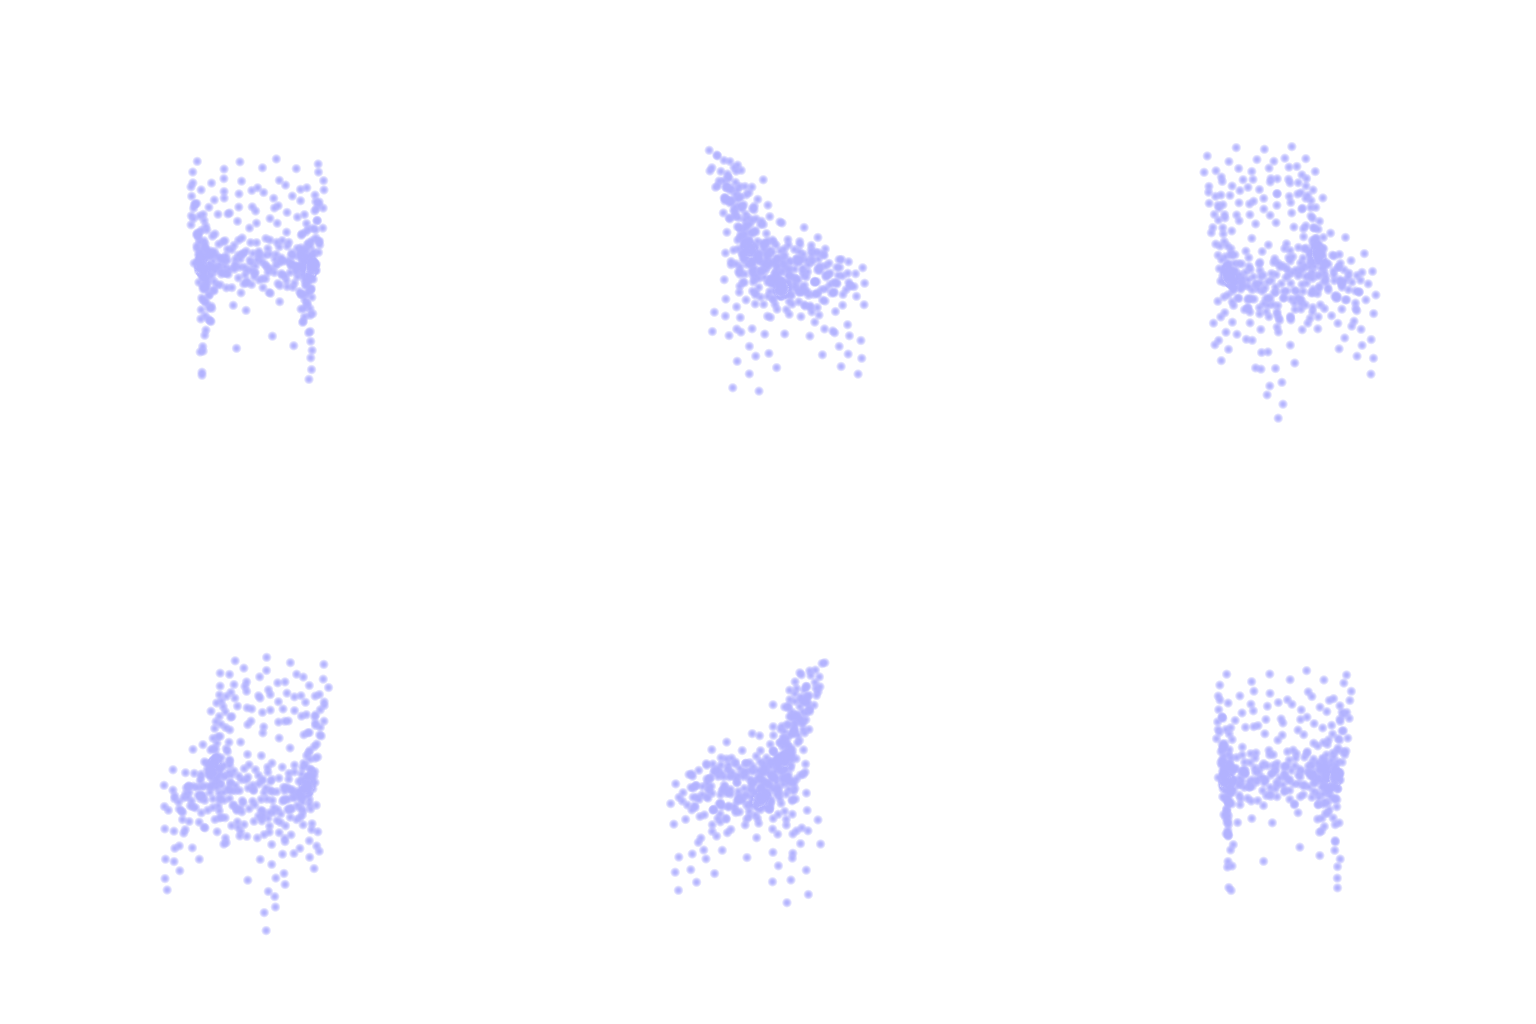


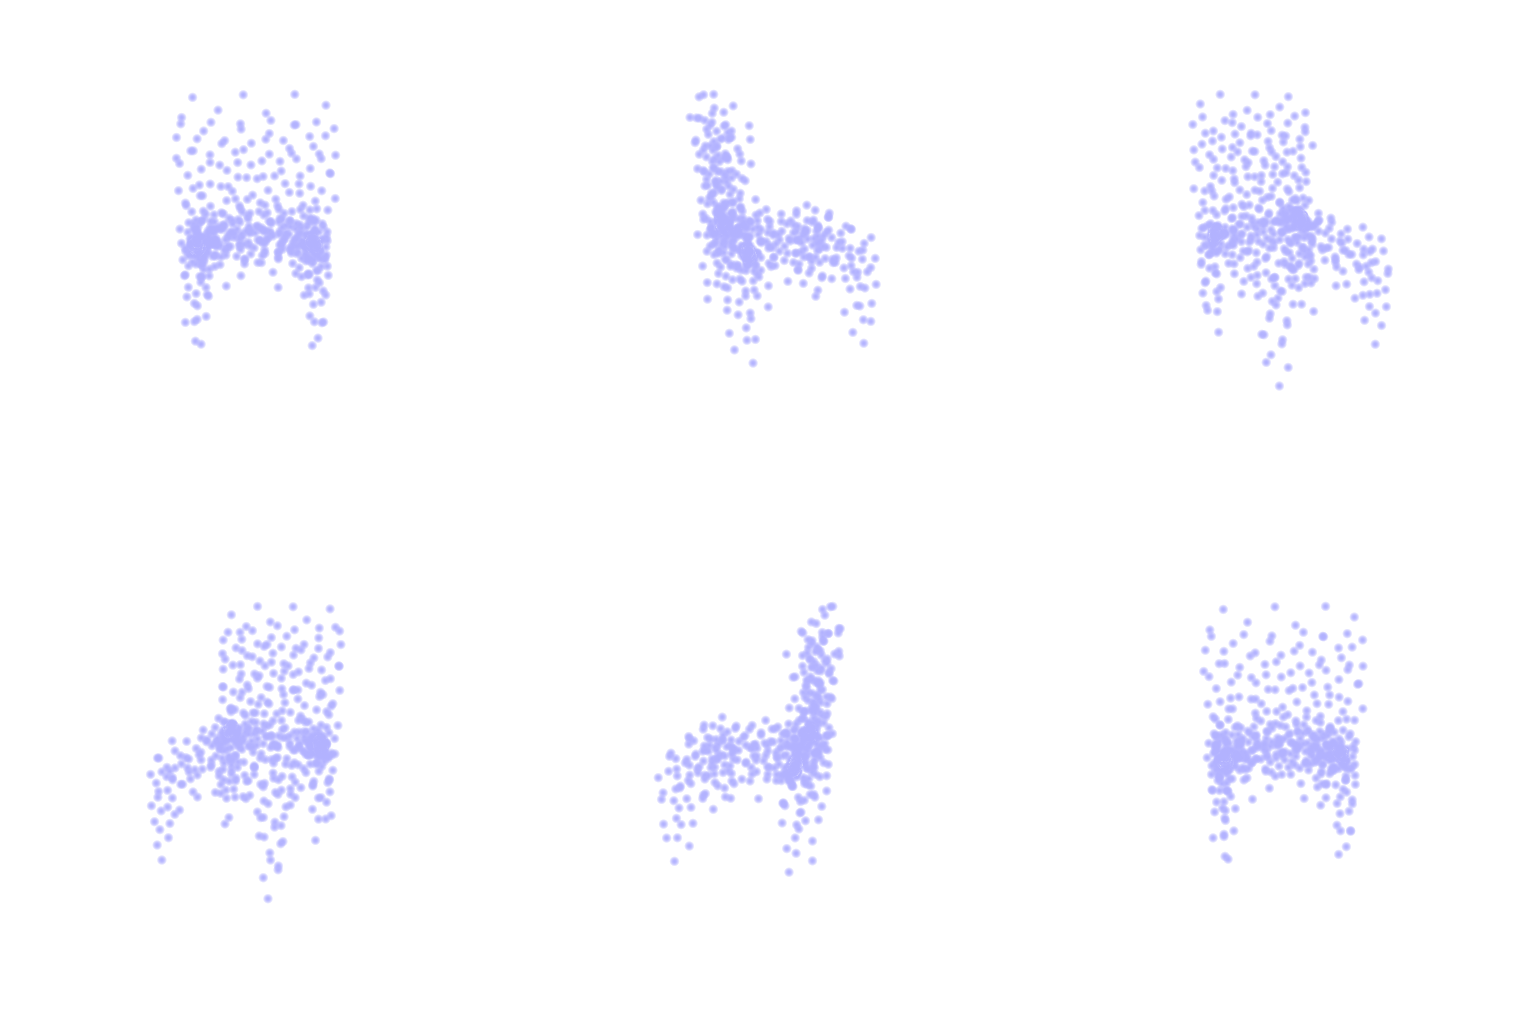
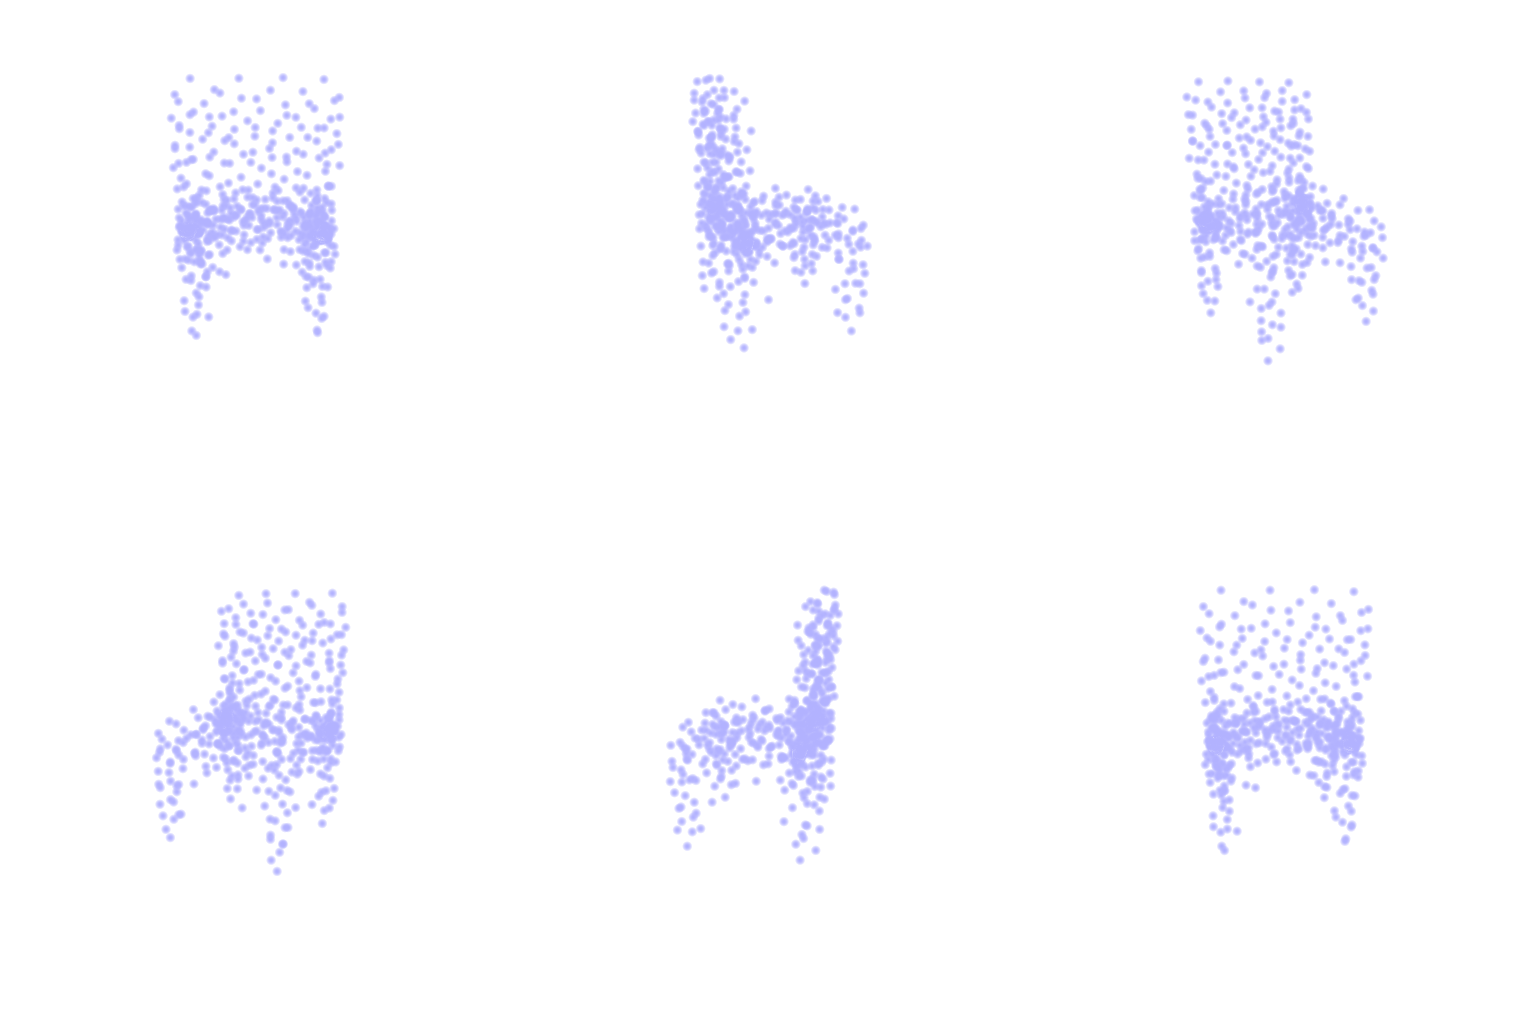

Q2's three test chairs. Views are drawn with a fixed seed over the 3-class test set, so they can differ from the Q2 views.
The two models predict almost the same shapes (the armchair's box, the folding chair's slanted back and seat with a thin spread of leg points). The 3-class model gives slightly sharper tall backs, as in the third chair.
3D consistency and diversity
Measured as in 2.5, on 50 test shapes per class seen from views 0, 3, 6 and 9: the mean
chamfer_loss between predictions of the same shape from different views
(consistency, lower is better), between predictions of different shapes from the same view
(diversity), and between the ground truths of different shapes.
| Class | Model | Same shape, other view | Other shape, same view | GT of other shapes | Diversity / consistency |
|---|---|---|---|---|---|
| Chair | trained on chairs | 1.36 | 4.44 | 20.20 | 3.3× |
| trained on 3 classes | 1.26 | 5.27 | 20.07 | 4.2× | |
| Car | trained on chairs | 2.25 | 2.67 | 3.90 | 1.2× |
| trained on 3 classes | 0.50 | 0.92 | 3.86 | 1.8× | |
| Plane | trained on chairs | 1.59 | 2.31 | 5.32 | 1.4× |
| trained on 3 classes | 0.23 | 0.67 | 5.35 | 2.9× |
Mean chamfer_loss ×10−3.
- Chairs become more diverse and slightly more consistent. Predictions of different chairs are 19% further apart (4.44 to 5.27), covering 26% of the true spread instead of 22%, while the same chair from different views moves 7% less. Both models still collapse toward a mean chair, but learning to tell very different shapes apart seems to give features that also separate chairs better. The longer training (30k vs. 10k steps, which overfit on chairs alone) likely helps too.
- F1@0.05 does not see this. The extra diversity is at the scale of whole-shape differences (backs, arms), while F1@0.05 is decided by local errors such as the stray and leg-tip points found in 2.5.
- The chair-only model is inconsistent on unseen classes. One car from two views (2.25) differs almost as much as two different cars (2.67): the output follows the camera, not the object. The 3-class model is 4–7× more consistent on cars and planes. Its diversity is still well below the ground truth, so it predicts a fairly generic car and plane, which is enough for a high F1@0.05 because these classes are so uniform.
One network can cover three classes without hurting chair accuracy, and the extra classes make its chair predictions a little more varied and more view-invariant. A decoder trained on one class can only produce that class, whatever the input. This supports the choice in 3D-R2N2 [8] to train one network on all 13 classes.
References
- [8] 3D-R2N2: A Unified Approach for Single and Multi-view 3D Object Reconstruction.
Predicts a 32³ voxel grid from one or more views with a 3D convolutional LSTM, trained as one network on 13 ShapeNet classes. Used here: its renderings, voxels and splits are the dataset of this assignment. - [9] ShapeNet: An Information-Rich 3D Model Repository.
A large repository of 3D CAD models organized by category. Used here: the ground-truth meshes of chairs (03001627), cars (02958343) and planes (02691156).