
Author: Xinyi Li
Andrew ID: xinyil4
Using the provided assignment framework, I completed the required TODOs for multi-view preprocessing, Mini-LVSM, and Mini-VGGT. I used the supplied ScanNet++ iPhone dataset: 224 training scenes, 28 validation scenes, and 28 test scenes. Images were resized to 224 × 224. In addition to the required experiments, I compared LVSM patch sizes and evaluated VGGT with different numbers of input views.
The numerical results below come from saved experiment logs. All four held-out qualitative examples are validation scenes.
I completed the provided TODOs for resizing camera intrinsics and converting depth pixels into 3D points. The checks covered the half-pixel correction during resizing and transformation from camera coordinates to world coordinates.
I completed the canonicalization and ray-generation functions using the assignment's coordinate conventions. Canonicalization places the first camera at the origin and applies the same scale to camera translations, depths, and points. In the checks, camera 0 became the identity and the valid-point centroid was approximately one unit from the origin.
World-space ray directions describe where each pixel points after accounting for camera rotation. The Plücker moment describes the ray's spatial offset. These features were passed to LVSM as camera conditioning.
The room appeared tilted in the viewer. Canonicalization uses the first camera's orientation rather than aligning the scene to gravity, so this appearance alone does not indicate an error.
I ran check_data.py on four training samples. Both point and ray reprojection errors were below 0.00012 pixels, comfortably below the 0.01-pixel check threshold. The centroid distance was approximately 1 for all samples.
| Training sample | Valid depth fraction | Point reprojection (px) | Ray reprojection (px) | Centroid distance |
|---|---|---|---|---|
| e050c15a8d_frame_007080 | 0.9779 | 0.000111 | 0.000097 | 1.0000000 |
| 5f99900f09_frame_002820 | 0.9903 | 0.000111 | 0.000108 | 0.9999999 |
| 47b37eb6f9_frame_002720 | 0.9610 | 0.000109 | 0.000082 | 1.0000000 |
| 4c5c60fa76_frame_006690 | 0.7517 | 0.000100 | 0.000095 | 1.0000000 |
The batch contained two samples and eight views per sample. RGB and world-space point/ray tensors had shape (2, 8, 3, 224, 224); depth had shape (2, 8, 1, 224, 224); Plücker features had shape (2, 8, 6, 224, 224).
json
{
  "split": "train",
  "dataset_samples": 224,
  "checked_samples": 4,
  "samples": [
    {
      "sequence_name": "e050c15a8d_frame_007080",
      "views": 8,
      "resolution": 224,
      "valid_depth_fraction": 0.9779127240180969,
      "max_reprojection_error_px": 0.00011108566104667261,
      "max_ray_reprojection_error_px": 9.650505671743304e-05,
      "centroid_distance": 1.0
    },
    {
      "sequence_name": "5f99900f09_frame_002820",
      "views": 8,
      "resolution": 224,
      "valid_depth_fraction": 0.9903116226196289,
      "max_reprojection_error_px": 0.00011108566104667261,
      "max_ray_reprojection_error_px": 0.0001078959321603179,
      "centroid_distance": 0.9999999403953552
    },
    {
      "sequence_name": "47b37eb6f9_frame_002720",
      "views": 8,
      "resolution": 224,
      "valid_depth_fraction": 0.9609947800636292,
      "max_reprojection_error_px": 0.00010850114631466568,
      "max_ray_reprojection_error_px": 8.217109279939905e-05,
      "centroid_distance": 1.0
    },
    {
      "sequence_name": "4c5c60fa76_frame_006690",
      "views": 8,
      "resolution": 224,
      "valid_depth_fraction": 0.7516716122627258,
      "max_reprojection_error_px": 9.974106797017157e-05,
      "max_ray_reprojection_error_px": 9.53696362557821e-05,
      "centroid_distance": 1.0
    }
  ],
  "batch_shapes": {
    "rgb": [
      2,
      8,
      3,
      224,
      224
    ],
    "depth": [
      2,
      8,
      1,
      224,
      224
    ],
    "depth_valid": [
      2,
      8,
      1,
      224,
      224
    ],
    "K": [
      2,
      8,
      3,
      3
    ],
    "frame_numbers": [
      2,
      8
    ],
    "T_world_from_camera": [
      2,
      8,
      4,
      4
    ],
    "original_world_from_reference": [
      2,
      4,
      4
    ],
    "scene_scale": [
      2
    ],
    "points_world": [
      2,
      8,
      3,
      224,
      224
    ],
    "ray_origins": [
      2,
      8,
      3,
      224,
      224
    ],
    "ray_directions": [
      2,
      8,
      3,
      224,
      224
    ],
    "plucker": [
      2,
      8,
      6,
      224,
      224
    ]
  }
}
Scene 036bce3393_frame_004470: unprojected points and eight sampled camera poses in the original world frame, with axes in meters.

Before canonicalization, the first camera center is (3.3463, 4.6765, 1.4680) m and the valid-point centroid distance is 6.668 m.

The same scene and sampled frames after canonicalization, with axes in normalized units. The RGB view remains unchanged.

After canonicalization, the first camera center is approximately (0, 0, 0) in normalized units, and the valid-point centroid distance is 1.000. The scene scale is 1.867 m. The displayed −0.0000 is numerical rounding at zero.
Within the provided Mini-LVSM framework, I completed patchify/unpatchify, token assembly, the forward pass, MSE loss, and the training-step TODOs. I checked that patchify/unpatchify reconstructed the input exactly and that gradients propagated through the model before starting training.
The fixed-batch overfit experiment ran for 2,000 updates and reached 30.84 dB PSNR, 0.8685 SSIM, and 0.000880 MSE. This exceeded the approximate 30 dB sanity-check target.

The baseline used patch size 8, width 384, eight transformer layers, head dimension 64, MLP ratio 4, and QK normalization (14.63M parameters). It used two source views and six target views from each eight-view sample.
I trained for 100 epochs with batch size 4, AdamW, learning rate 0.0002, weight decay 0.05, betas (0.9, 0.95), 200 warmup steps, cosine decay, gradient clipping at 1.0, and bfloat16 autocast for training. The seed was 825. Validation used fixed views from the first 32 prepared frames. Baseline training ran on an NVIDIA L4; the best checkpoint was selected by validation PSNR.


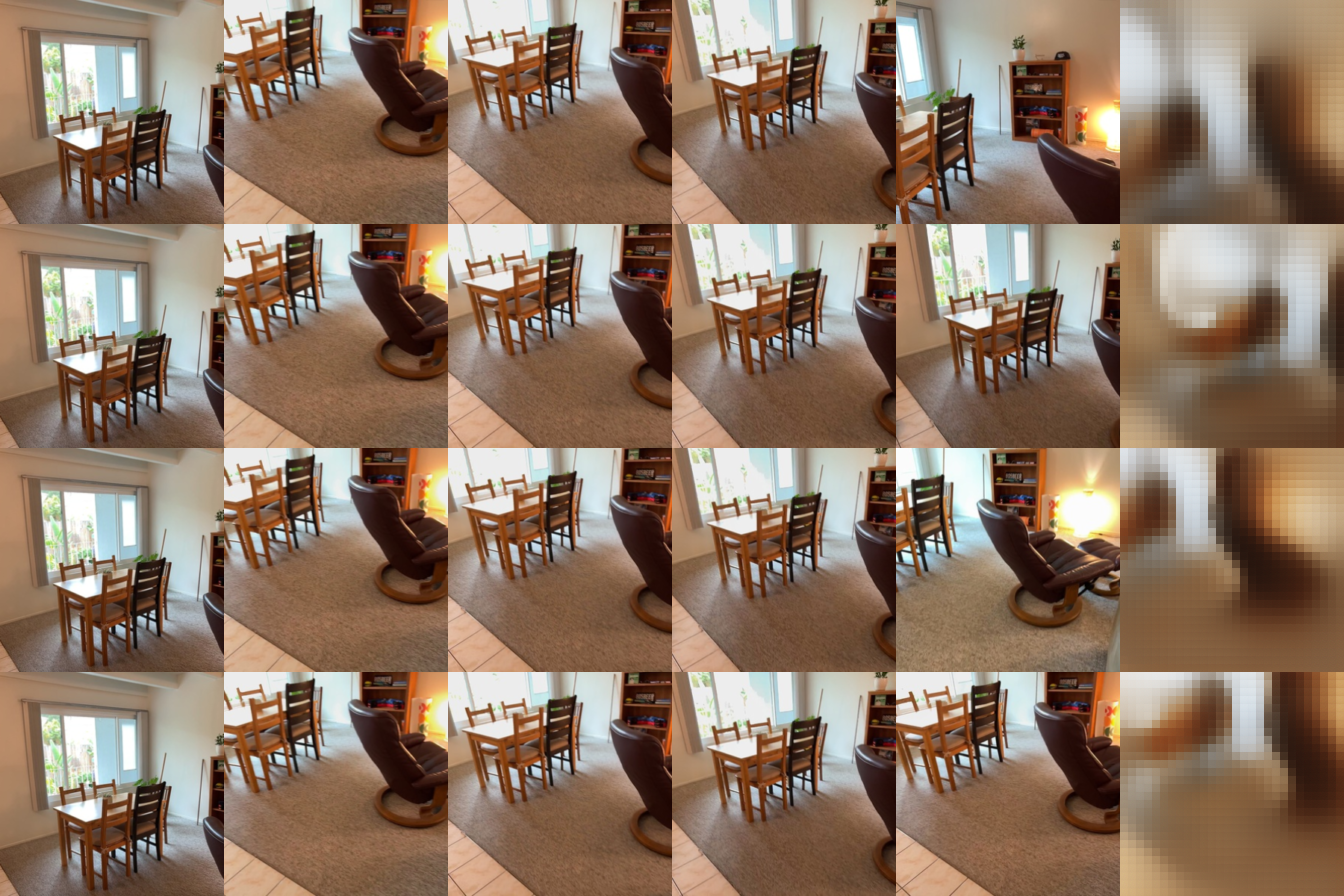
The image above is the saved epoch-95 visualization (zero-based epoch index), rather than an image generated from the best checkpoint. The evaluation images below use best.pt.
| Source views | Target-ray conditioning | PSNR ↑ | SSIM ↑ |
|---|---|---|---|
| 1 | correct | 15.1827 | 0.5579 |
| 1 | shuffled | 11.8120 | 0.4875 |
| 1 | none | 12.4727 | 0.5315 |
| 2 | correct | 16.1354 | 0.5605 |
| 2 | shuffled | 11.4951 | 0.4723 |
| 2 | none | 12.4482 | 0.5289 |
| 4 | correct | 16.8616 | 0.5753 |
| 4 | shuffled | 11.5976 | 0.4734 |
| 4 | none | 12.4672 | 0.5379 |
With correct rays, increasing source views from one to four increased PSNR from 15.18 to 16.86 dB and SSIM from 0.5579 to 0.5753. Additional observations can provide more appearance and visibility information. However, these evaluations use all remaining views as targets, so changing the source count also changes the target set and the number of evaluated images (196, 168, and 112). This is not a strictly fixed-target comparison.
At two source views, shuffling target rays reduced PSNR from 16.14 to 11.50 dB. Removing target rays reduced it to 12.45 dB. This supports the importance of correct camera conditioning: source appearance alone is insufficient to identify which target view to render. Shuffled rays specify an incorrect viewpoint, whereas zero rays remove that information; both substantially hurt the metrics.



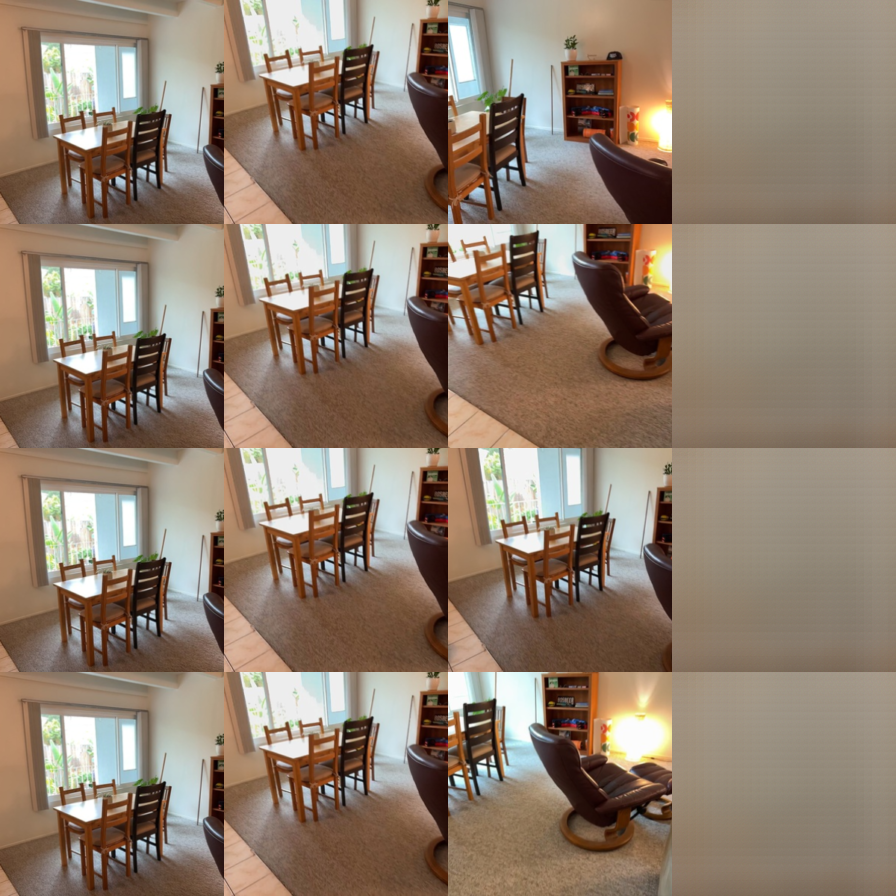
Question. How does increasing the patch size from 8 to 16 change synthesis quality, runtime, and memory?
I kept the data settings, source count, transformer width/depth, optimizer, and 100-epoch schedule unchanged. Patch size 16 reduces tokens per view from 784 to 196, and sequence length per target from 2,352 to 588 for two sources. Its input/output projections are larger, so total parameter count increases despite fewer tokens.
| Patch size | Tokens / view | Parameters | PSNR ↑ (S=2) | SSIM ↑ (S=2) | Train step (s) | Train peak memory (MiB) |
|---|---|---|---|---|---|---|
| 8 | 784 | 14633408 | 16.1354 | 0.5605 | 0.3452 | 9228.2 |
| 16 | 196 | 15961088 | 15.8657 | 0.5533 | 0.0763 | 2687.7 |

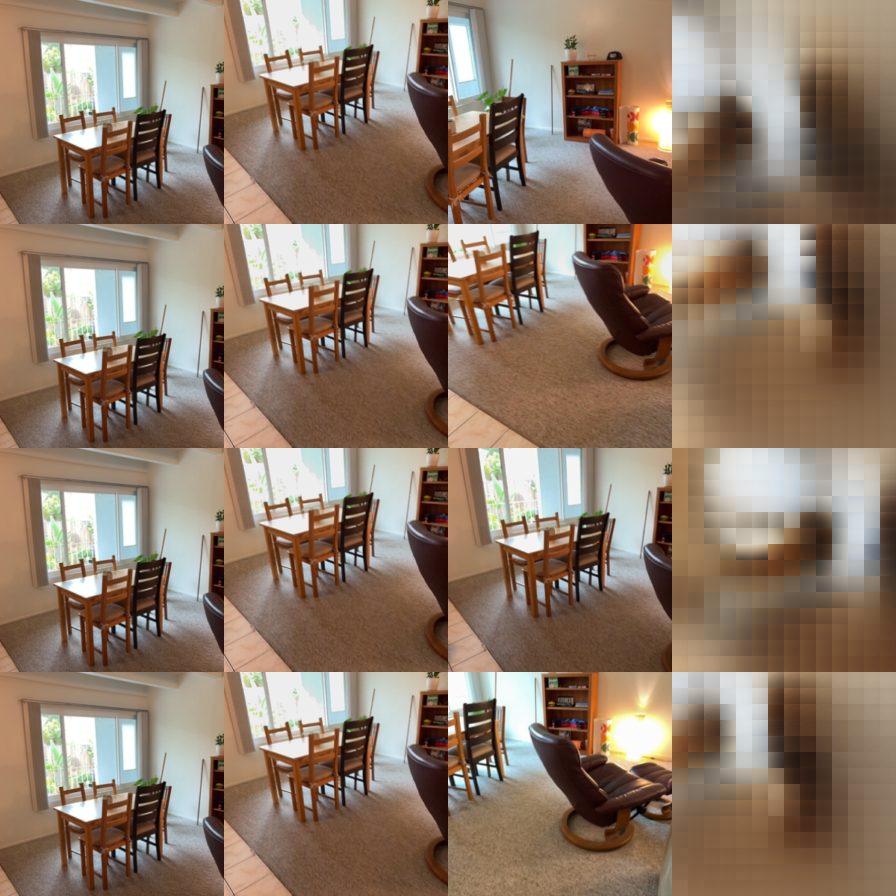
For the same two-source validation setting, patch16 lost approximately 0.27 dB PSNR and 0.0072 SSIM. On the same A10G GPU, its measured training step was approximately 4.5× faster, with 71% lower peak allocated memory. This suggests a useful efficiency–quality tradeoff: fewer tokens substantially reduce computation, while coarser spatial tokenization may make fine-detail prediction harder. The latter is an interpretation, rather than a separately isolated mechanism.
Measurement and limitations. Runtime and memory were measured on one A10G with batch size 4, two sources, six targets, and 224px inputs. I used three warmup steps and ten timed steps, synchronized CUDA, and excluded data loading. Training used bfloat16 autocast. These are model/optimizer step measurements, not end-to-end epoch timings. Baseline quality training used an L4 and patch16 used an A10G; the efficiency benchmark used the same A10G for both. There was one training run per setting, so small quality differences should not be treated as statistically established. Projection parameter counts and random initialization also change with patch size.
Within the provided Mini-VGGT framework, I completed the aggregation, camera-head, depth-head, and loss-function TODOs. I checked output shapes, gradients, and a complete training step before the overfit experiment. I used the provided architecture with a frozen DINOv2 ViT-B/14 encoder, eight frame/global transformer pairs, width 384, and six attention heads.
The overfit run used one fixed training clip for 40 epochs × 25 steps (1,000 updates). Its final evaluation reached AbsRel 0.0368, δ1 0.9552, mean relative rotation error 0.207°, and translation-direction error 0.500°.

The final total loss was -0.1614. A negative value is possible because the confidence-weighted depth objective includes a negative log-confidence term; it is not a negative pixel reconstruction error.
Scene 036bce3393_frame_004470, ground truth:

Predicted camera poses and depth for the same scene:

The prediction preserves the overall scene layout and camera arrangement. The predicted depth is smoother than GT, with less sharply defined chair boundaries and fine structures. The point cloud retains the main surfaces but shows some local spreading around their edges. This is a single training-scene fit, so it does not establish generalization to unseen scenes.


The displayed first camera center is approximately (0, 0, 0) for GT and (0.0002, −0.0002, 0.0001) for the prediction. The valid-point centroid distances are 1.000 and 1.001, respectively, in normalized units. Both displays use the same scene scale of 1.867 m.
I trained on all 224 training scenes for 1,000 epochs, using eight views, sampling range 32, 224px images, batch size 4, and two data-loader workers on one NVIDIA L4. The run used bfloat16 precision, learning rate 0.0006, weight decay 0.01, ten warmup epochs, and minimum learning-rate ratio 0.05. I used the configured camera-loss weight of 5 and depth-loss weight of 1. The checkpoint with lowest validation loss was selected.
I evaluated the selected checkpoint on the full validation and test splits, each containing 28 scenes, with eight views from the first 32 prepared frames, image size 224, and seed 825. Each split contains 784 camera pairs. Final standalone evaluation ran on an A10G. Depth metrics use GT-valid pixels; AUC values are on a 0–1 scale.

| Metric | Validation | Test |
|---|---|---|
| Depth AbsRel ↓ | 0.1378 | 0.1568 |
| Depth δ1 ↑ | 0.8379 | 0.7998 |
| Rotation AUC @5° ↑ | 0.1651 | 0.1842 |
| Rotation AUC @15° ↑ | 0.4793 | 0.5168 |
| Rotation AUC @30° ↑ | 0.6809 | 0.7241 |
| Translation AUC @5° ↑ | 0.0130 | 0.0153 |
| Translation AUC @15° ↑ | 0.0642 | 0.0881 |
| Translation AUC @30° ↑ | 0.1696 | 0.2125 |
| Joint pose AUC @5° ↑ | 0.0041 | 0.0026 |
| Joint pose AUC @15° ↑ | 0.0472 | 0.0635 |
| Joint pose AUC @30° ↑ | 0.1485 | 0.1956 |
Depth δ1 was 0.8379 on validation and 0.7998 on test, while AbsRel increased from 0.1378 to 0.1568. This indicates worse depth generalization on the test scenes under these metrics. Rotation AUC was substantially higher than translation-direction AUC on both splits. Thus relative translation is a more difficult component for this model, and it limits joint-pose AUC even when rotations are reasonably accurate. These aggregate metrics do not establish which particular visual structures cause the errors.
09c1414f1b_frame_000000Ground truth:

Predicted camera poses and depth:

The prediction retains the broad room layout and the cluster of camera positions. In the depth image, the table and chair boundaries are noticeably smoother than GT, and individual chair slats are less distinct. The reconstructed surfaces also appear more spread out around the furniture. The black window regions represent missing depth measurements, so they should not be interpreted as prediction failures. The screenshots have slightly different plot framing, which limits precise visual comparison of camera alignment.


Point-cloud detail (GT on the left, prediction on the right):
| Ground truth | Prediction |
|---|---|
 |
 |
The displayed valid-point centroid distance changes from 1.000 for GT to 0.979 for the prediction. The predicted first camera center is (0.0001, −0.0001, 0.0000), close to the GT origin. Both displays use the same scene scale of 2.655 m. These summary values do not measure the accuracy of all relative camera poses.
21d970d8de_frame_000000| Ground truth | Prediction |
|---|---|
 |
 |
The prediction preserves the broad arrangement of the long upper structures and lower surface. However, the relatively straight upper edges in GT become curved and less sharply separated in the prediction. Several thin structures spread into multiple nearby point layers, indicating imperfect reconstruction of their shape.
280b83fcf3_frame_000000| Ground truth | Prediction |
|---|---|
 |
 |
This scene shows a pronounced loss of geometric detail. The distinct brown frame-like structure and the separated light-blue surface in GT become a thicker, more rounded cluster in the prediction. Gaps between structures are less clearly preserved, and the reconstructed spatial extent differs from GT.
2b1dc6d6a5_frame_000000| Ground truth | Prediction |
|---|---|
 |
 |
The large white foreground surface remains recognizable, but the prediction contains thicker, overlapping layers around it and the structures behind it. The camera frustums also have a visibly different relative arrangement, especially near the left cluster. Since plot framing differs slightly, the screenshots support a qualitative comparison rather than a numerical pose-error estimate.
Question. Does supplying more input views improve the geometry predicted for the same target views?
I reused the trained eight-view checkpoint without retraining. For each of 28 validation scenes, I selected one fixed ordered set of eight views and evaluated nested prefixes of 2, 4, and 8 inputs. All settings used the same ground-truth scale computed from the eight-view sample. I evaluated depth and pose only for the first two shared views, ensuring identical valid pixels (2,588,890) and pose pairs (28) across settings.
| Input views | AbsRel ↓ | δ1 ↑ | Rotation AUC @30° | Translation AUC @30° | Joint AUC @30° | Forward (ms) | Peak memory (MiB) |
|---|---|---|---|---|---|---|---|
| 2 | 0.1770 | 0.6899 | 0.6631 | 0.2369 | 0.2155 | 39.08 | 708.7 |
| 4 | 0.1563 | 0.7780 | 0.6405 | 0.2548 | 0.2274 | 38.89 | 727.8 |
| 8 | 0.1284 | 0.8629 | 0.7071 | 0.2190 | 0.2071 | 38.72 | 771.0 |

Increasing inputs from two to eight reduced AbsRel from 0.1770 to 0.1284 (about 27.5%) and increased δ1 from 0.6899 to 0.8629. This supports the value of additional context for depth prediction. Pose results were not monotonic: four inputs had the highest translation and joint-pose AUC @30°, whereas eight inputs had the highest rotation AUC @30°. More input views therefore did not improve every output equally.
Measured forward latency was approximately 39 ms in all three settings, while peak allocated memory increased from 708.7 to 771.0 MiB. I would not interpret the tiny latency differences as a speed advantage for eight views: this short measurement includes input transfer, excludes loading and metrics, and does not include repeated-run uncertainty estimates. Accuracy is evaluated on only one common camera pair per scene, making pose results sensitive to that selection. The model was trained with eight views, so reduced-view settings also differ from its training input count.
These extra depth metrics are not directly comparable to the main evaluation table, which evaluates all eight output views instead of only the common first two.
The geometry checks verified consistent intrinsics, coordinate transforms, rays, and normalization. LVSM learned to memorize a fixed batch and generalized better with correct target-ray conditioning. Larger patches offered substantial compute and memory savings at a modest quality cost in this run. VGGT fit a fixed scene well, but held-out pose estimation—especially translation direction—remained challenging. Additional input views improved common-view depth accuracy, without uniformly improving pose metrics.