I optimized voxel logits using binary cross-entropy with logits.
I implemented symmetric squared Chamfer distance using knn_points, averaging nearest-neighbor distances in both directions.

I optimized mesh vertex offsets using Chamfer loss and uniform Laplacian smoothing, with smoothing weight 0.1.

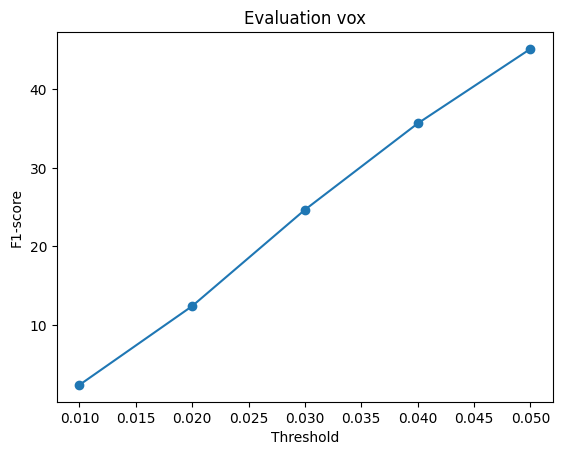
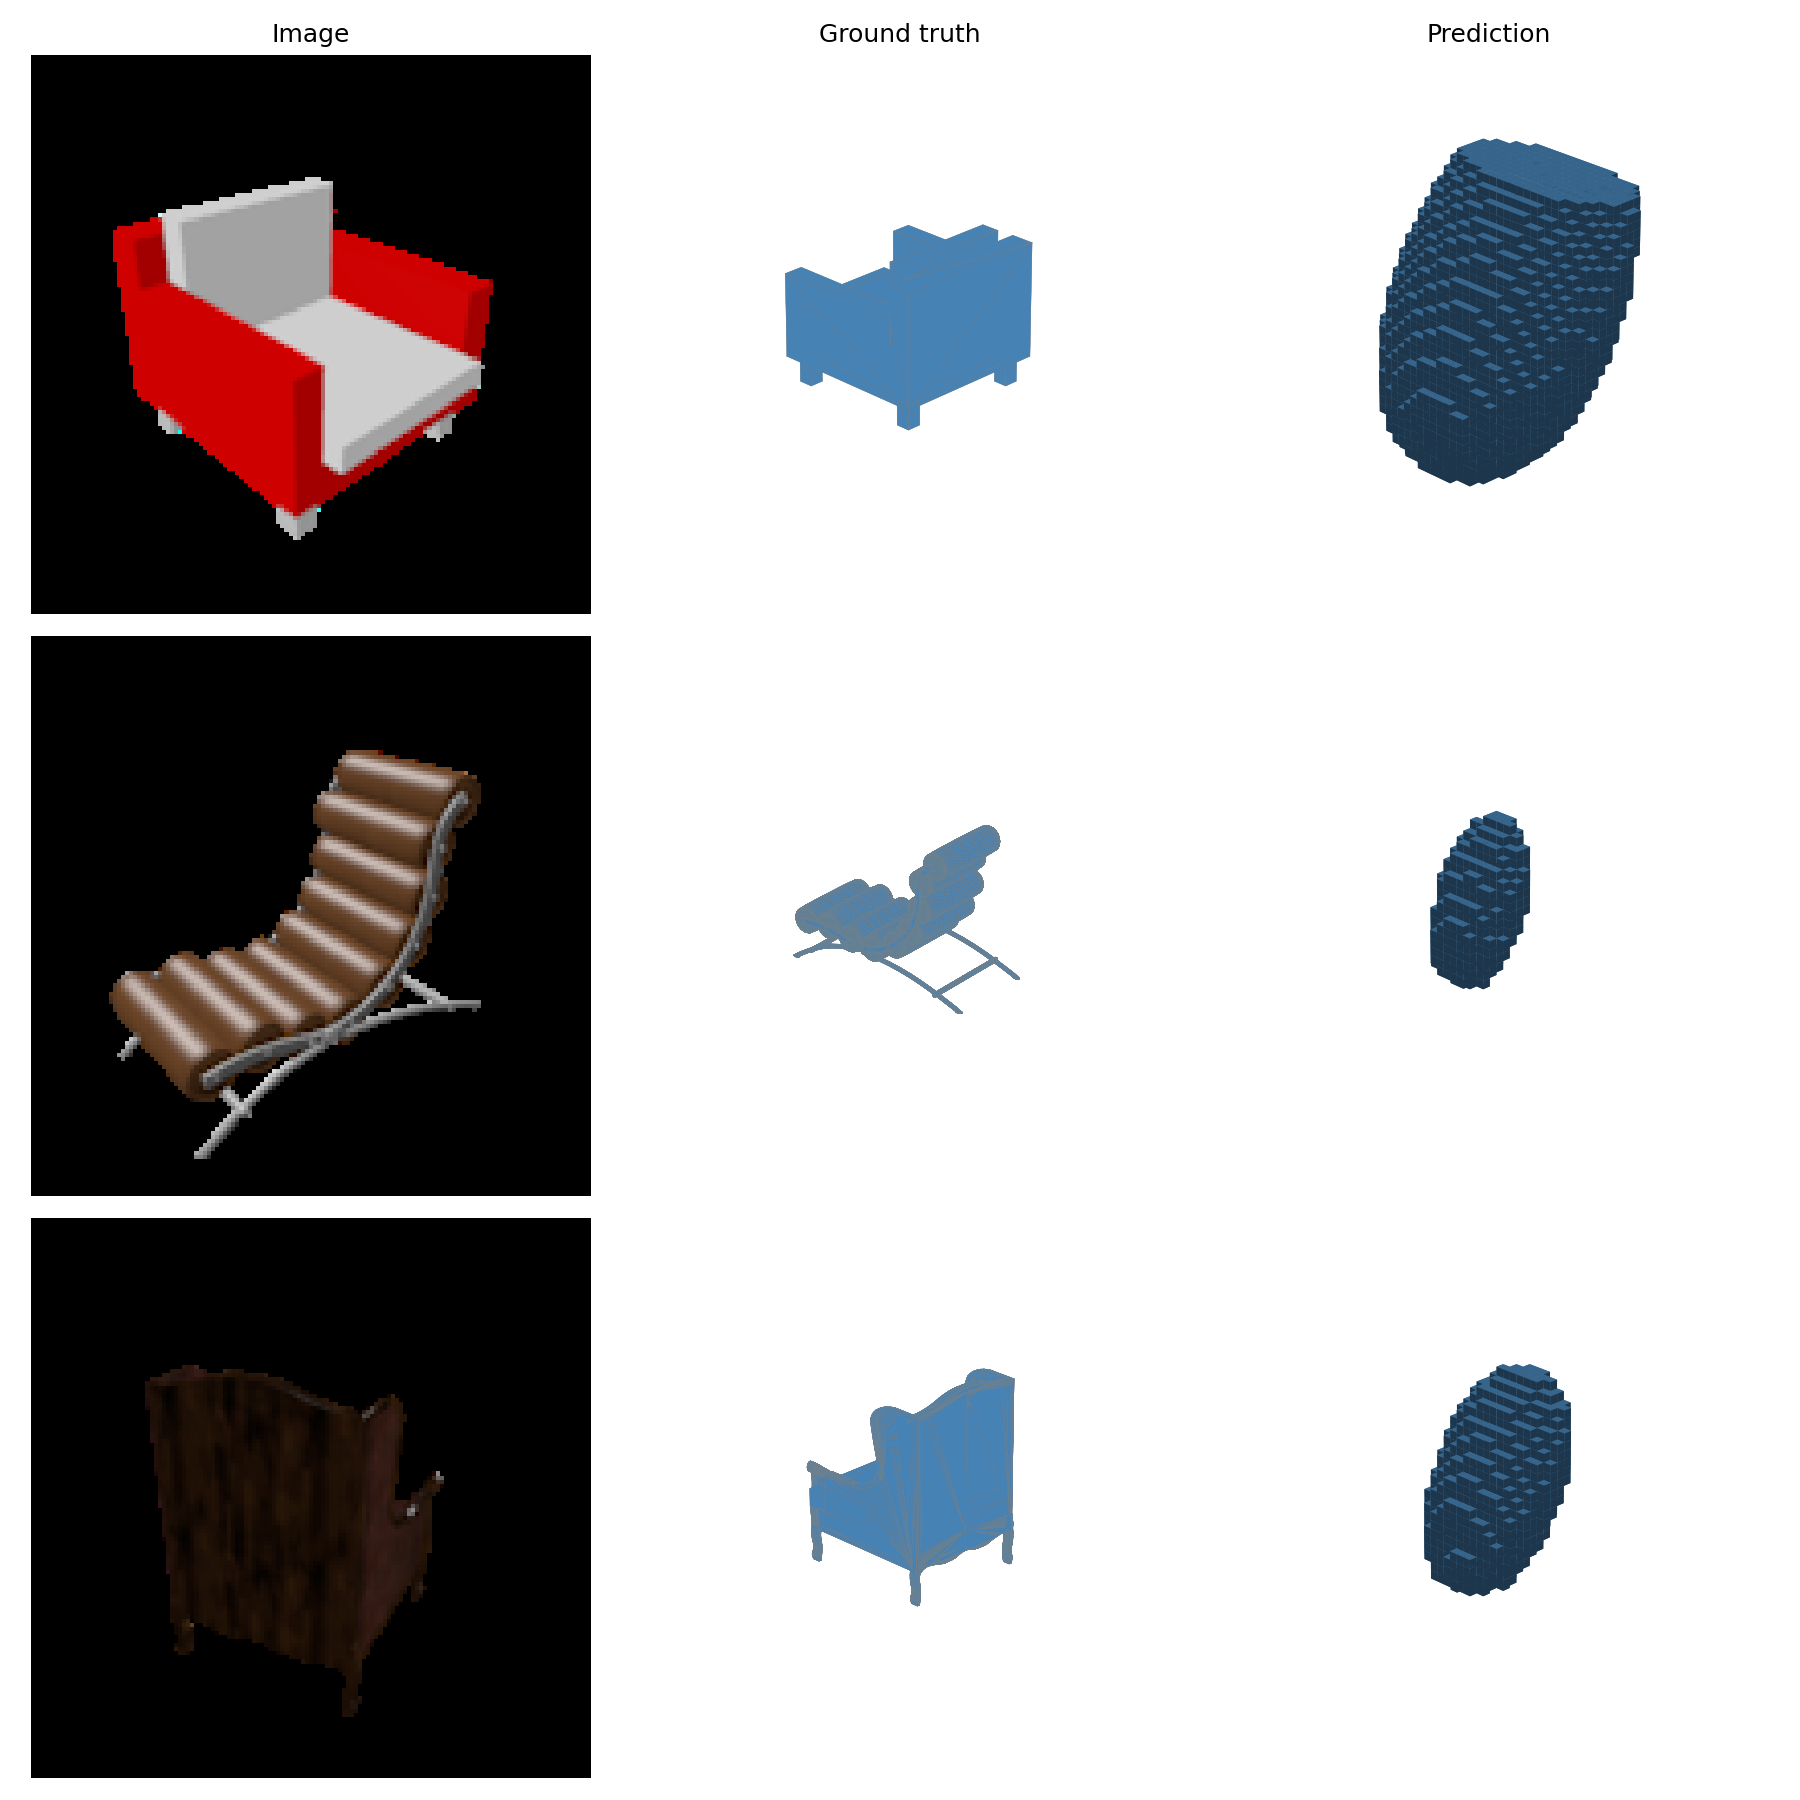
The decoder uses 512 → 1024 → 32768 fully connected layers and outputs a 32³ voxel grid. Training uses weighted BCE with positive-class weight 2. The model was trained for 8,000 steps; validation IoU on 128 held-out training objects selected the 6,000-step checkpoint. The occupancy threshold is 0.5.
F1@0.05: 45.110
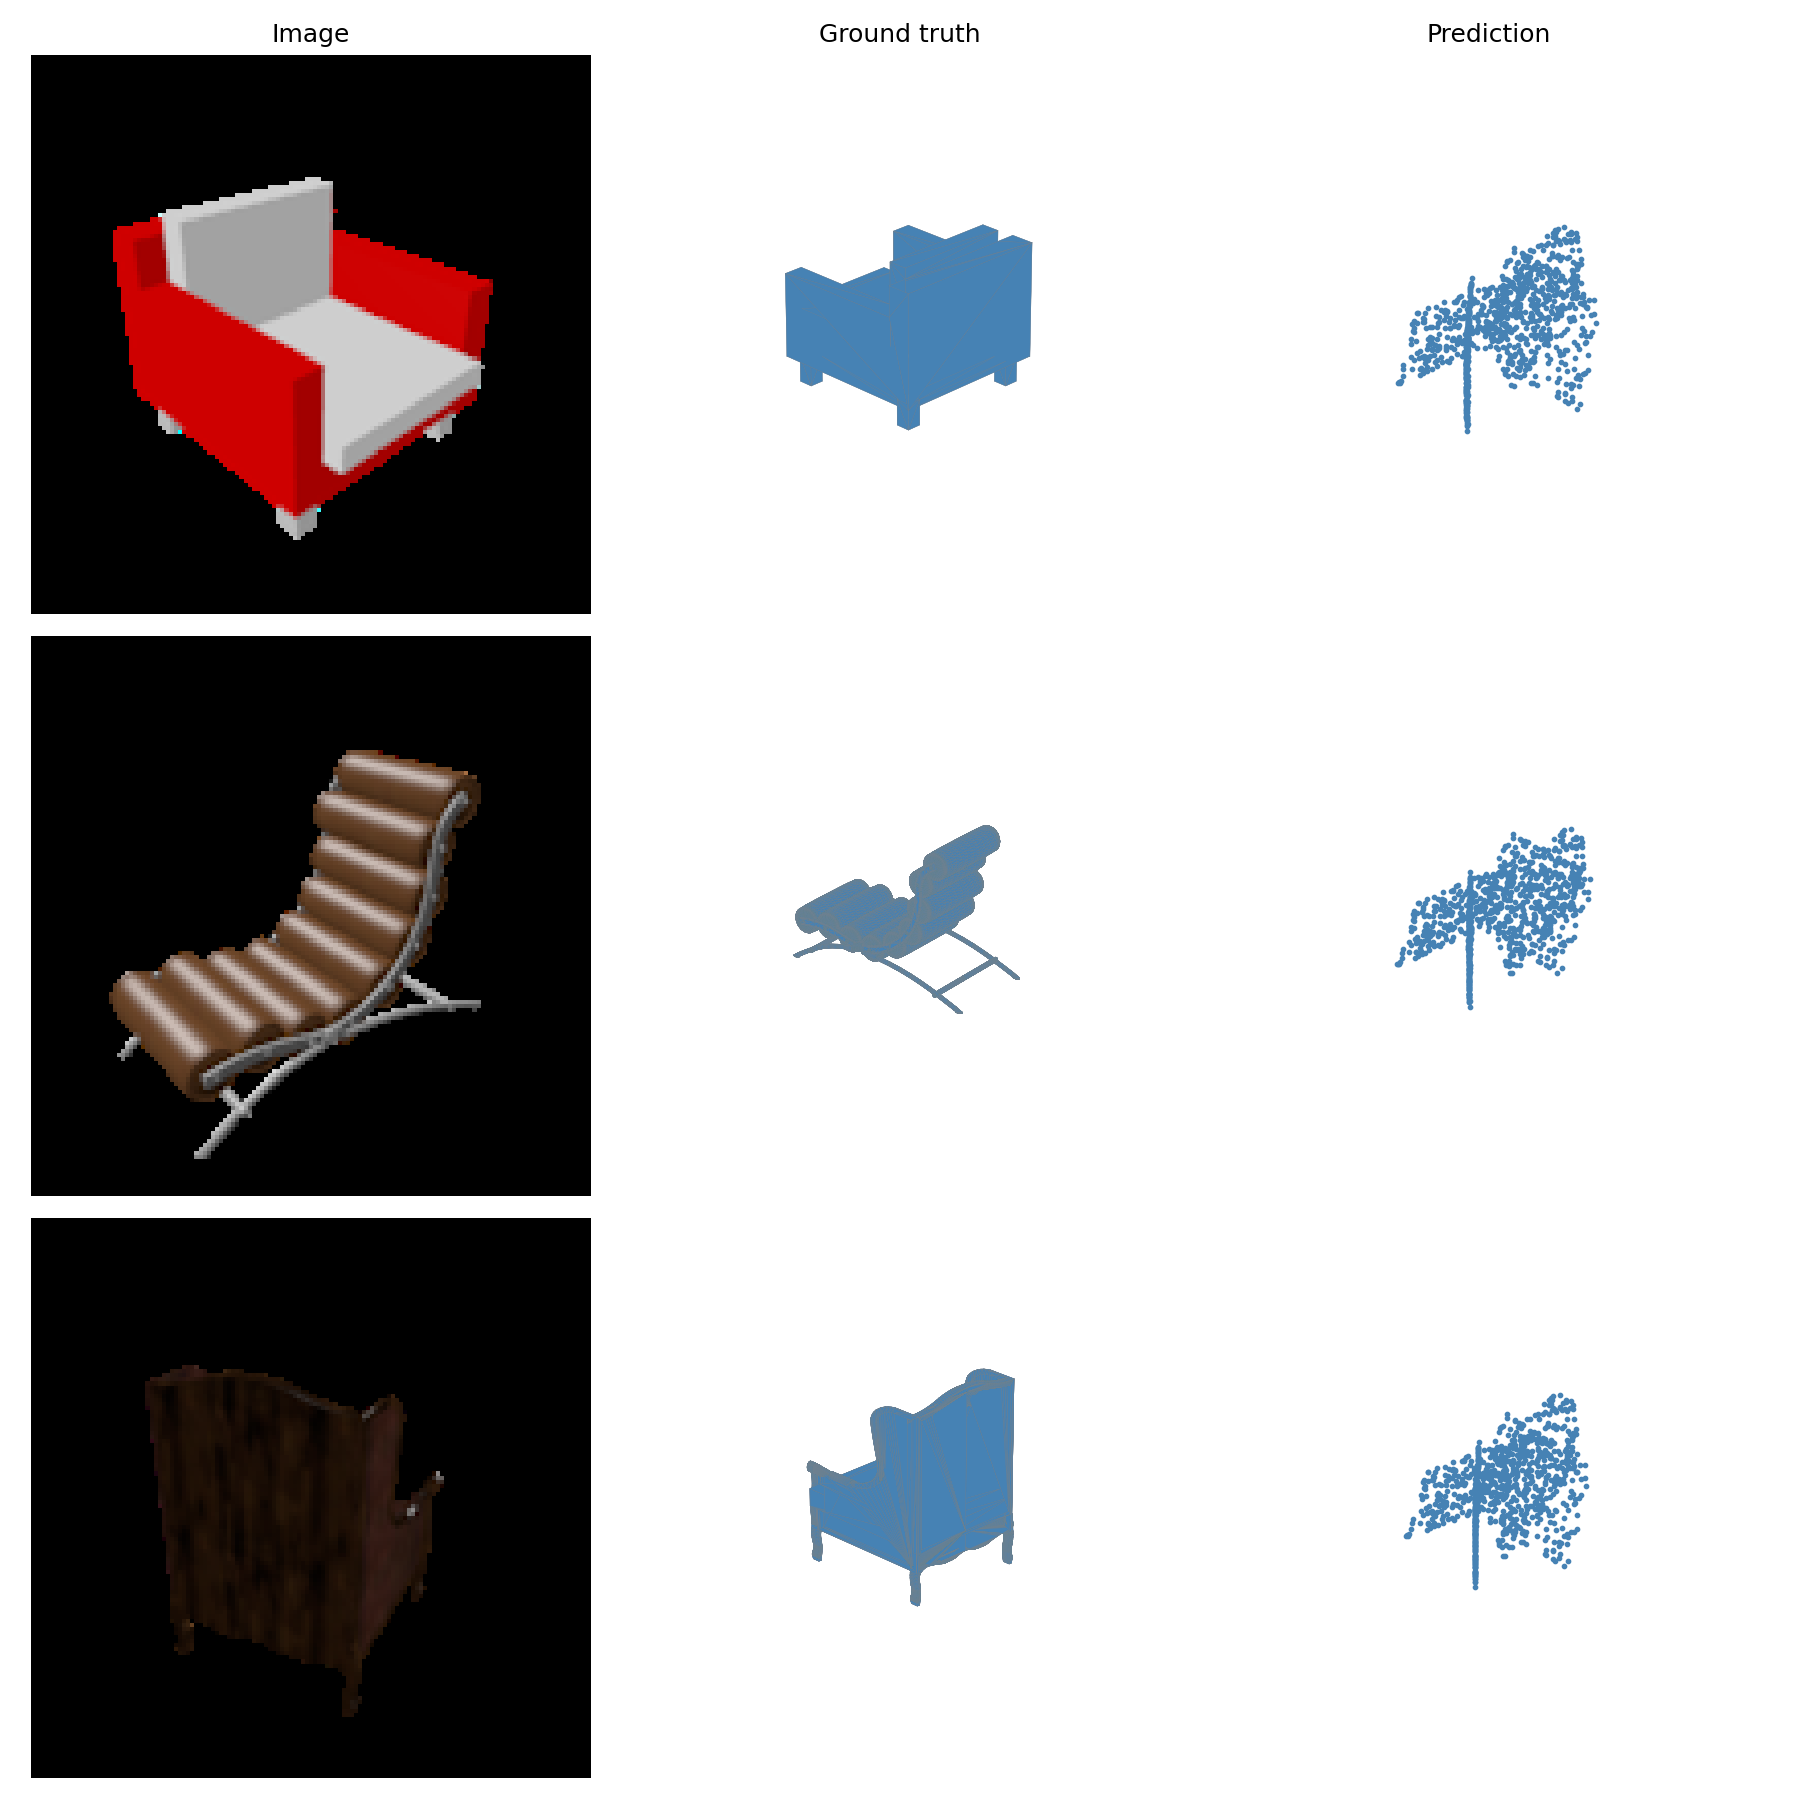
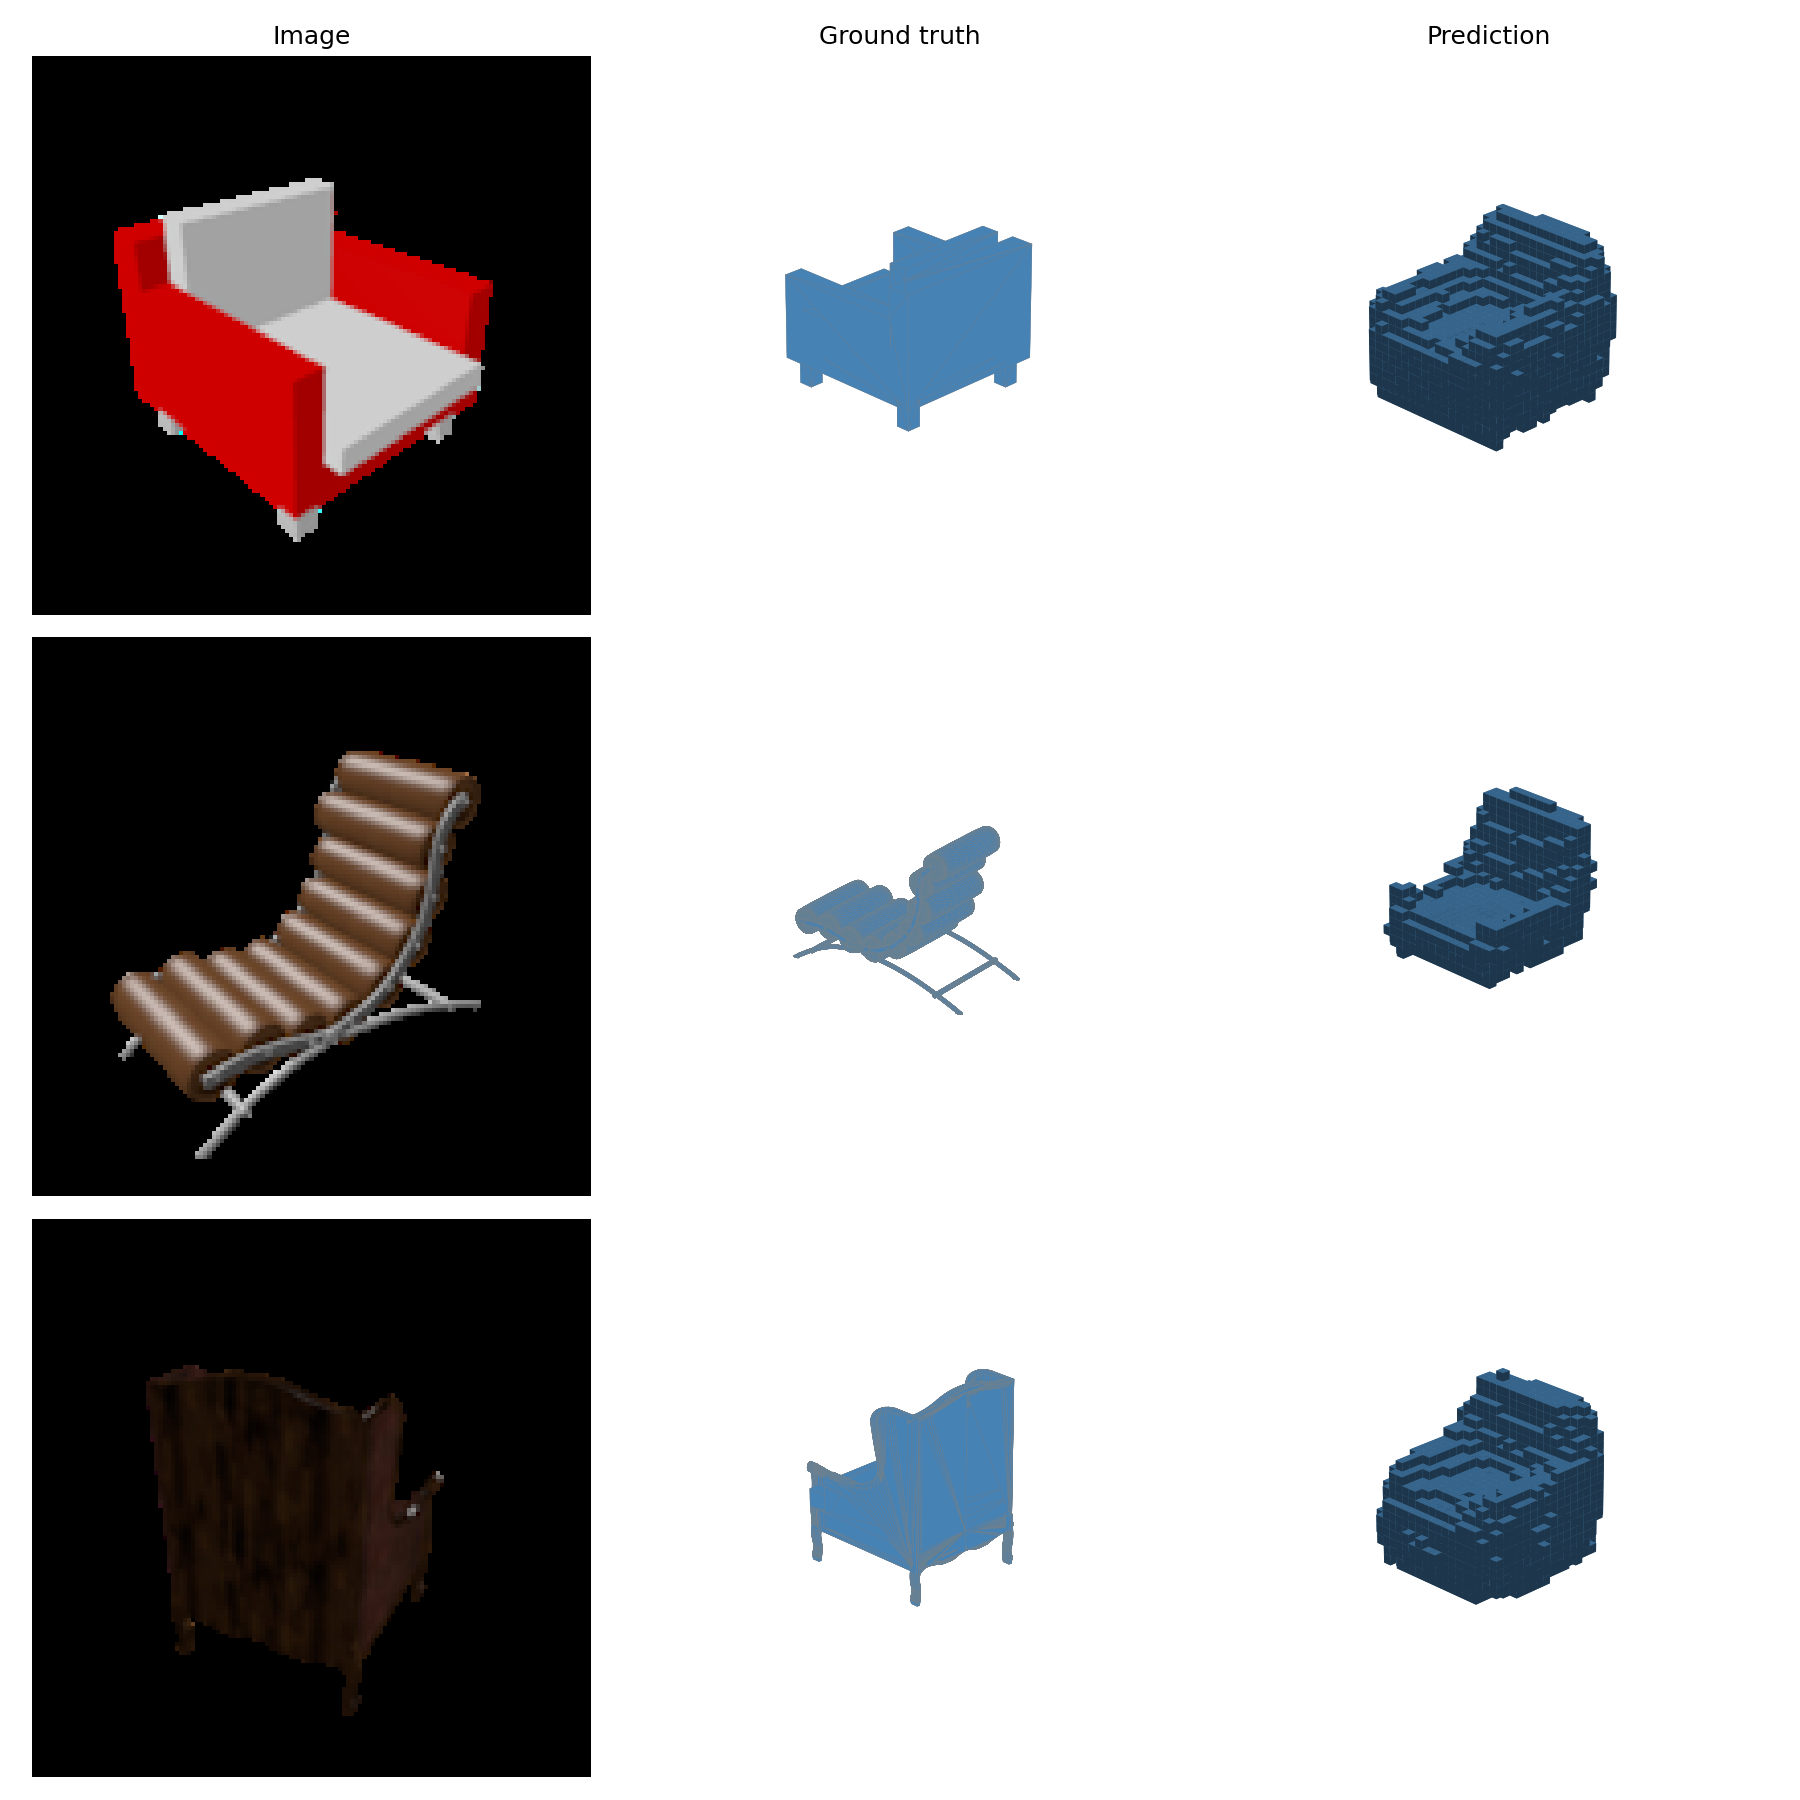
The columns show the input RGB image, ground truth mesh, and predicted voxel grid.
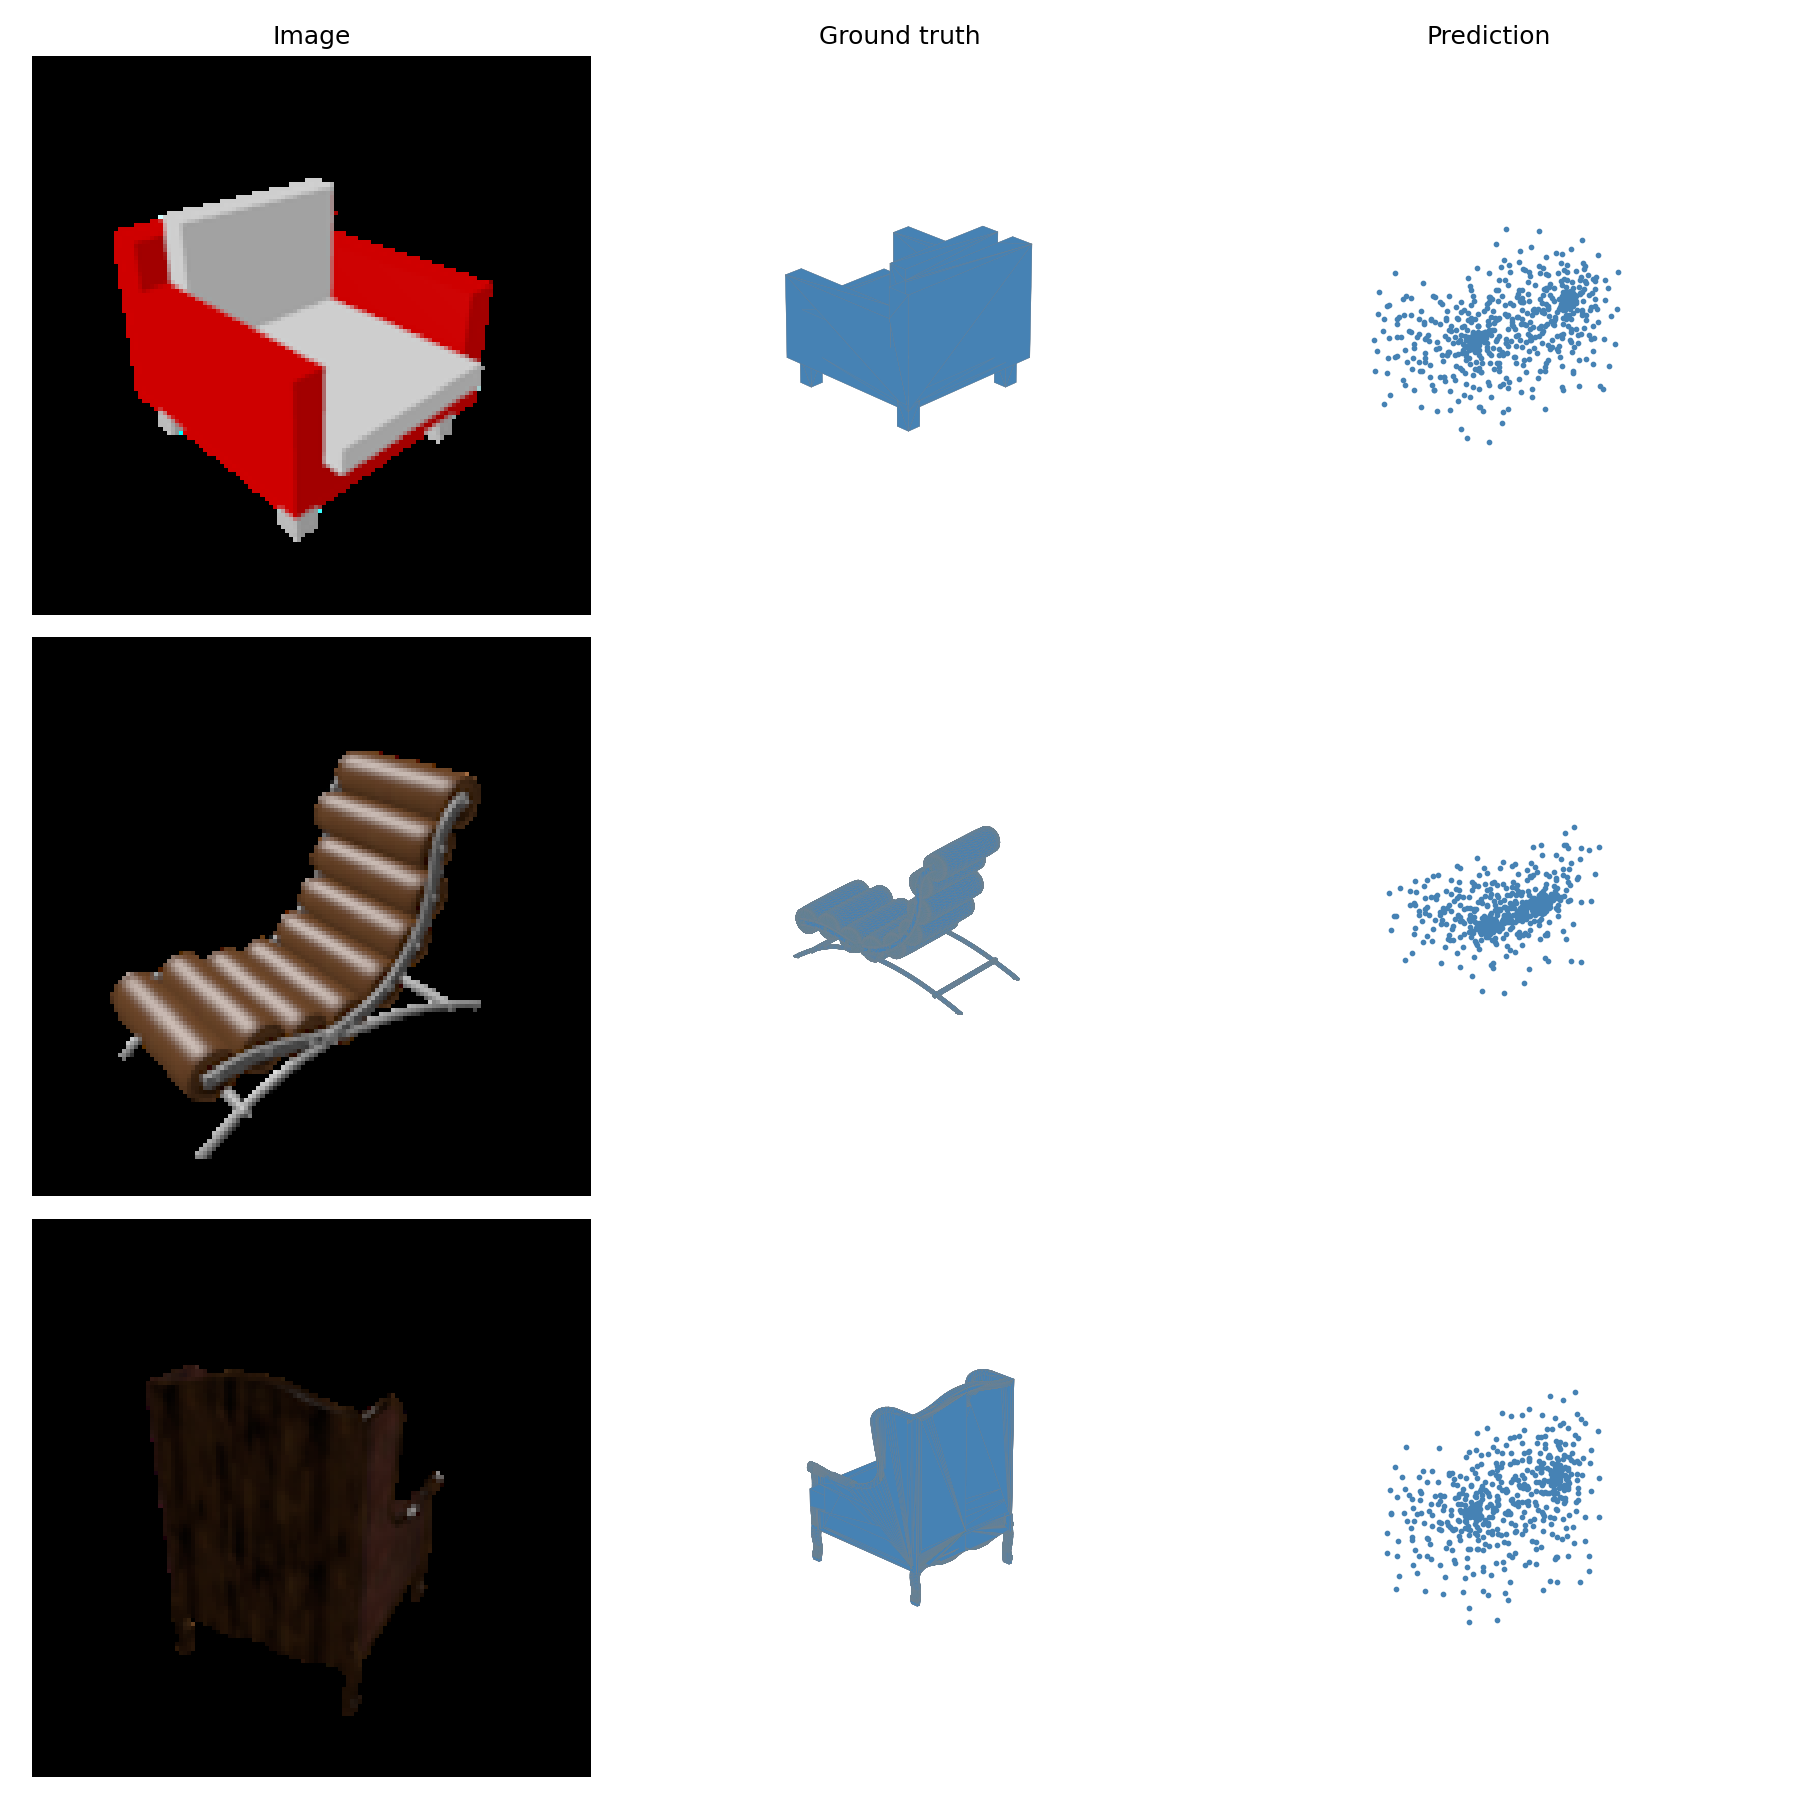
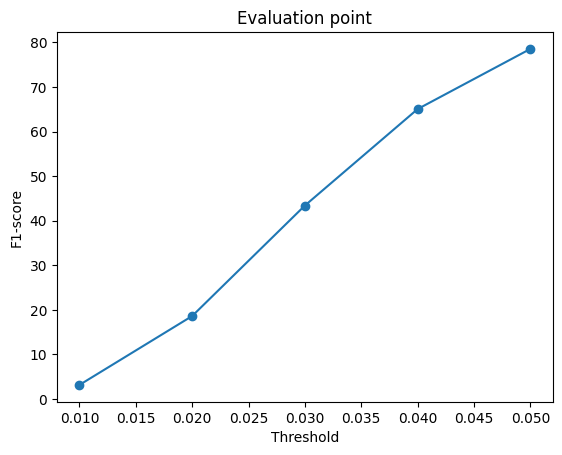
The decoder uses 512 → 1024 → 1024 → 3000 fully connected layers to predict 1,000 points. Training uses symmetric squared Chamfer distance. The final checkpoint contains 8,000 training steps.
F1@0.05: 78.531
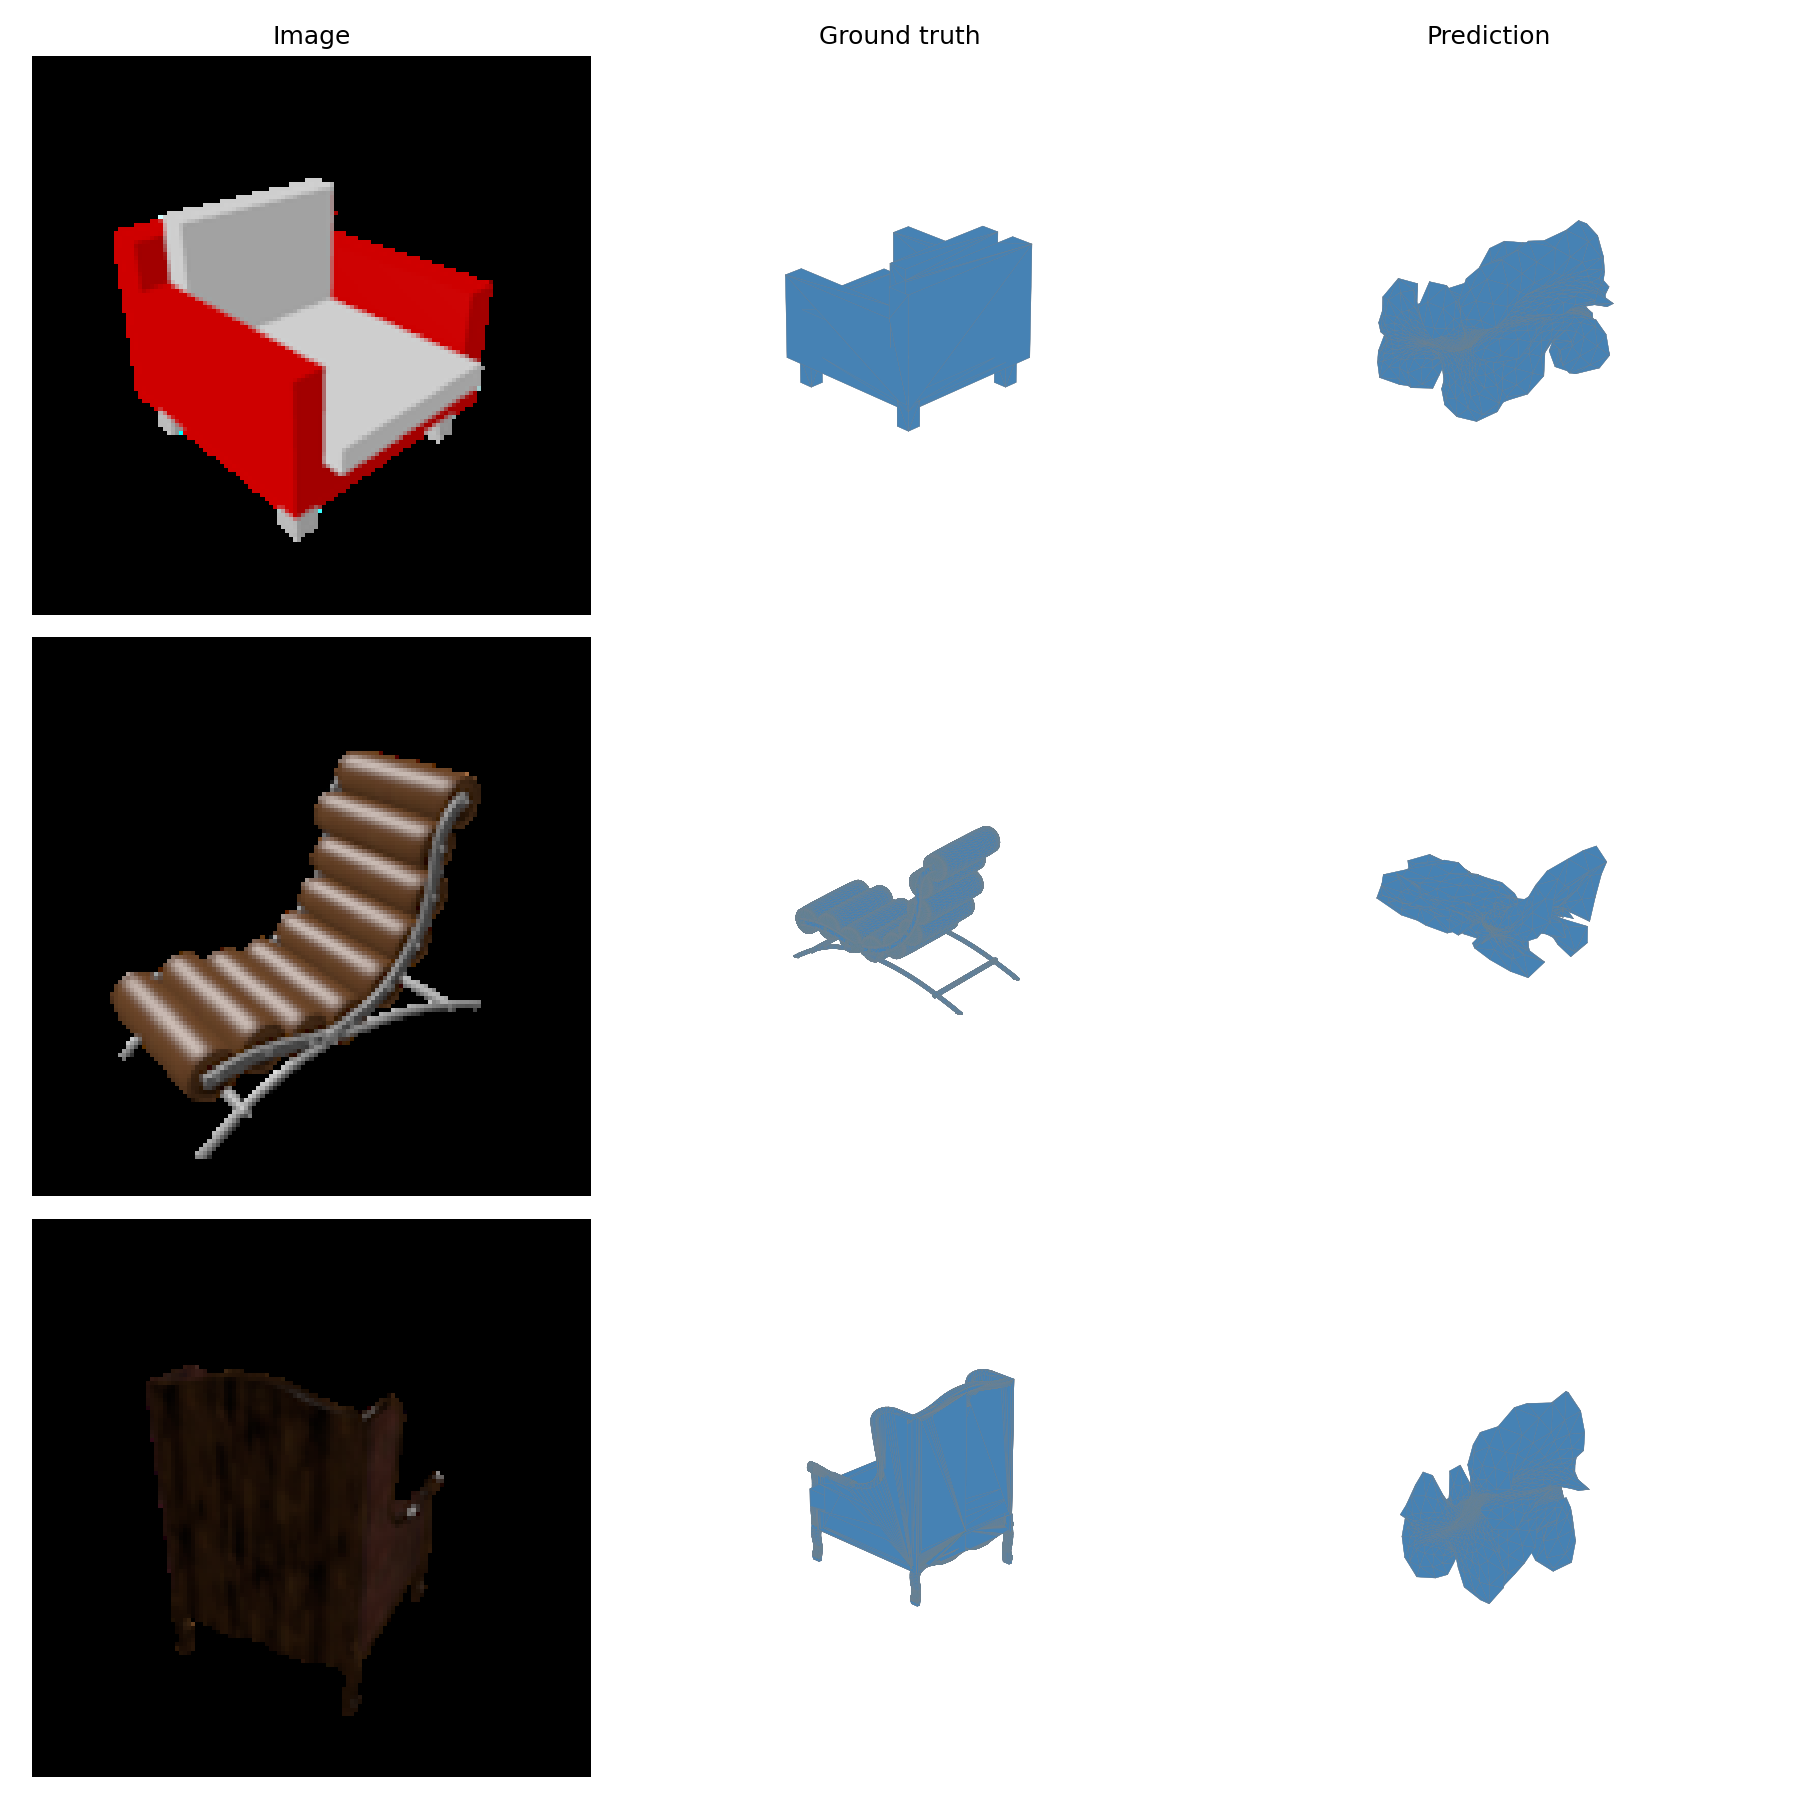
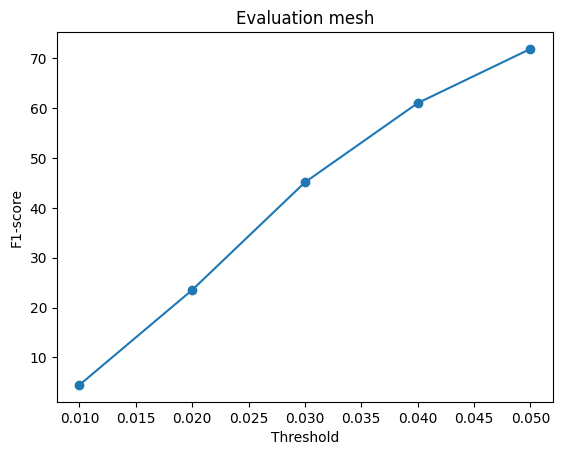
The decoder predicts offsets for a level-4 icosphere with 2,562 vertices. The 8,000-step model uses Chamfer loss, Laplacian smoothing, edge loss, and a penalty on the longest 1% of edges exceeding length 0.08. Their weights are 1, 0.1, 0.1, and 1, respectively.
F1@0.05: 71.853
| Representation | F1@0.05 |
|---|---|
| Voxel grid | 45.110 |
| Point cloud | 78.531 |
| Mesh | 71.853 |
The point model scores 6.678 points above the mesh model and 33.421 above the voxel model. Freely positioned points can cover a surface without voxel quantization or fixed mesh connectivity. Mesh regularization constrains deformation, while a 32³ voxel grid struggles with thin structures. However, the diffuse points and irregular mesh surfaces show that a high F1 does not guarantee a clean reconstruction. Training settings and voxel evaluation's additional centering also differ, so this is a comparison of the trained systems rather than representation alone.
I varied the occupancy threshold of a fixed, earlier unweighted 8,000-step voxel model. This diagnostic uses 32 training objects, seed 2026, fixed view 0, and 1,000 surface samples; it does not use the final weighted model from Section 2.1.
| Threshold | Mean precision | Mean recall | Mean F1@0.05 | Mean voxel IoU | Empty surfaces |
|---|---|---|---|---|---|
| 0.3 | 44.062 | 49.834 | 46.106 | 0.3429 | 0/32 |
| 0.4 | 47.700 | 40.541 | 42.238 | 0.2887 | 0/32 |
| 0.5 | 50.181 | 31.012 | 36.376 | 0.2149 | 1/32 |
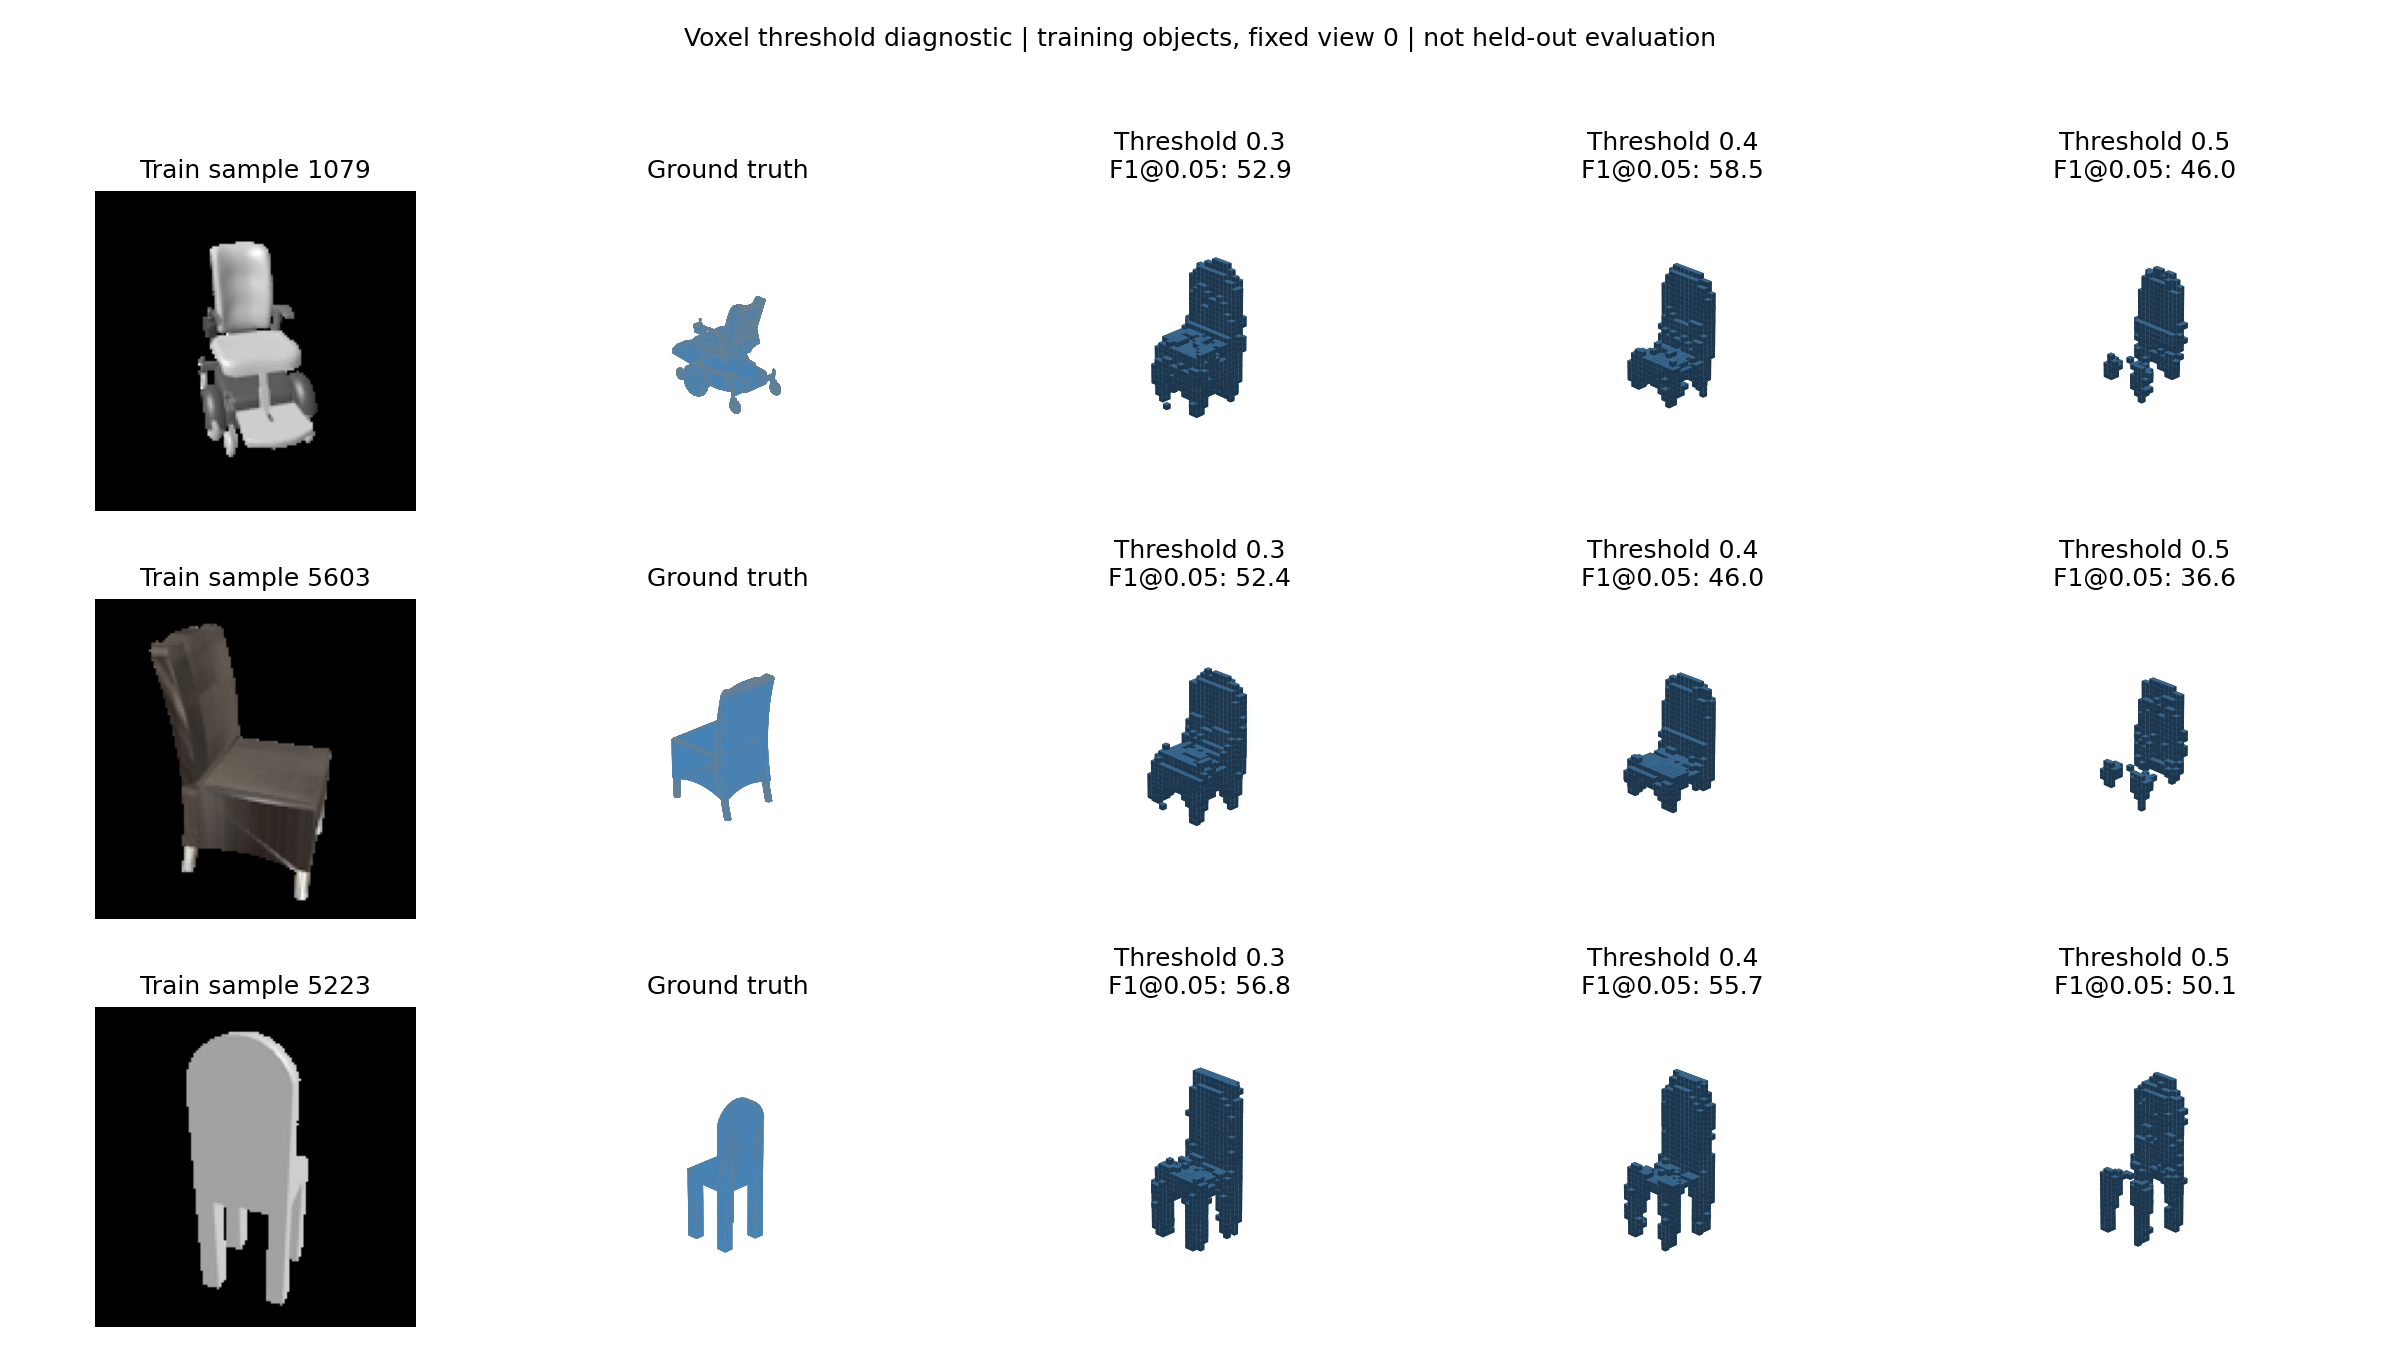
Lowering the threshold increases recall and reduces precision. Predicted occupancy rises from 2.80% at threshold 0.5 to 6.24% at 0.3, compared with 5.28% in the targets. This suggests underprediction at 0.5 for this model. The recall gain improves mean F1 on these objects, but training-set results do not establish better generalization. Main test results retain threshold 0.5.
I applied black occlusion to the final 8,000-step point model, using test objects 0, 1, and 2 at view 0. A 28 × 28 patch slides across each image with stride 14. Heatmaps show Chamfer distance between masked and original predictions, averaged over overlapping patches, with a shared color scale.

I also separately masked the upper, middle, and lower thirds of the foreground bounding box. F1 uses the same 5,000 ground-truth samples for each object's variants.
| Object | Original F1@0.05 | Upper masked | Middle masked | Lower masked |
|---|---|---|---|---|
| 0 | 75.81 | 46.85 | 78.15 | 66.29 |
| 1 | 88.12 | 83.48 | 76.23 | 90.36 |
| 2 | 84.94 | 80.29 | 87.29 | 83.82 |
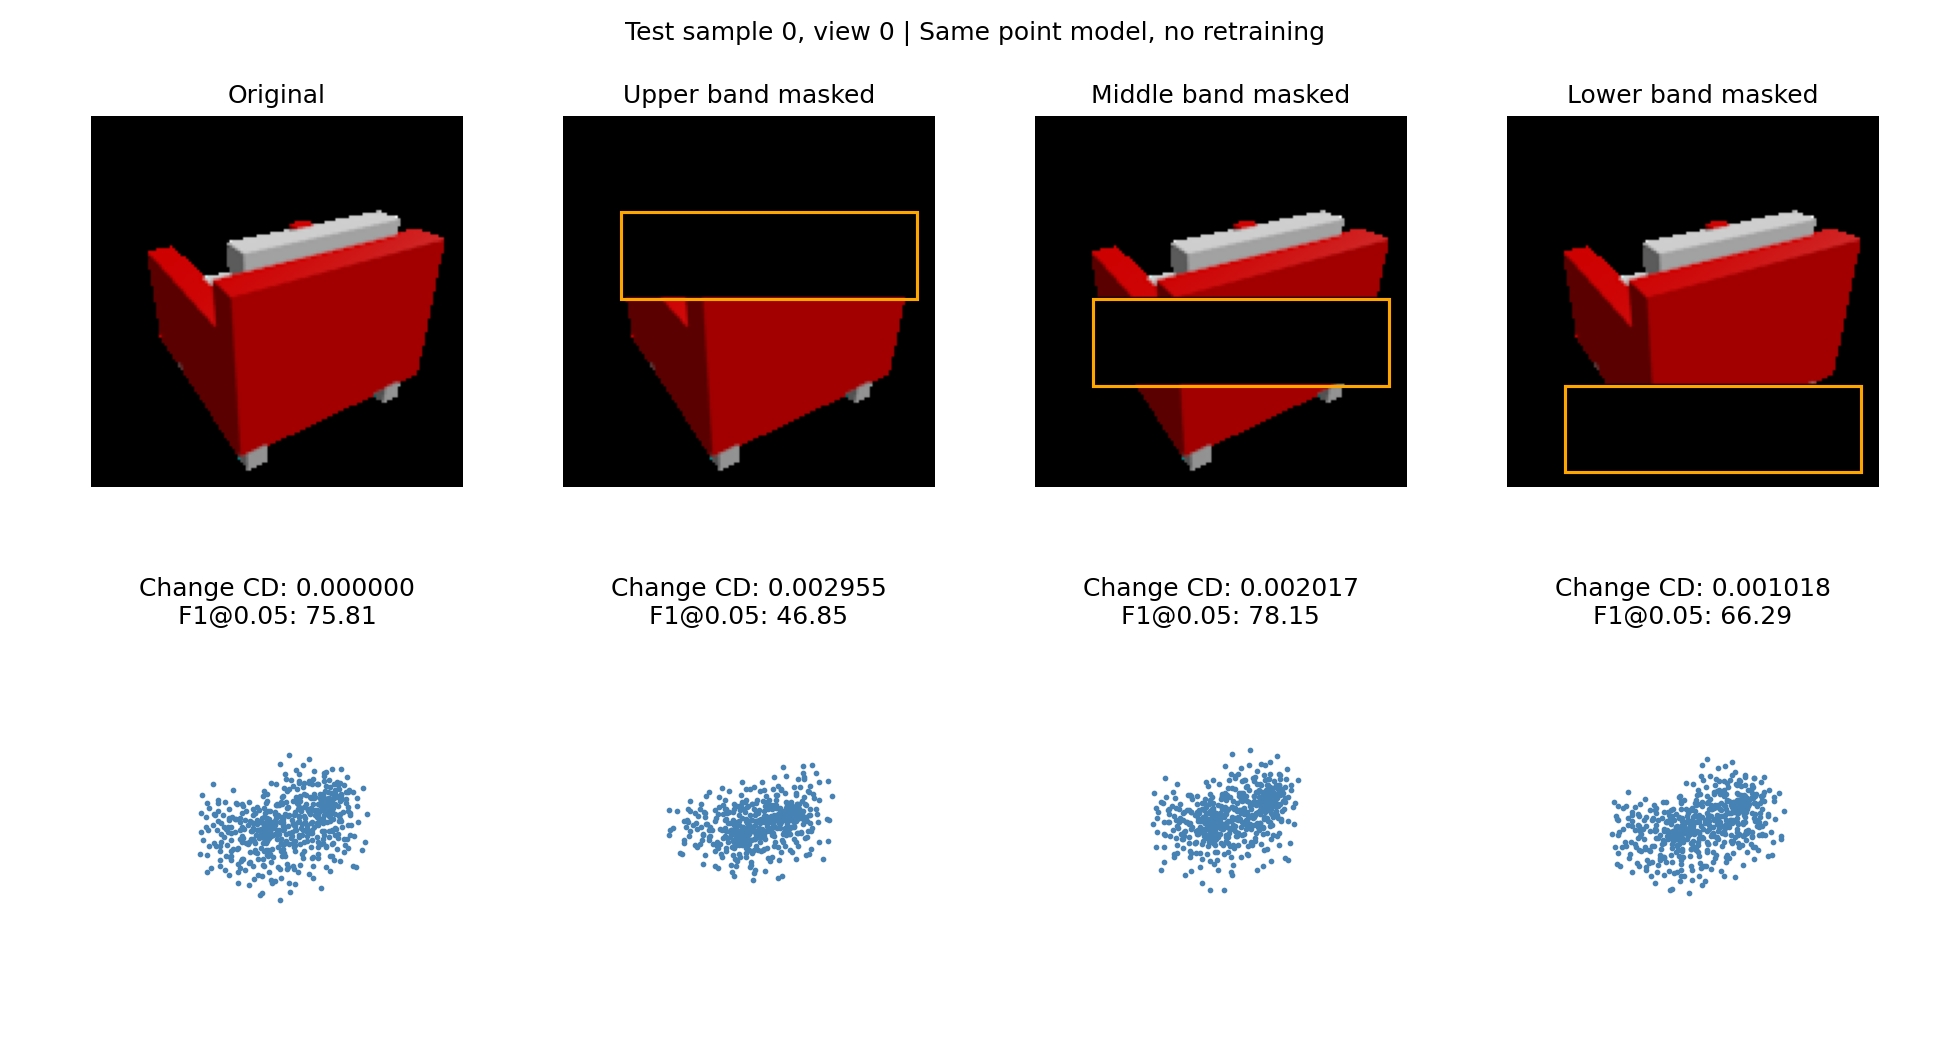
Upper-band masking changes the prediction most for objects 0 and 2; middle-band masking changes it most for object 1. Lower-band masking causes the smallest prediction change for all three. For object 0, masking the upper band reduces F1 by 28.96 points. Some masks improve F1, so sensitivity does not necessarily indicate useful evidence or semantic understanding.
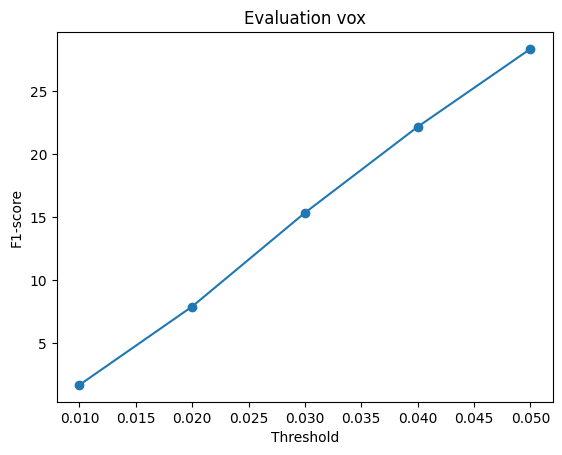
A frozen ResNet18 feature is projected to 128 dimensions and concatenated with a 3D query coordinate. An MLP (131 → 256 → 256 → 128 → 1) predicts occupancy. Training samples 4,096 queries per image and uses weighted BCE with positive-class weight 10. Evaluation queries a 32³ grid in normalized coordinates inside (−1, 1)³.
F1@0.05: 28.362, after 2,000 steps. Predictions remain coarse and miss thin structures. A 5,000-step continuation scored 17.094; the reported checkpoint was retained after inspecting test results, rather than selected by independent validation.
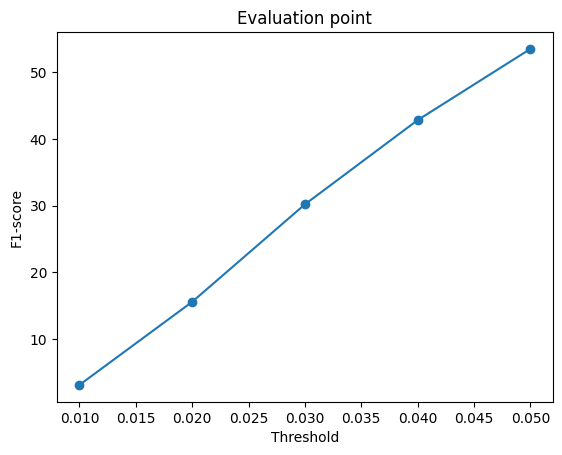
Four patch decoders map sampled 2D coordinates and a 128-dimensional image feature to 3D points. Each patch predicts 250 points, giving 1,000 points in total. Training uses symmetric squared Chamfer distance, random 2D queries, and a frozen ResNet18 encoder; evaluation uses fixed queries.
F1@0.05: 53.508, after 2,000 steps. The predictions capture rough chair structure but show uneven point distributions and similar shapes across inputs. The model scores above the implicit network and below the direct point decoder under these training settings.