
Name: Wen Wu
Andrew ID: wengleiw


F1@0.05: 75.237

Each example shows, from left to right: input RGB, ground-truth mesh, ground-truth voxel grid, predicted voxel grid.
Example 1 (test index 0):

Example 2 (test index 100):

Example 3 (test index 200):

Example 4 (test index 300):

Example 5 (test index 400):

Example 6 (test index 500):

Example 7 (test index 600):

F1@0.05: 77.477
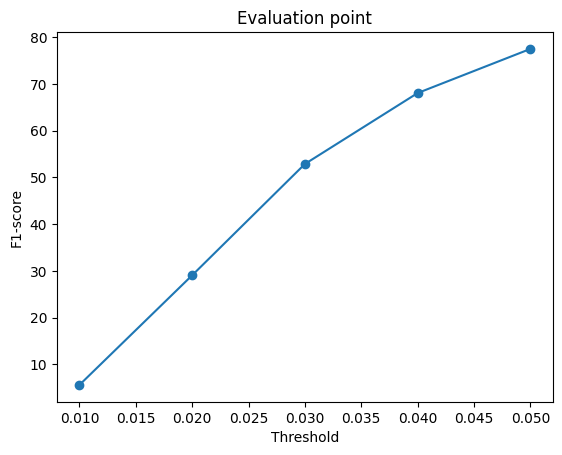
Each example shows, from left to right: input RGB, ground-truth mesh, ground-truth point cloud, predicted point cloud.
Example 1 (test index 0):

Example 2 (test index 100):

Example 3 (test index 200):

Example 4 (test index 300):

Example 5 (test index 400):

Example 6 (test index 500):

Example 7 (test index 600):

F1@0.05: 75.315

Each example shows, from left to right: input RGB, ground-truth mesh, predicted mesh.
Example 1 (test index 0):

Example 2 (test index 100):

Example 3 (test index 200):

Example 4 (test index 300):

Example 5 (test index 400):

Example 6 (test index 500):

Example 7 (test index 600):

| Representation | F1@0.05 |
|---|---|
| Voxel grid | 75.237 |
| Point cloud | 77.477 |
| Mesh | 75.315 |
The three representations have similar F1 scores, but the point cloud has the highest score. Voxel grids divide 3D space into discrete cells to represent shapes, and meshes are limited by their capacity for deformation. These are limitations of the representations. Points in a point cloud can move freely in 3D space, making it easier for the model to match the ground truth.
Hyperparameter varied: n_points
| Setting | F1@0.05 |
|---|---|
| 1000 | 77.477 |
| 200 | 59.524 |

Each example shows, from left to right: input RGB, ground-truth mesh, ground-truth point cloud, predicted point cloud.
Example 1 (test index 0):

Example 2 (test index 100):

Example 3 (test index 200):

Example 4 (test index 300):

Example 5 (test index 400):

Example 6 (test index 500):

Example 7 (test index 600):

I varied n_points for the point cloud from 1000 to 200. Even though the point cloud is sparser, the original object remains recognizable. Given enough points, changing the number of points has little effect on the visible reconstruction quality. However, there is a significant drop in F1 score. I suspect that with fewer points, the model can still arrange them into a visually recognizable shape, but surface coverage is reduced and alignment with the ground truth is poor.
F1@0.05: 72.849

Each example shows, from left to right: input RGB, ground-truth mesh, ground-truth point cloud, predicted point cloud.
Example 1 (test index 0):

Example 2 (test index 100):

Example 3 (test index 200):

Example 4 (test index 300):

Example 5 (test index 400):

Example 6 (test index 500):

Example 7 (test index 600):

I tested my model's robustness to occlusion by adding an occlusion of a fixed size in the center of each image. The images show that the model can still reconstruct the point cloud under occlusion. There are two interpretations. First, the model is robust to occlusion. Second, the model may have learned a prior over chair shapes, allowing it to recognize a chair without seeing every pixel. If two chairs differ in the occluded region, our model will likely produce the same point clouds for them. However, the F1 score shows some decrease in performance.
F1@0.05: 33.733

Each example shows, from left to right: input RGB, ground-truth mesh, ground-truth voxel grid, predicted implicit voxel grid.
Example 1 (test index 0):

Example 2 (test index 300):

Example 3 (test index 400):

Example 4 (test index 500):

Example 5 (test index 600):

Compared with Section 2.1, reconstruction quality decreases considerably.
F1@0.05: 73.737
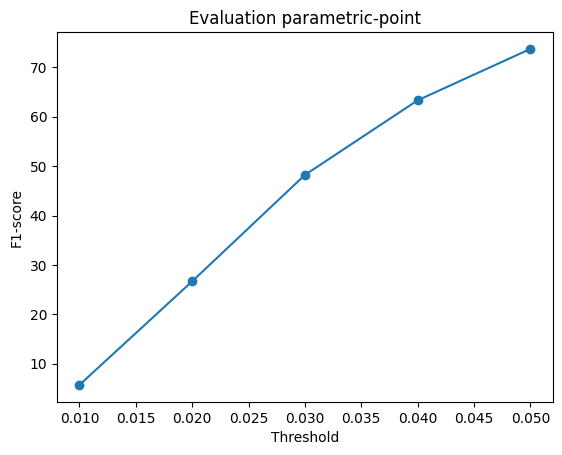
Each example shows, from left to right: input RGB, ground-truth mesh, ground-truth point cloud, predicted point cloud.
Example 1 (test index 0):

Example 2 (test index 100):

Example 3 (test index 200):

Example 4 (test index 300):

Example 5 (test index 400):

Example 6 (test index 500):

Example 7 (test index 600):

Compared with Section 2.2, reconstruction quality decreases somewhat. This decrease is visible in the first four examples.
| Training data | F1@0.05 |
|---|---|
| Single-class chairs - single-class dataset | 77.477 |
| Single-class chairs - extended dataset | 77.404 |
| Three classes: chair, car, plane - extended dataset | 86.492 |


Each example shows, from left to right: input RGB, ground-truth mesh, ground-truth point cloud, predicted point cloud.
Single-class Example 1 (test index 0):

Single-class Example 2 (test index 100):

Single-class Example 3 (test index 200):

Single-class Example 4 (test index 300):

Single-class Example 5 (test index 400):

Single-class Example 6 (test index 500):

Single-class Example 7 (test index 600):

Three-classes Example 1 (test index 0):

Three-classes Example 2 (test index 100):

Three-classes Example 3 (test index 200):

Three-classes Example 4 (test index 300):

Three-classes Example 5 (test index 400):

Three-classes Example 6 (test index 500):

Three-classes Example 7 (test index 600):

Three-classes Example 8 (test index 700):

Three-classes Example 9 (test index 800):

Three-classes Example 10 (test index 900):

Three-classes Example 11 (test index 1000):

Three-classes Example 12 (test index 1100):

Three-classes Example 13 (test index 1200):

Three-classes Example 14 (test index 1300):

Three-classes Example 15 (test index 1400):

The model was trained on the extended dataset and evaluated on both the single-class and three-class datasets. The images show perfect point-cloud reconstructions on the three-class dataset. For the single-class images, there is no visible degradation in the point clouds compared with the results in Section 2.2, particularly Example 4. The small difference is also reflected in the F1 scores.