Question 1
Exploring Loss Functions
1.1 Voxel grid


1.2 Point cloud


1.3 Mesh


Question 2.1
Image to Voxel Grid
68.50F1@0.05
Trained with pos_weight=3 in the BCE loss.


Question 2.2
Image to Point Cloud
77.59F1@0.05


Question 2.3
Image to Mesh
72.62F1@0.05


Voxel vs. point cloud vs. mesh
| Representation | F1@0.05 |
|---|---|
| Voxel | 68.50 |
| Point cloud | 77.59 |
| Mesh | 72.62 |
Point cloud is best because each point can move freely to the surface. The mesh is limited by the sphere's fixed topology (it cannot open holes between legs or slats). Voxels are limited by the 32³ resolution, so thin parts are lost or thickened.
Question 2.4
Effect of the Number of Points
I changed only n_points of the point cloud decoder.
| n_points | 500 | 1000 | 2000 | 5000 | 10000 |
|---|---|---|---|---|---|
| F1@0.05 | 71.68 | 77.59 | 80.33 | 83.76 | 84.78 |


More points give a higher F1 and a more complete chair, but the gain gets smaller as n grows.
Question 2.5
Interpret the Model
I used the point cloud model for this since it had the best F1.


Point correspondence
I gave each of the 1000 output points a color based on where it sits in the model's average prediction, and used the same colors for every test chair. The same colors end up on the same parts of every chair, so each output point has a fixed job, like being part of the front-left leg. Even the chair with no legs (middle) still gets the leg-colored points, placed along its bottom.
Error heatmap
Each point is colored by its distance to the ground truth. The normal chair is accurate; the errors are on the tilted backrest and the bottom of the chair with no legs.
Question 3.1
Implicit Network
67.59F1@0.05
Trained with pos_weight=3 in the BCE loss.
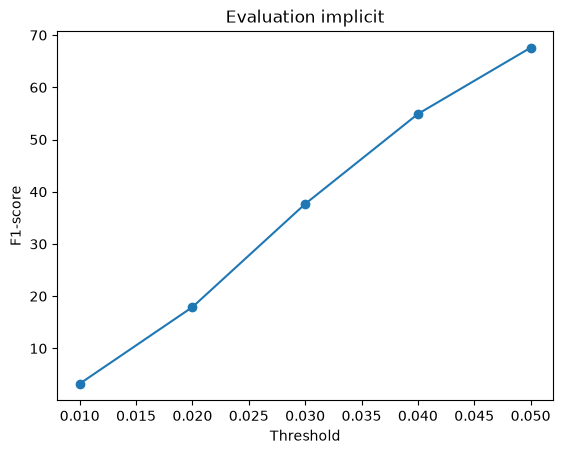
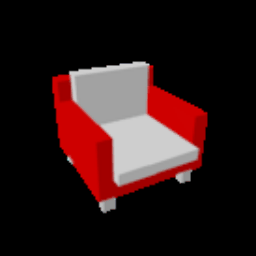


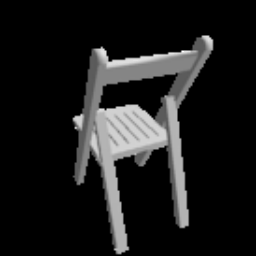


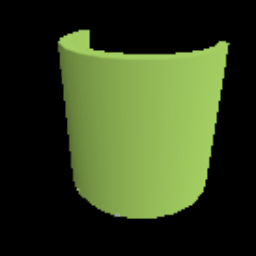


Almost the same F1 as the voxel decoder (68.50) with 41× fewer decoder parameters (0.12M vs. 4.9M), since one small function is shared by all locations.
Question 3.2
Parametric Network
73.80F1@0.05
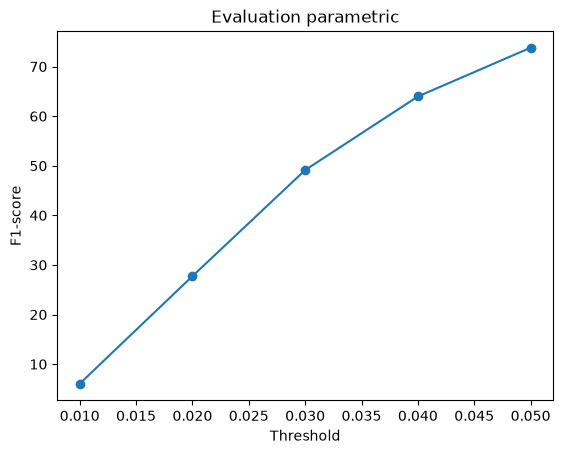


3.8 F1 below the point decoder (77.59) with 8× fewer parameters (1.06M vs. 8.8M). Points are colored by patch: the patches overlap across the whole chair instead of splitting it into parts.
Question 3.3
Extended Dataset
| Trained on | Chair | Car | Airplane | All |
|---|---|---|---|---|
| Chair only | 76.54 | 66.09 | 62.98 | 70.11 |
| Chair + car + airplane | 77.05 | 92.77 | 95.58 | 86.21 |


On the same chairs, adding two classes barely changes F1 (76.54 → 77.05). The chair-only model turns every input into a chair, so its outputs have little diversity. The 3-class model is consistent within a class and switches to a car or airplane shape from the image. Cars and airplanes score much higher than chairs, likely because they vary less within the class.