Binary cross-entropy between the optimized grid and the 32³ target occupancy, computed on logits (binary_cross_entropy_with_logits); the surface is extracted from the sigmoid of the grid with marching cubes.

Name: Sumanth Yegurla · Andrew ID: syegurla
Binary cross-entropy between the optimized grid and the 32³ target occupancy, computed on logits (binary_cross_entropy_with_logits); the surface is extracted from the sigmoid of the grid with marching cubes.
Chamfer distance implemented from scratch with knn_points: for every point, the squared distance to its nearest neighbor in the other cloud, averaged in both directions and summed. 5,000 points.

Starting from a level-4 icosphere, the per-vertex offsets are optimized with chamfer distance between 5,000 points sampled from each surface, plus a uniform Laplacian smoothing term (w_chamfer = 1.0, w_smooth = 0.1), implemented directly from the mesh's edge list: for each vertex, the distance to the average of its neighbors.

Growing a chair out of a sphere is harder than it looks. To match the chair, the mesh has to grow four long, thin legs, which means some vertices travel a long way, and the smoothing term pushes back against thin spikes. It takes a lot of iterations: after 5,000 the mesh was still spiky and folded, and only by 100,000 had it split into four legs. A sphere also can't change its topology, so a mesh fit this way could never have real holes, like the gaps in a slatted backrest. The voxel grid and the point cloud don't have either problem, and both match the target closely.


| Representation | F1@0.05 |
|---|---|
| Voxel grid (2.1) | 68.1 |
| Point cloud (2.2) | 74.7 |
| Mesh (2.3) | 69.3 |
The point cloud comes out on top (74.7), with the mesh (69.3) and the voxel grid (68.1) close to each other. I think this mostly comes down to how directly each representation matches the metric. The point decoder outputs surface points and is trained with chamfer distance, which uses the same nearest-point distances that F1 is computed from, so it's optimizing almost exactly what gets scored.
The voxel grid is held back by its 32³ resolution. Any leg or slat thinner than a voxel either vanishes or becomes a blocky column (you can see this on test chair 200), and the surface only gets recovered afterwards through marching cubes.
The mesh has a different problem. It's one deformed sphere with a fixed number of vertices, so growing long, thin legs is hard, and it can't make holes at all, like the openings in a framed backrest or the loops formed by a folding chair's crossed legs. It ends up stretching surface across those gaps, which puts points where the real chair has none. And since F1 only looks at how close sampled points are to the true surface, it barely tells a crumpled mesh apart from a clean one (more on that in 2.4).
w_smooth | F1@0.05 |
|---|---|
| 0.0 | 71.2 |
| 0.1 | 70.4 |
| 1.0 | 67.3 |
The same three test chairs and input images, predicted by the model trained with each weight:

w_smooth = 0.0w_smooth = 0.1w_smooth = 1.0Ground truth
w_smooth = 0.0w_smooth = 0.1w_smooth = 1.0Ground truth
w_smooth = 0.0w_smooth = 0.1w_smooth = 1.0Ground truthThe numbers and the pictures tell opposite stories here. F1 drops steadily as the weight goes up (71.2 → 70.4 → 67.3), but the meshes look better and better. With no smoothing, the surface is crumpled, full of small folds and faces that cross through each other. At 1.0 it's smooth and clean, but the thin parts shrink: legs taper off to points and edges get pulled inward.
That makes sense given what the Laplacian term does. It pulls each vertex toward the average of its neighbors, which irons out folds but also drags thin structures inward, away from the true surface. F1 only cares about how far sampled points are from the ground truth, and a small fold barely moves any of them, so the crumpled mesh ends up scoring higher than the clean one.
Each predicted point of the point-cloud model is colored by its distance to the nearest point on the ground-truth surface, using one shared color scale (blue = on the surface, red = 0.1 or more away).

The error maps make it pretty clear where the model can be trusted. Big, well-lit parts of ordinary chairs, like backrests and seats, are mostly blue. The errors pile up on thin or unusual parts, such as legs and slanted frames. The folding chair (test chair 200) is a good example: the model gives it the legs of a normal upright chair. When the input doesn't look typical, it seems to fall back on an average chair shape.
Test chair 400 is the worst case. Its input is almost completely black (mean brightness 2.2 out of 255), and the prediction goes wrong in two ways. The four legs collapse into a single column of points, and the whole chair ends up at the wrong height. Its vertical extent (−0.38 to 0.28) is nearly the same as for the other chairs I looked at (about −0.35 to 0.28), while the real chair is taller (−0.24 to 0.48). With so little to see, the model basically guesses a chair of typical size.


To check whether the darkness was really the cause, I fed the same model brightened versions of the image. I computed their features with the same pretrained ResNet-18 and preprocessing that produced the provided features; recomputing the feature of the original image reproduces the provided one exactly (cosine similarity 1.000), so the comparison is fair.

Vertical extent of the predicted points at each brightness (y is up; bottom and top are the 2nd and 98th percentiles):
| Input | Bottom | Middle | Top |
|---|---|---|---|
| Original (dark) | −0.38 | −0.08 | 0.28 |
| 2× brighter | −0.33 | −0.02 | 0.32 |
| 4× brighter | −0.28 | 0.02 | 0.35 |
| 8× brighter | −0.26 | 0.00 | 0.31 |
| True chair | −0.24 | 0.08 | 0.48 |
At 4× brightness the mean error drops from 0.100 to 0.035, F1 jumps from 16.2 to 78.9, and the bottom and middle of the prediction get close to the true values (−0.28 vs −0.24, and 0.02 vs 0.08). The top never gets past 0.35, though (the real top is at 0.48), so even with a clear image the model underestimates this unusually tall backrest, which looks like the same pull toward typical chairs. Going to 8× makes the error go up a little again (0.038). My guess is that the colors get so saturated they stop looking like the training images. This is only one chair, so I'd read it as a case study rather than a result about the whole test set.


Some predictions are nearly empty. Drawing the same predicted occupancy at lower probability cutoffs shows the chair is present but below 0.5:

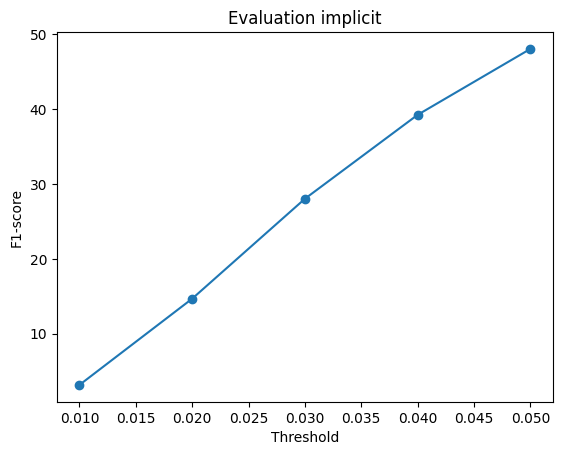
The implicit model scores 48.0, a lot lower than the voxel model (68.1), even though both predict occupancy on the same 32³ grid with the same loss. Positional encoding turned out to be essential. In an early short run without it, the network learned to predict empty space everywhere (F1 around 3). A plain MLP on raw xyz coordinates has a hard time representing a sharp boundary between inside and outside, and since most of the grid is empty anyway, predicting "empty" everywhere was the easy way out. With the encoding it learns real chair shapes, scoring 95.6 on test chair 600.
The main problem that's left is confidence. For test chairs 200 and 400, the highest probability anywhere in the grid is only about 0.55, and just 15–26 grid points make it past 0.5. The model does know roughly where the chair is, since points inside the true chair get about 6× the probability of points outside it (0.13 vs 0.02). It just never commits. Because evaluation uses a fixed 0.5 cutoff, those predictions turn into nearly empty shapes that score close to zero. Dropping the cutoff to 0.3 brings back a recognizable chair (figure above), while for confident predictions like test chair 600 the cutoff hardly matters.


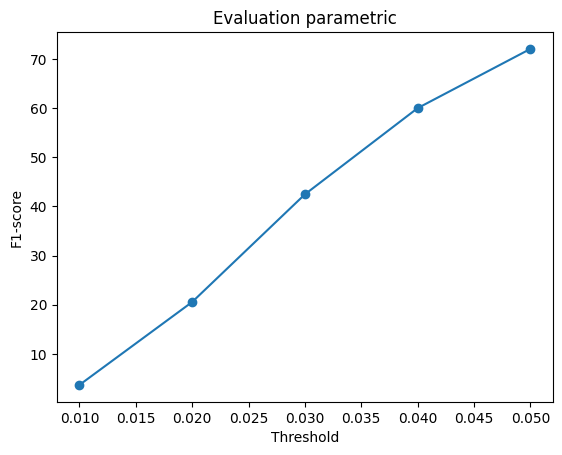
The parametric model gets 72.1, close to the point-cloud model's 74.7 even though it has about 30 times fewer parameters (0.26M vs 8.8M). That's because a single small network is shared by every output point, whereas the point decoder needs a separate output for each one. The catch is that it has to learn one continuous map from the square onto the chair's surface. In the examples above, that spreads the points more evenly over the surface, while the point decoder tends to bunch points into dense clusters (compare with the turntables in 2.2). But one square has to be stretched and folded to cover separate parts like the four legs, which is probably why it ends up a little behind. A nice side effect of sampling (u, v) fresh on every forward pass is that it can output as many points as you want at test time.
| Model | Test set | F1@0.05 |
|---|---|---|
| Trained on chairs only (2.2) | 678 test chairs | 74.7 |
| Trained on three classes | the same 678 test chairs | 76.2 |
| Trained on three classes | full three-class test set (1,451) | 86.1 |
The same chairs, predicted by each model from the same input image:


The three-class model on the other classes:


Adding cars and airplanes to training didn't hurt the chairs. On the same 678 test chairs, the three-class model scores 76.2 and the chair-only model 74.7. That difference is within the ±1–2 points that scores move between evaluation runs, so I'd call it a tie rather than an improvement.
On the full three-class test set the model scores 86.1. Breaking that down by class, the 773 airplanes and cars average 94.6, while the 678 chairs average 76.4. So chairs are by far the hardest class. Their shapes vary a lot more (thin legs, slats, open backs), while cars and airplanes are more compact and look more alike.
Looking at the turntables, the two models predict almost the same shape for each chair. The three-class model's points are a bit more scattered and its legs a little less crisp, and neither one gets the slanted legs of the folding chair (test chair 200). The outputs also stay just as varied from chair to chair: the wide armchair still looks clearly different from the narrow upright chairs. So at least in these examples, sharing the model with two other classes didn't make its chair predictions more uniform.