Q1. Classification Model
Results
Test accuracy: 93.4% (0.9338929695697796)
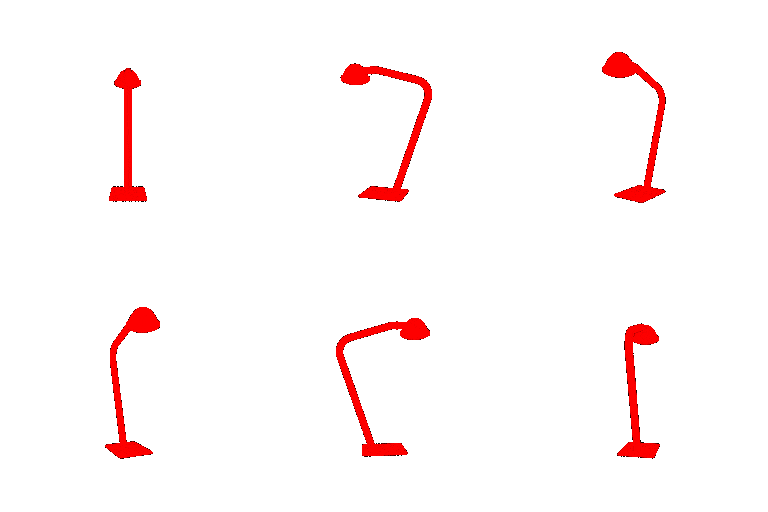
Visualizations: All of the following examples have the same predicted & ground truth classes.
| Predicted + Ground Truth Class | Example 1 | Example 2 | Example 3 |
|---|---|---|---|
Chair (0) |
 |
 |
 |
Vase (1) |
 |
 |
 |
Lamp (2) |
 |
 |
 |
Failure Cases
| Visualization | True Class | Predicted Class |
|---|---|---|
 |
Chair (0) |
Vase (1) |
 |
Chair (0) |
Lamp (2) |
The first chair is very bowl-shaped, save for a small cutout region (for a person to sit). Since a lot of vases are similarly bowl-shaped, but a lot of chairs aren't, the model may have thus used this chair's bowl shape [and otherwise exotic shape] as an indication of a vase, hence the misprediction.
The second chair is not shaped like a "standard" chair (i.e. with legs), nor is it shaped like a couch. Additionally, it's also quite flat; as such, it's possible that the model has learned that "flat" is correlated with "lamp", as seen in Example 3 for lamps above, and classified this particular chair accordingly.
| Example 1 | Example 2 | True Class | Predicted Class |
|---|---|---|---|
 |
 |
Vase (1) |
Lamp (2) |
One archetypal lamp shape is that of a slenderer base into a wider lampshade at the top, which fans out from top to bottom. The first vase follows a similar shape pattern, with a slender base [vase] into a wider lampshade [the plant], which likely resulted in its misprediction.
The second vase is very flat, unlike most vases. As mentioned previously, a lot of lamps have somewhat flatter or more exotic shapes compared to instances of the other two classes, which may have caused this misprediction.
| Example 1 | Example 2 | True Class | Predicted Class |
|---|---|---|---|
 |
 |
Lamp (2) |
Vase (1) |
The first hanging lamp has a wide, container-shaped bottom that looks like a vase, plus the hanging rod on top that might be misconstrued as a plant. These features match what might be expected from a vase with a small plant placed on the ground, hence the misprediction.
The second lamp is shaped like a bowl - I'm assuming it's some kind of ceiling-mounted lamp, but nevertheless, the underlying shape is bowl-like. Given that many vases are bowl-shaped (and most lamps are not), it's not unsurprising that the model has interpreted the shape as representing a vase.
Q2. Segmentation Model
Results
Test accuracy: 88.8% (0.8876260940032414)
Less-Bad Predictions
| Ground Truth | Predicted | Accuracy |
|---|---|---|
 |
 |
93.01% |
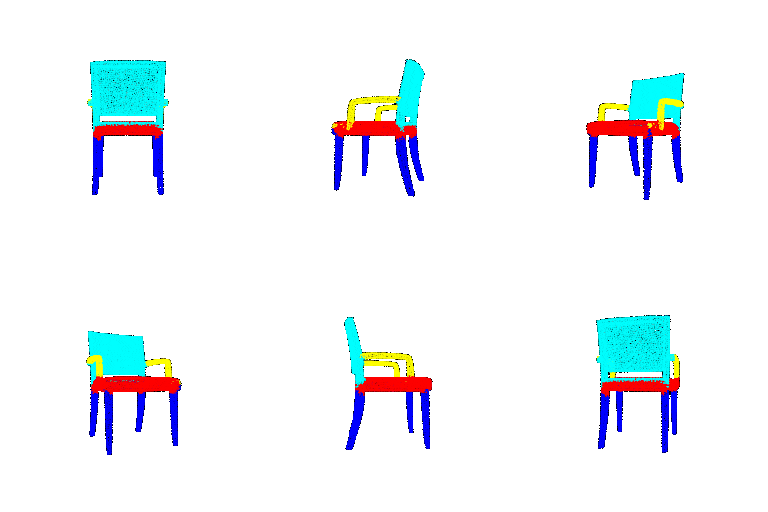
This GIF clearly shows 4 of our segmentation categories: seat legs (dark blue), seat cushion (red), seat armrests (yellow), and seat back (cyan). The model's prediction here is mostly correct, as evidencied by the high accuracy; however, in the prediction, we do see a little bit of yellow and a lot of cyan on the front and back of the seat cushion, respectively. The model has overpredicted "seat armrest" around the base of the armrests, and "seat back" around the base of the seat back, hence the 7% mispredicted.
| Ground Truth | Predicted | Accuracy |
|---|---|---|
 |
 |
83.1% |
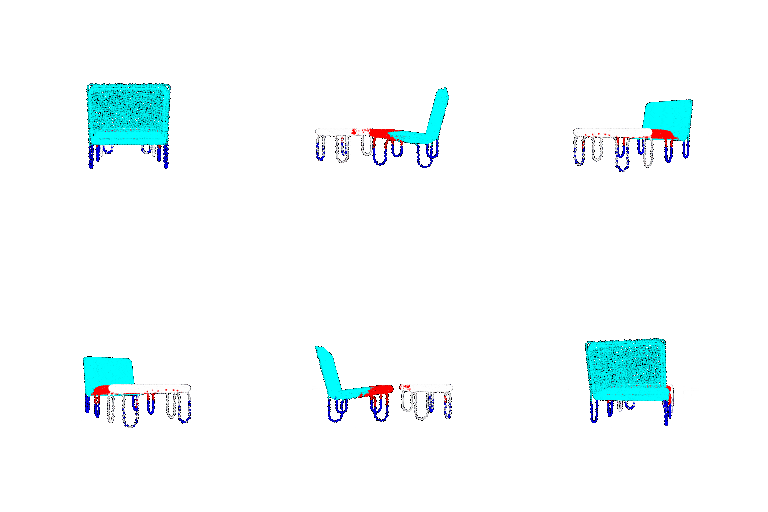
In addition to the 4 aforementioned classes, we see another class pop up in this example: seat footrest (white). In terms of predictions, we see that our model gets the general regions correct - it has seat cushion points mostly where the seat cushion is, footrest points mostly where the footrest points are, etc. However, we do again see a little bit of bleeding between boundaries -- the seat back bleeds into the cushion, the cushion bleeds into the footrest, etc. Aside from the few seat legs points placed on the footrest (which could just be due to how similar the footrest and seat legs are), this would seemingly indicate that our model still has some struggles in properly delineating boundaries between different regions of a chair.
| Ground Truth | Predicted | Accuracy |
|---|---|---|
 |
 |
96.3% |
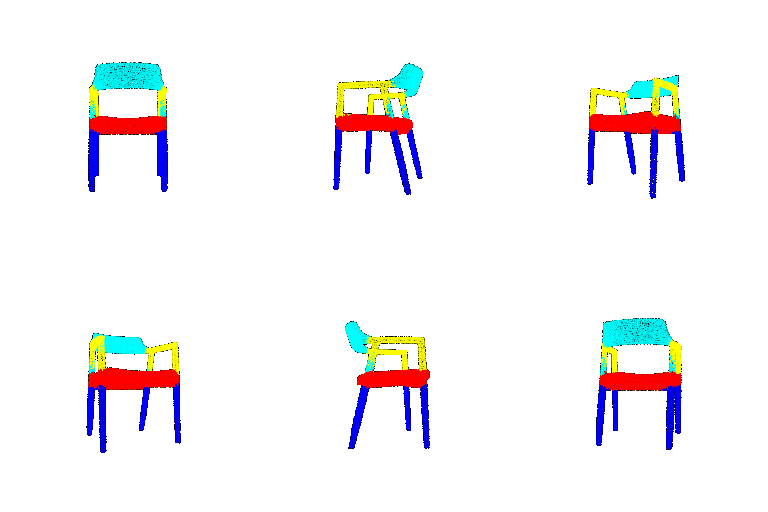
This example is a little interesting in that it has the seat back elevated a little higher than usual, starting from the armrests rather than from the seat cushion. Here, we see that our model gets it mostly right - the only major noticeable mistake are the bits of cyan [seat back] on the bottom of the armrests, which may be due to, as mentioned, the seat back usually starting from the cushion in most chairs. Other than that, the relative correctness of the other regions would suggest that our model has, at the very least, learned how to segment these more "standard" chairs well.
Bad Predictions
| Ground Truth | Predicted | Accuracy |
|---|---|---|
 |
 |
51.92% |
One trend that pops up in many of the models' bad predictions is its lack of prediction of the seat headrest class (pink). We see that in this example, where every headrest point in the ground truth has been mispredicted as seat back. If I had to guess, since seat headrest doesn't seem to be a very common class in the dataset (most of the examples I visualized didn't have one), plus it's somewhat harder for me, a human, to intuitively differentiate from a seat back, the model may have not have gotten sufficient learning signal for headrest points, plus it may not have extracted a good set of features that might help differentiate headrest vs. seat back points. Beyond headrest points, much of the seat armrest and back have been mispredicted as seat cushion, particularly the points in the armrest/back that fall in the same height range as the seat cushion's points. In a lot of "standard" chairs, the seat armrests and back begin at the level of the seat cushion (as can be seen in some of the good predictions above); thus, the model may have learned to associate lower points with seat cushion/legs, and thus been lead astray in this instance.
| Ground Truth | Predicted | Accuracy |
|---|---|---|
 |
 |
51.34% |
With the previous example, I mentioned how the model may have overindexed on "lower points = legs/cushion, higher points = back/armrest" when making predictions; we see something similar here, where the model predicts all points below the height of the seat cushion as seat leg, when in reality they are classified as armrest or back in the dataset. I will note that this classification is somewhat dubious to me, a human, as intuitively, I would probably make a similar prediction as the model with respect to the seat legs; that said, I assume a similar classification schema would've been seen in the training set, hence this is just a bad prediction. Beyond the legs, we also see significant mispredictions of seat back and seat armrest on the small pillow atop the seat cushion. I would say that intuitively, that part of the seat strikes as "back" more than "cushion", yet the ground truth classifies it as "cushion"; nevertheless, the presence of multiple classes within a single region of the object suggests to me that the model may not have seen many instances like this one in the training and thus got "confused" in the evaluation.
Q3. Robustness Analysis
Experiment 1: Rotation
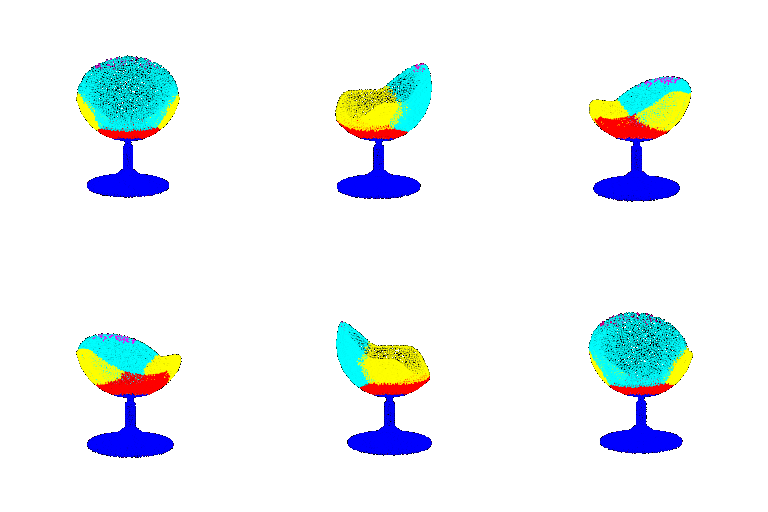
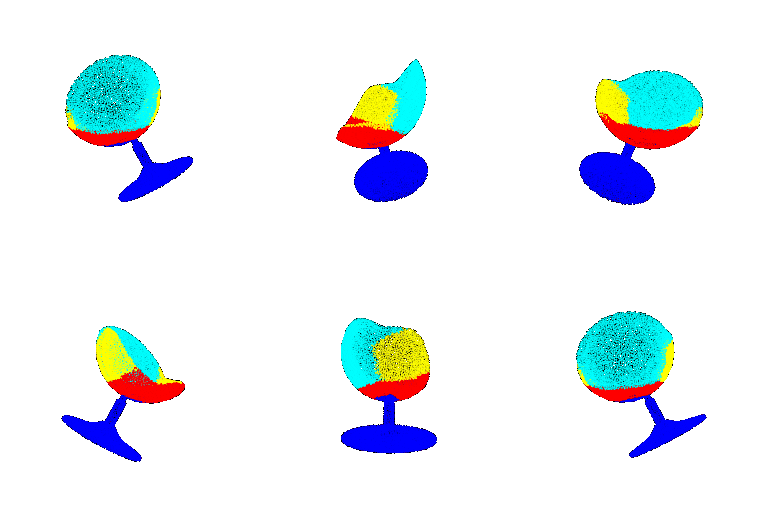
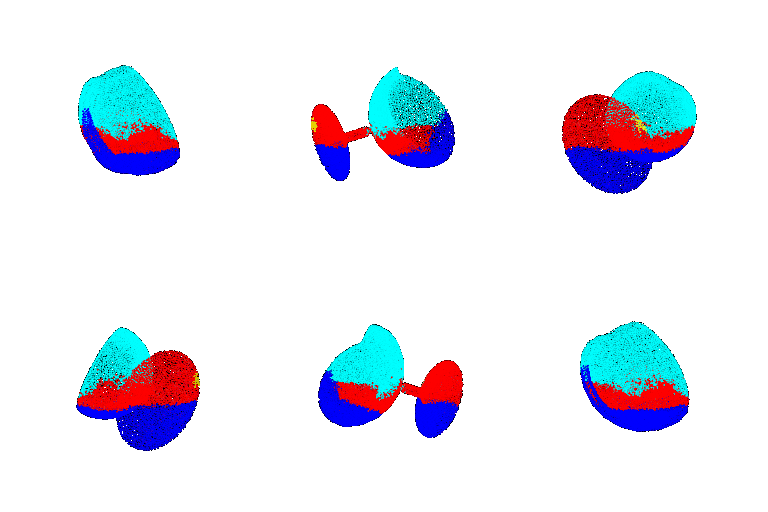
For the first experiment, I applied random rotations of $N$ degrees to each input cloud (where $N$ is a user parameter) and looked at the classification & segmentation results. More specifically, to generate random rotations, I first generated a random rotational axis for each element by normalizing a 3-vector via Gaussian noise. (I did not exclude the yaw axis.) Together with the rotation angle $N$, this axis was then used to parametrize an axis-angle representation of rotation. The axis-angle representation was promptly converted to a rotation matrix and directly multiplied with the point cloud, corresponding to a rotation about the origin.
Results
| Task | $0^\circ$ (Q1/Q2) | $15^\circ$ | $30^\circ$ | $60^\circ$ | $90^\circ$ |
|---|---|---|---|---|---|
| Classification Accuracy | 0.934 | 0.884 | 0.766 | 0.424 | 0.341 |
| Segmentation Accuracy | 0.888 | 0.831 | 0.728 | 0.541 | 0.372 |
Numbers-wise, we see a signficant falloff in the accuracy on both tasks with even just a minor rotation of $15^\circ$, with said falloff increasing with larger rotations. An interesting note to make is that segmentation accuracy actually beats out classification accuracy on the $60^\circ$ condition, where segmentation falls behind on smaller rotations; however, as mentioned in the segmentation visualizations below, I'm not sure this reflects the model being more robust, as much as it reflects the fact that on any given point cloud, the segmentation model can score "partial credit", whereas the classification result is either 0 or 1.
Visualization
| Example 1 | Example 2 | Example 3 | |
|---|---|---|---|
| True Class | Chair (0) |
Vase (1) |
Lamp (2) |
| $0^\circ$ Visualization |  |
 |
 |
| $0^\circ$ Predicted Class | Chair (0) |
Vase (1) |
Lamp (2) |
| $15^\circ$ Visualization |  |
 |
 |
| $15^\circ$ Predicted Class | Chair (0) |
Chair (0) |
Vase (1) |
| $30^\circ$ Visualization |  |
 |
 |
| $30^\circ$ Predicted Class | Chair (0) |
Vase (1) |
Vase (1) |
| $60^\circ$ Visualization |  |
 |
 |
| $60^\circ$ Predicted Class | Vase (1) |
Chair (0) |
Vase (1) |
| $90^\circ$ Visualization |  |
 |
 |
| $90^\circ$ Predicted Class | Lamp (2) |
Vase (1) |
Vase (1) |
We can see with the above examples that classification accuracy noticeably degrades with rotation magnitude, as all of the above examples are misclassified under a $60^\circ$ rotation. Some observations:
The chair category seems more robust to rotation than the vase or lamp categories -- the vase and lamp examples are misclassified under only a $15^\circ$ rotation, whereas the chair example is correctly classified up to $30^\circ$. It's possible that this is just due to bad luck in the samples used, but I would guess that since the vase and lamp categories seem to have more similar shapes to each other than they do to the chair category, the chair category is thus more "distinct" in a way that the model can leverage to make better predictions, even under worse conditions [larger rotation].
Many examples are misclassified as vases, and a few as chairs, but only one example is misclassified as a lamp. Although this is, of course, possibly just down to luck of the draw, I wonder if this might reflect either (a) some kind of class imbalance in the training dataset, or (b) a much narrower profile of lamp shapes in the dataset as compared to vases.
Looking at the $90^\circ$ predictions, my guess at the lamp classification for the chair example is that the shape vaguely resembled that of a desk lamp. Regarding the vase and lamp predictions, my guess there is that a flatter, wider shape is somehow associated with "vase" in the model. In a similar vein, looking at the lamp examples that are misclassified as chairs, I wonder if the model isn't associating an overall slightly-leaned-back shape with "chair".
| Example 1 | Example 2 | Example 3 | |
|---|---|---|---|
| $0^\circ$ Ground Truth |  |
 |
 |
| $0^\circ$ Segmentation | 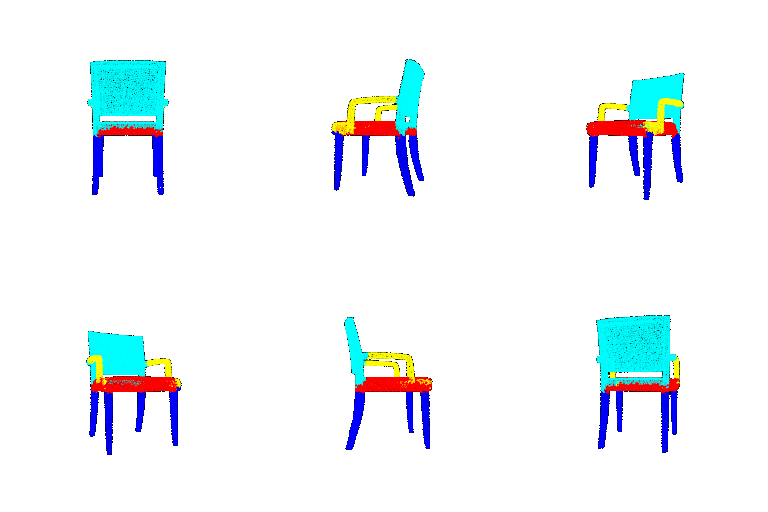 |
 |
 |
| $0^\circ$ Accuracy | 0.939 | 0.943 | 0.909 |
| $15^\circ$ Ground Truth |  |
 |
 |
| $15^\circ$ Segmentation |  |
 |
 |
| $15^\circ$ Accuracy | 0.771 | 0.833 | 0.896 |
| $30^\circ$ Ground Truth |  |
 |
 |
| $30^\circ$ Segmentation | 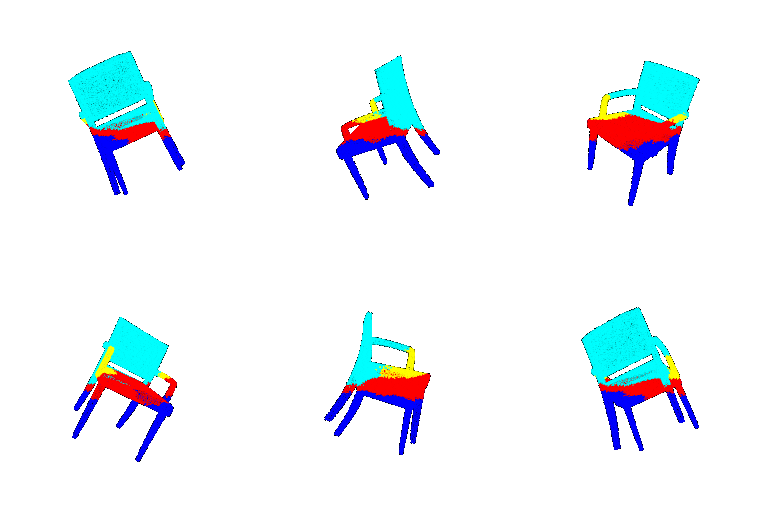 |
 |
 |
| $30^\circ$ Accuracy | 0.695 | 0.768 | 0.822 |
| $60^\circ$ Ground Truth |  |
 |
 |
| $60^\circ$ Segmentation | 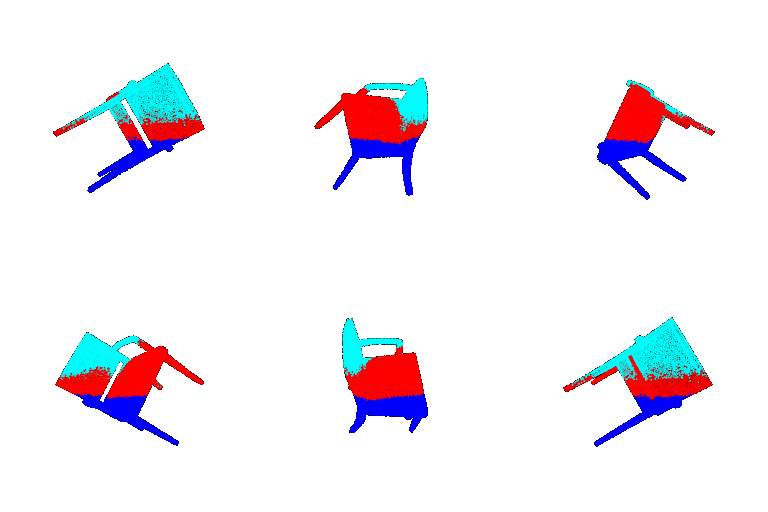 |
 |
 |
| $60^\circ$ Accuracy | 0.555 | 0.543 | 0.551 |
| $90^\circ$ Ground Truth |  |
 |
 |
| $90^\circ$ Segmentation | 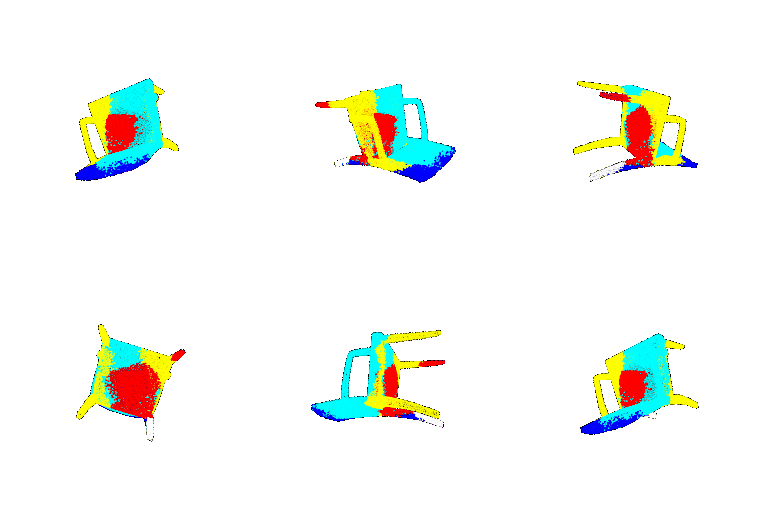 |
 |
 |
| $90^\circ$ Accuracy | 0.414 | 0.427 | 0.319 |
Looking at these results, one big thing that stands out to me here is that the model has absolutely learned some kind of relation between a point's height and its class. Looking at the last example in the last row, for instance, we see that lower points are classified as seat leg, points just above that are seat cushion, and points above that are seat back, even if these classes are both completely wrong and seem to completely ignore other aspects of the shape's geometry.
Experiment 2: Additive Noise
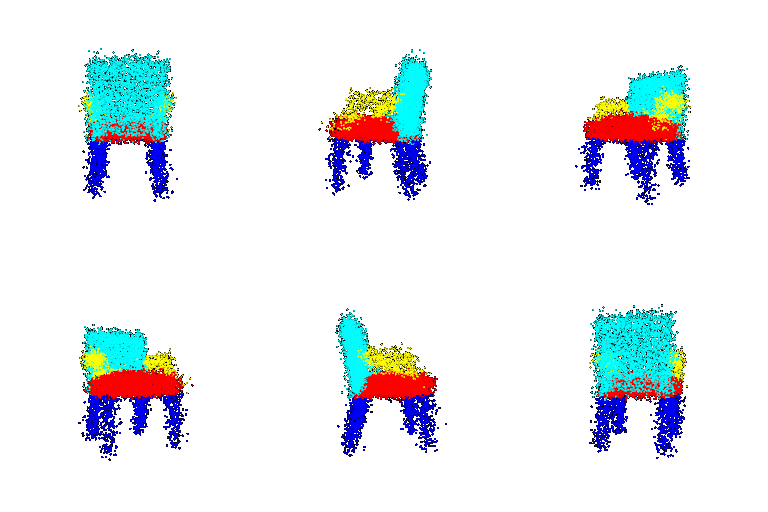
For the second experiment, I experimented with adding random additive noise (of varying magnitude) to the input point clouds in order to see how robust the model was to perturbations of the input points. The noise was generated as individual Gaussian samples of mean 0 and standard deviation \sigma (parameter) for each element of the point cloud tensor.
| Task | std=0.0 (Q1/Q2) |
std=0.05 |
std=0.1 |
|---|---|---|---|
| Classification Accuracy | 0.934 | 0.923 | 0.872 |
| Segmentation Accuracy | 0.888 | 0.857 | 0.785 |
Visualization
| Example 1 | Example 2 | Example 3 | |
|---|---|---|---|
| True Class | Chair (0) |
Vase (1) |
Lamp (2) |
0.0 Visualization |
|
|
|
0.0 Predicted Class |
Chair (0) |
Vase (1) |
Lamp (2) |
0.05 Visualization |
 |
 |
 |
0.05 Predicted Class |
Chair (0) |
Vase (1) |
Vase (1) |
0.1 Visualization |
 |
 |
 |
0.1 Predicted Class |
Chair (0) |
Vase (1) |
Vase (1) |
Compared to rotation, our model seems to be more robust to perturbation. Both the chair and vase examples are correctly classified under both perturbation cases. In contrast, however, the lamp is misclassified under even only minor perturbation (the 0.05 case) - although this could just be bad luck in selection, it may be that we might be seeing the previously-mentioned concerns about class imbalance and/or the model having only learned to classify a very narrow set of shapes as "lamps".
| Example 1 | Example 2 | Example 3 | |
|---|---|---|---|
0.0 Ground Truth |
|
|
|
0.0 Segmentation |
|
|
|
0.0 Accuracy |
0.939 | 0.943 | 0.909 |
0.05 Ground Truth |
 |
 |
 |
0.05 Segmentation |
 |
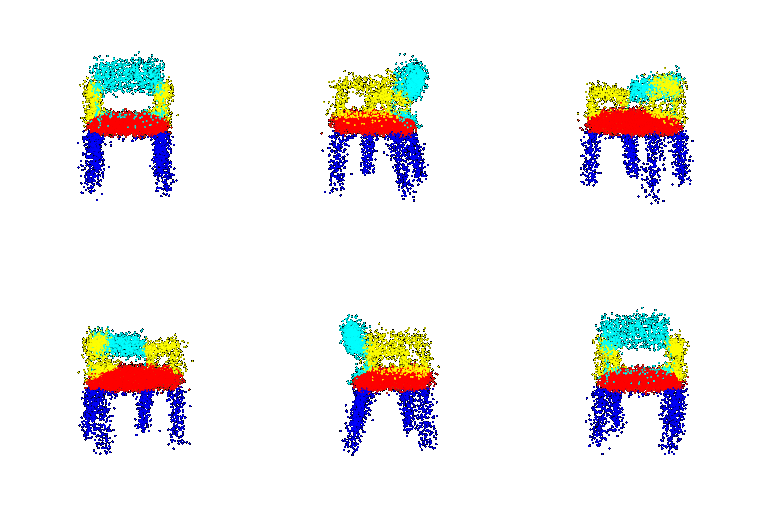 |
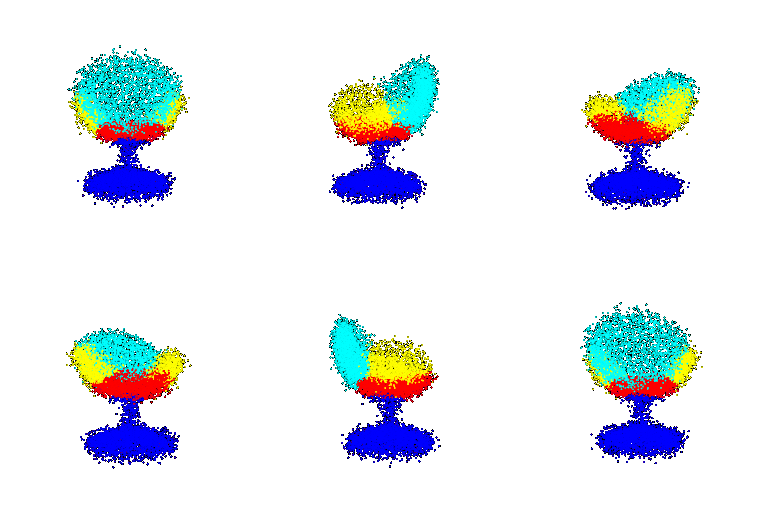 |
0.05 Accuracy |
0.854 | 0.919 | 0.853 |
0.1 Ground Truth |
 |
 |
 |
0.1 Segmentation |
 |
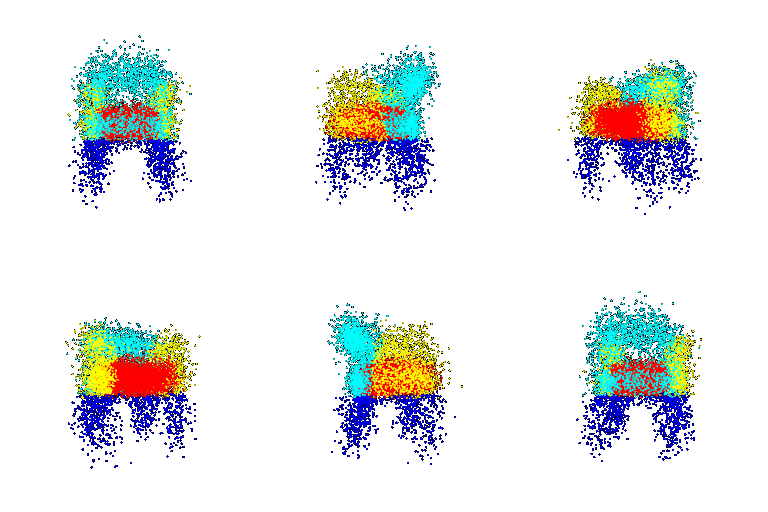 |
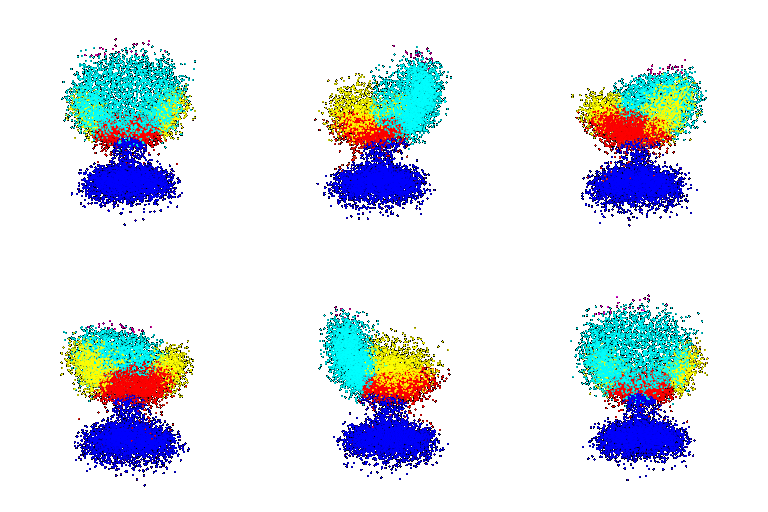 |
0.1 Accuracy |
0.827 | 0.742 | 0.872 |
Looking at the segmentation results, I would say that these also seem to suggest that our model is broadly robust to perturbation, as the accuracies are okay even under the stdev=0.1 case, and we see that the various chair regions are generally correctly classified (e.g. most seat leg classifications fall in the true seat leg region). We do definitely see a little "bleeding" between regions in the perturbed predictions, e.g. the seat armrest on the middle column is starting to take over parts of the seat cushion, but not much. More importantly, given that the perturbation of points does result in ground truth points from some classes entering regions mostly occupied by other classes, just judging by how well the model's predictions match up to ground truth may not be best measure of performance, as a seat leg point that has been perturbed into the seat cushion region, e.g., ought to be predicted as cushion (wrong, per G.T.) rather than seat leg (correct, per G.T.); that said, I don't have a better metric immediately available to me.
Q4. Bonus Question - Locality
The Model
For my model, I implemented (a slightly smaller version of) the Point Transformer. The underlying layer schemae are the same as in the original Point Transformer.
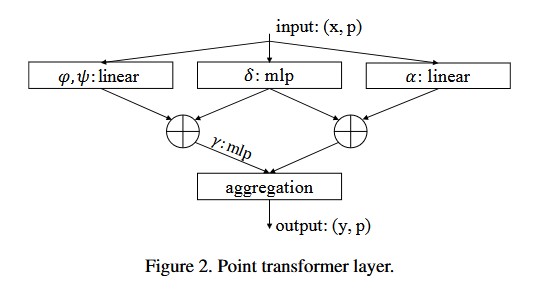
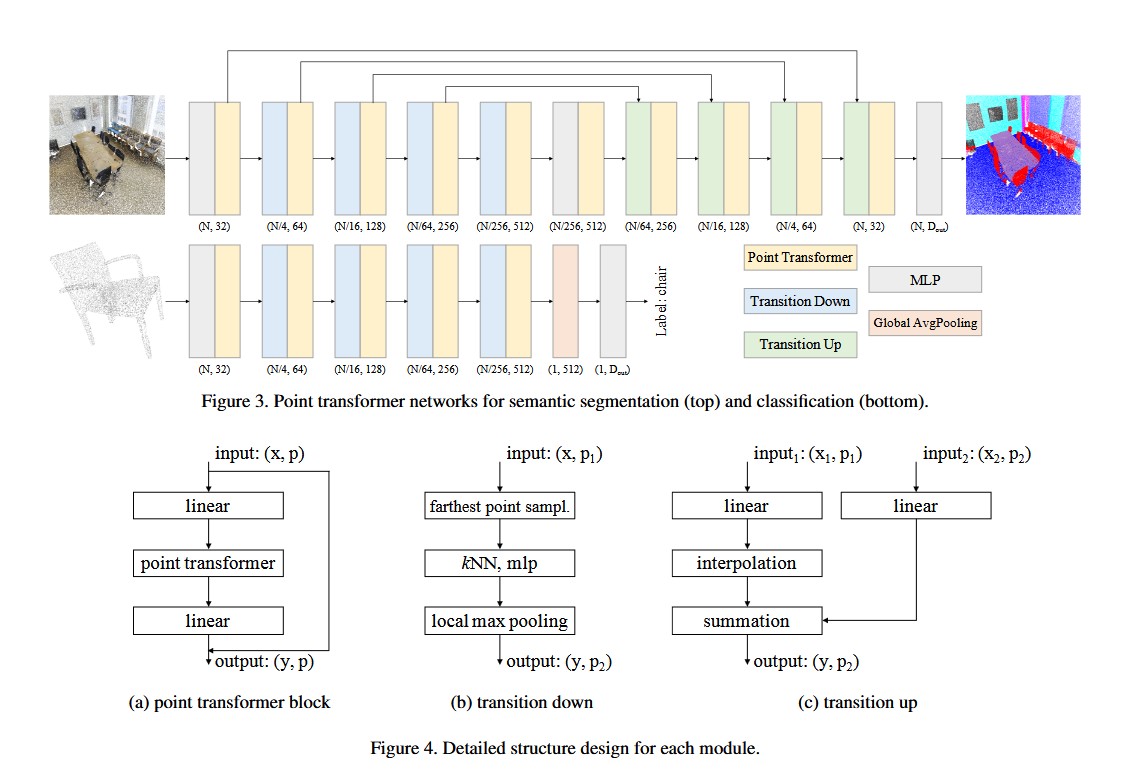
Images sourced from the original Point Transformer paper [1]
- The mapping function $\gamma$ in the point transformer layer was implemented as a linear layer + ReLU + a second linear layer.
- The MLP in the transition down block, plus the linear layers in the transition-up block, were all implemented as a linear layer + batchnorm + ReLU.
- $k=16$ was used for $kNN$ and in the point transformer layer, as in the original Point Transformer implementation.
- Interpolation was done as a weighted sum of the three closest neighbors to a point.
Compared to the above architecture, the only change I made was removing the innermost $256\to512$ dim. blocks in the segmentation and classification networks. The structures were otherwise kept the same - for the segmentation network, I simply changed the inner MLP dimension from 512 to 256 and removed the residual connection between the 256-dim transition layers to match, whereas for the classification network, I only had to change the output MLP dimension from 512 to 256.
[1] Zhao, H., Jiang, L., Jia, J., Torr, P. H., & Koltun, V. (2021). Point transformer. In Proceedings of the IEEE/CVF international conference on computer vision (pp. 16259-16268)
Results
Classification accuracy: 96.2% (0.9622245540398741)
Segmentation accuracy: 91.9% (0.9190687196110211)
| Task | PointNet (Q1/Q2) | PointTransformer (Q4) |
|---|---|---|
| Classification | 0.934 | 0.962 |
| Segmentation | 0.888 | 0.919 |
Classification Results
| Example 1 | Example 2 | Example 3 | |
|---|---|---|---|
| Visualization | |
|
|
| True Class | Chair (0) |
Vase (1) |
Lamp (2) |
| Q1/Q2 Pred. | Chair (0) |
Vase (1) |
Lamp (2) |
| Q4 Pred. | Chair (0) |
Vase (1) |
Lamp (2) |
The new model correctly classifies the mispredictions I highlighted in Q1:
| Example 1 | Example 2 | Example 3 | |
|---|---|---|---|
| Visualization | |
|
|
| True Class | Chair (0) |
Vase (1) |
Lamp (2) |
| Q1/Q2 Pred. | Vase (1) |
Lamp (2) |
Vase (1) |
| Q4 Pred. | Chair (0) |
Vase (1) |
Lamp (2) |
Segmentation Results
| Ground Truth | Q2 Predicted | Q4 Predicted | Q2 Accuracy | Q4 Accuracy |
|---|---|---|---|---|
|
|
 |
93.01% | 97.06% |
|
|
 |
83.1% | 98.56% |
|
|
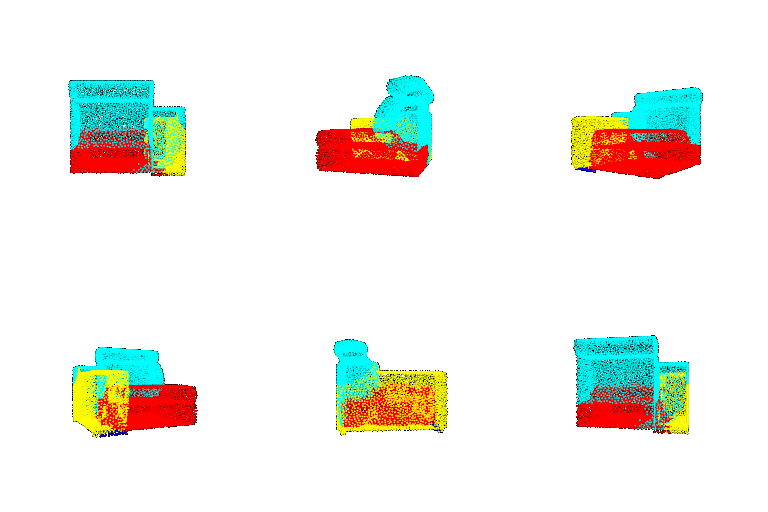 |
51.92% | 63.61% |
|
|
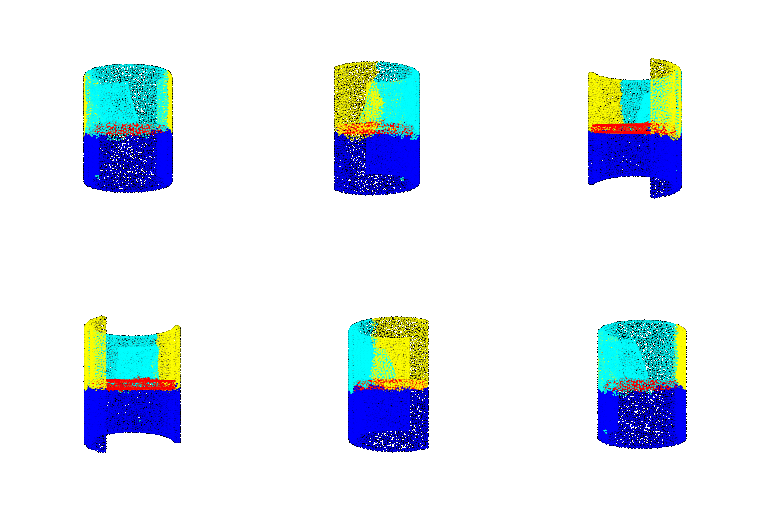 |
51.34% | 49.31% |
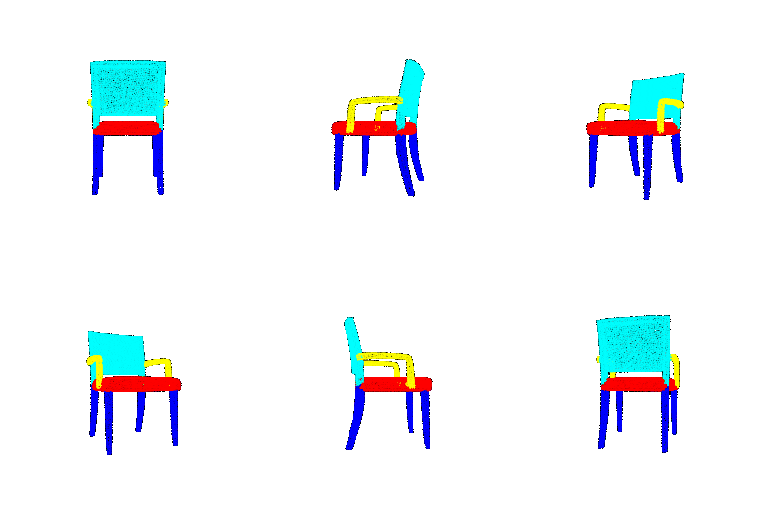
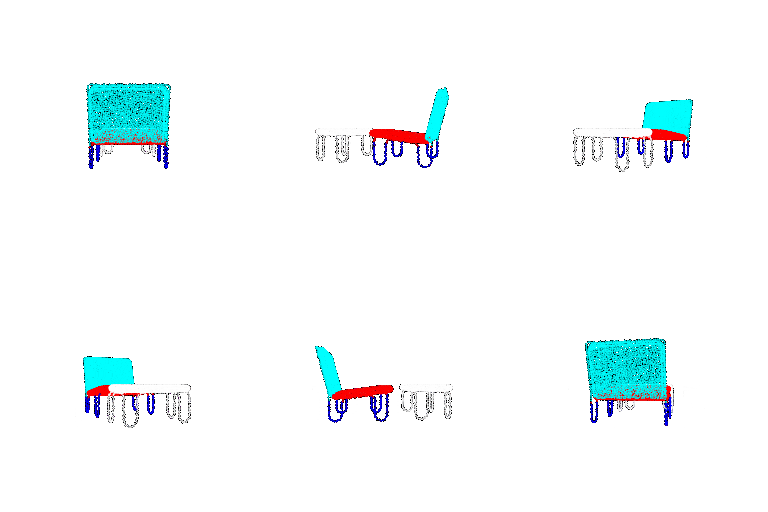
Compared to our Q2 results, our Q4 model seems to be much better at distinguishing the boundaries between classes. Looking at the first two examples, for instance, the Q2 model got it "mostly right", but had regions where it looked like one category was "bleeding into" another (e.g. cyan into red at the back of the first example, or yellow into red at the front of the first example). In contrast, the Q4 model has much cleaner boundaries, which we can see reflected in the higher accuracy. Regarding the last two examples (our "bad predictions" from Q2), we can see that our Q4 model still has issues. For the third example, I'm guessing that the headrest class imbalance that I speculated was present in the training data in Q2 is once again plaguing our Q4 model. For the fourth example, the Q4 model has completely predicted the back cushion as "seat back" [cyan], rather than the "seat cushion" [red] the ground truth is asking for, hence the lower accuracy of the Q4 model compared to the Q2 model; however, in this case, I'd actually side with the model over the ground truth here and say that that region of the seat would make more sense as "seat back" rather than cushion.