1. Exploring loss functions
1.1. Fitting a voxel grid
Loss used: binary cross-entropy loss with pos_weight=3 (3x weight for positive examples)
Ground truth (left) vs fitted (right)



1.3. Fitting a mesh
Loss used: Pytorch3d's mesh_laplacian_smoothing
Ground truth (left) vs fitted (right)

2. Reconstructing 3D from single view
2.1. Image to voxel grid

During my first attempt at training the model, I had a major issue with my learned model over-predicting unoccupied voxels, with several image inputs even returning completely unoccupied predictions under an 0.5 occupancy threshold. To rectify this, I multipled the weight of positive examples by 3x in my loss function and retrained the network, solving the issue.
Note: I used upsampling + Conv3D layers, rather than straight convolutional layers, in an attempt to decrease training time, as I encountered issues with training taking a very long time on my personal machine early on. I would later find out that this was somehow an issue related to memory and the speed of loading training examples, but by this point, I had already trained the network.
# iterations: 20,000
Predictions
Input images:


Ground truth mesh vs. predicted voxels ($p>0.7$):

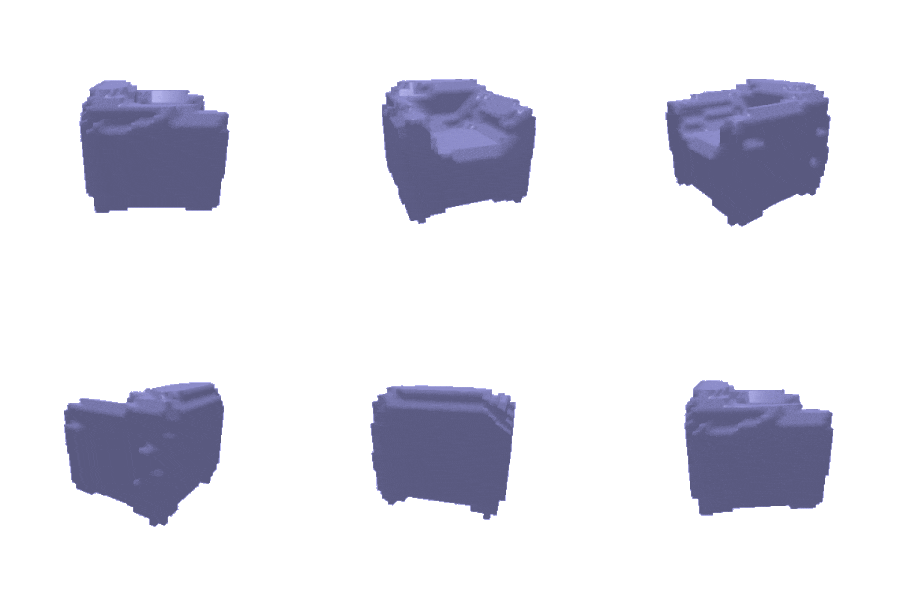
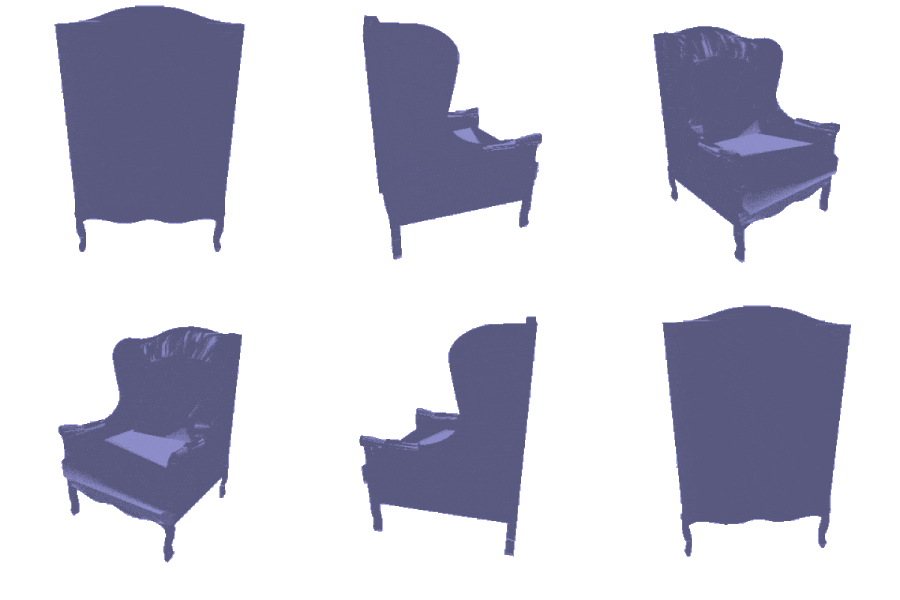
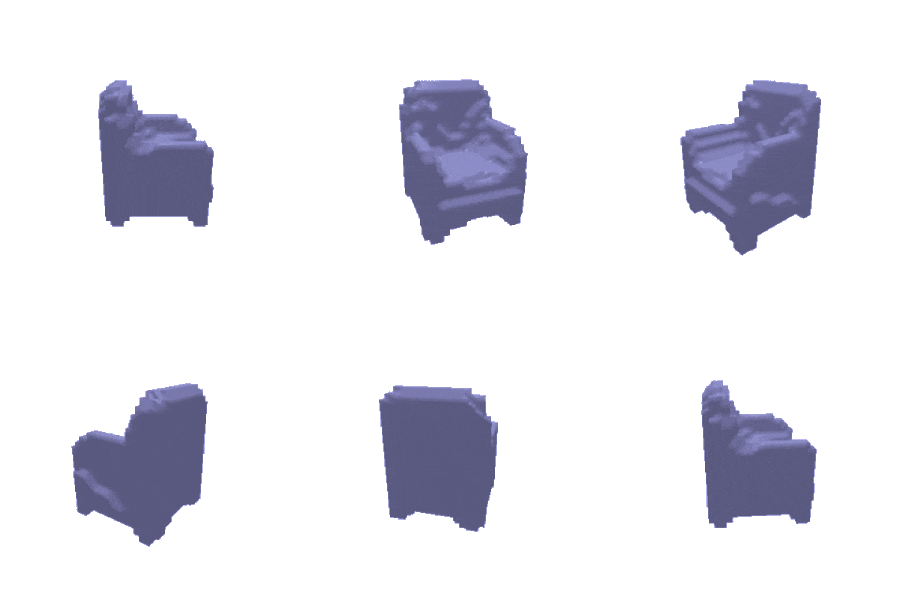
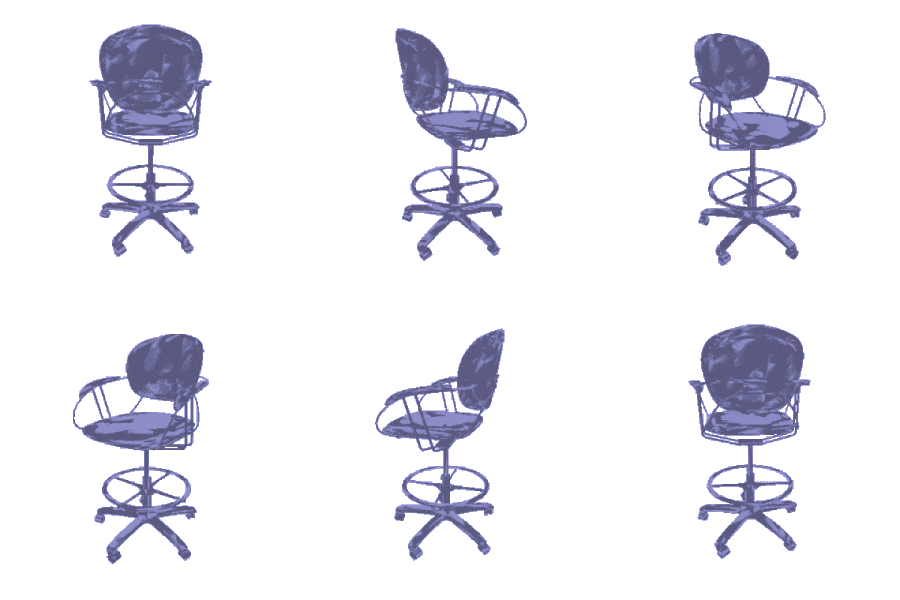
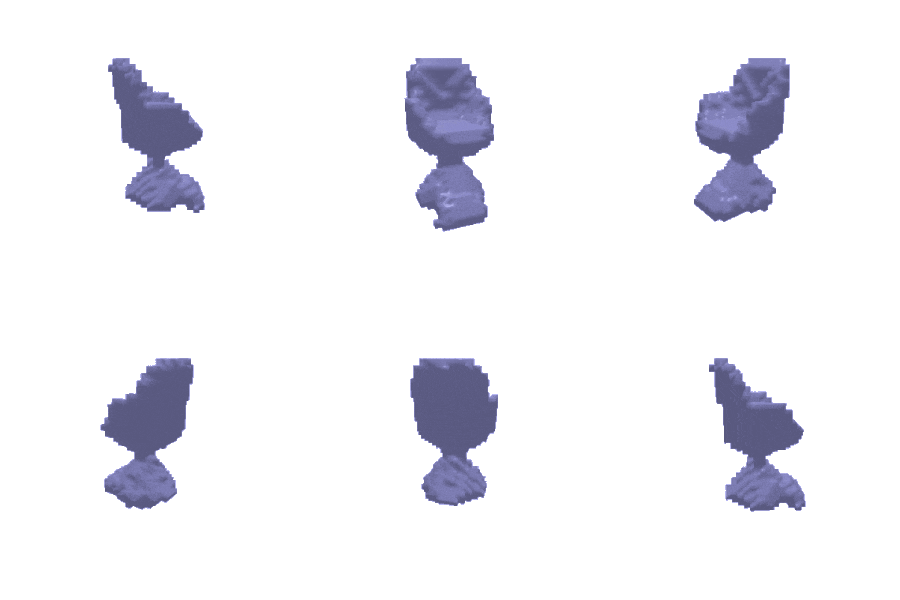
($\ast$) Note on scale: the voxel outputs are slightly further from the camera to prevent going off-screen, hence why they appear smaller.
Looking at (1), we see that most of the chair is represented, but the legs are difficult to make out, and the overall geometry of the voxel output is a lot rougher. With respect to the legs, it's hard to tell if the legs are being under-predicted, or the bottom of the chair is being oevr-predicted.
In the case of (2), we see that the model noticeably misses in representing the height, armrests, and - to a lesser extent - the legs of the chair. The incorrect height is surprising to me, since (as we'll see later) the other networks I trained were all fine on dimensions, for the most part; that said, what the render looks like is dependent on the occupancy threshold used. It's also worth noting that the prediction for (2) looks somewhat like the prediction for (1), which could indicate that the network is lacking in representational capacity.
For (3), although the overall shape of the chair is ~roughly~ depicted, the output is again seemingly too short (this time on the legs). Furthermore, none of the holes in the input image are captured. Granted, the voxel resolution is somewhat low here, but this may indicate that the model isn't yet good enough to represent fine detail and may need to be made larger/deeper, or simply train longer.
(Note: More renders are discussed in 2.5)
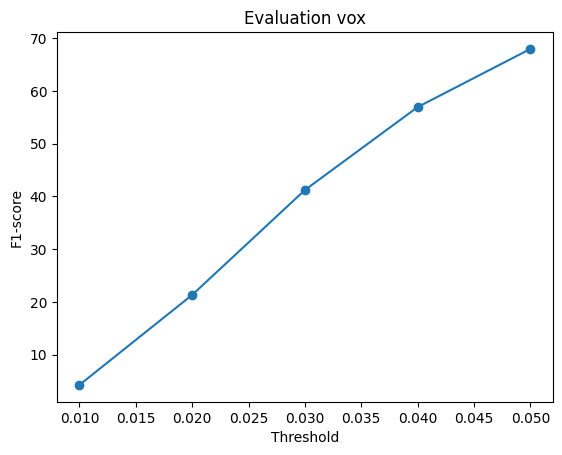
F1 Score
F1@0.05 score:
isovalue=0.5: 64.822isovalue=0.7: 67.951
2.2. Image to point cloud
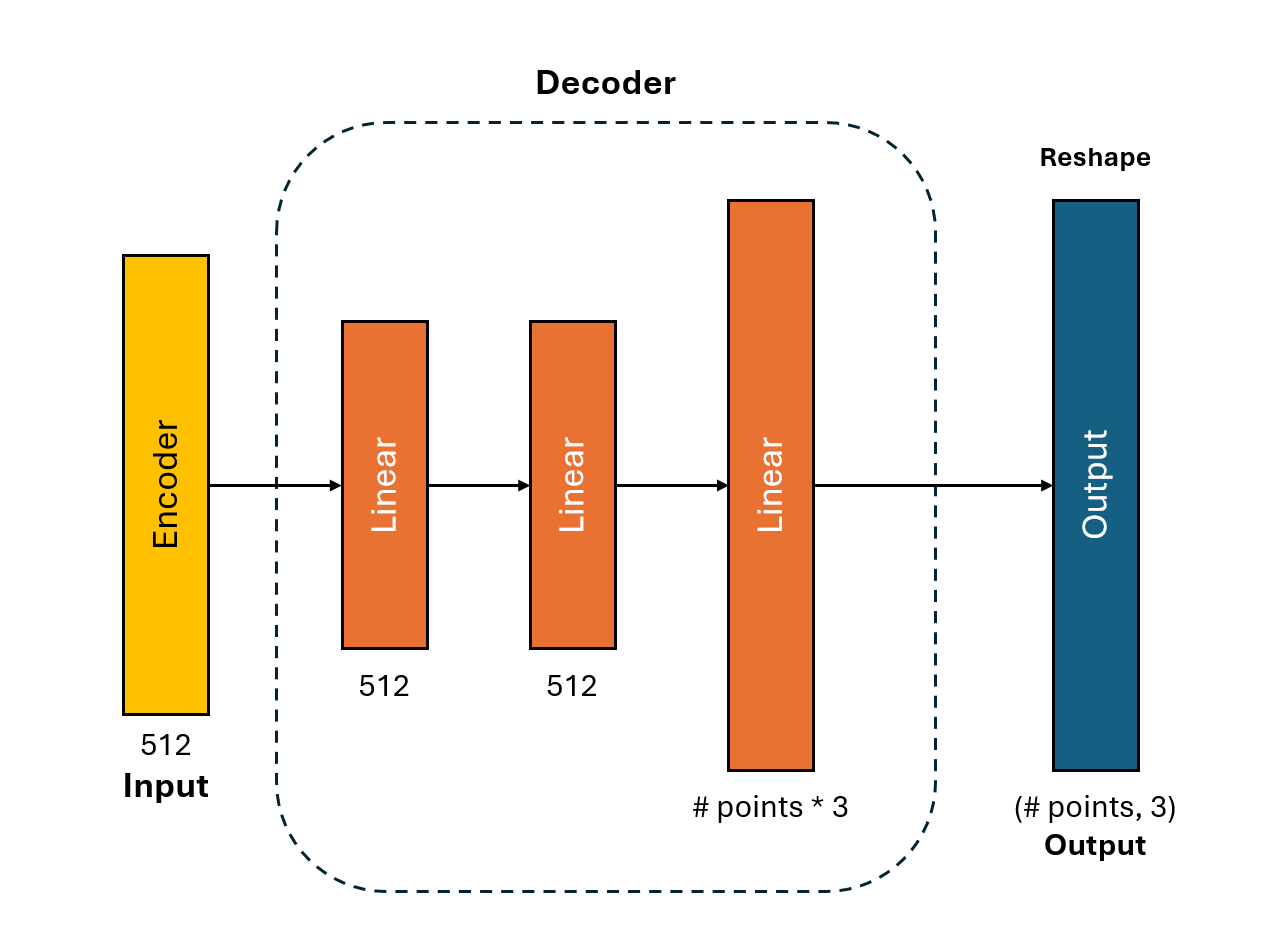
The same architecture was used for both the image-to-pointcloud and image-to-mesh problems. Initially, I had a much larger network with more & larger layers; however, I ran into issues with training taking a long time, so I ended up cutting back on both layer size and # layers to try and speed up the training process. I soon figured out that the issue with training was somehow down to a bottleneck in the speed of loading training data (?), so I could've gone with a larger network, but the results with the smaller network looked fine enough such that I didn't retrain it.
- # iterations: 16,000
n_points: 1000
Predictions
Input images:

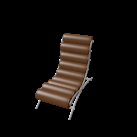

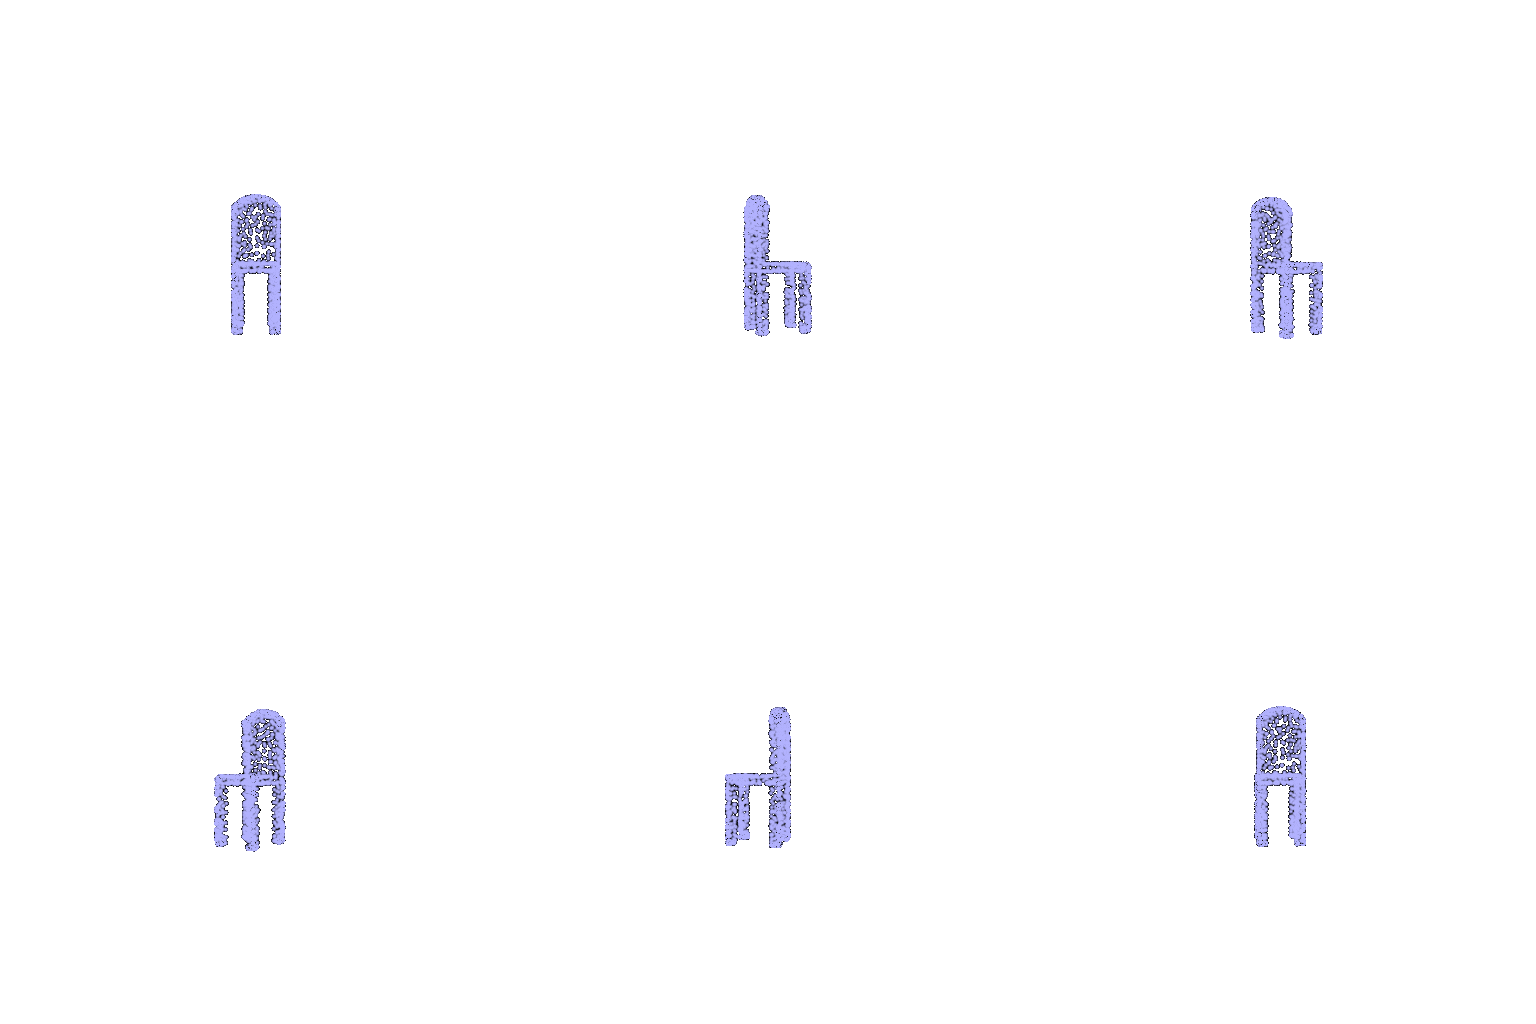
Ground truth mesh vs. predicted points ($n=1000$):
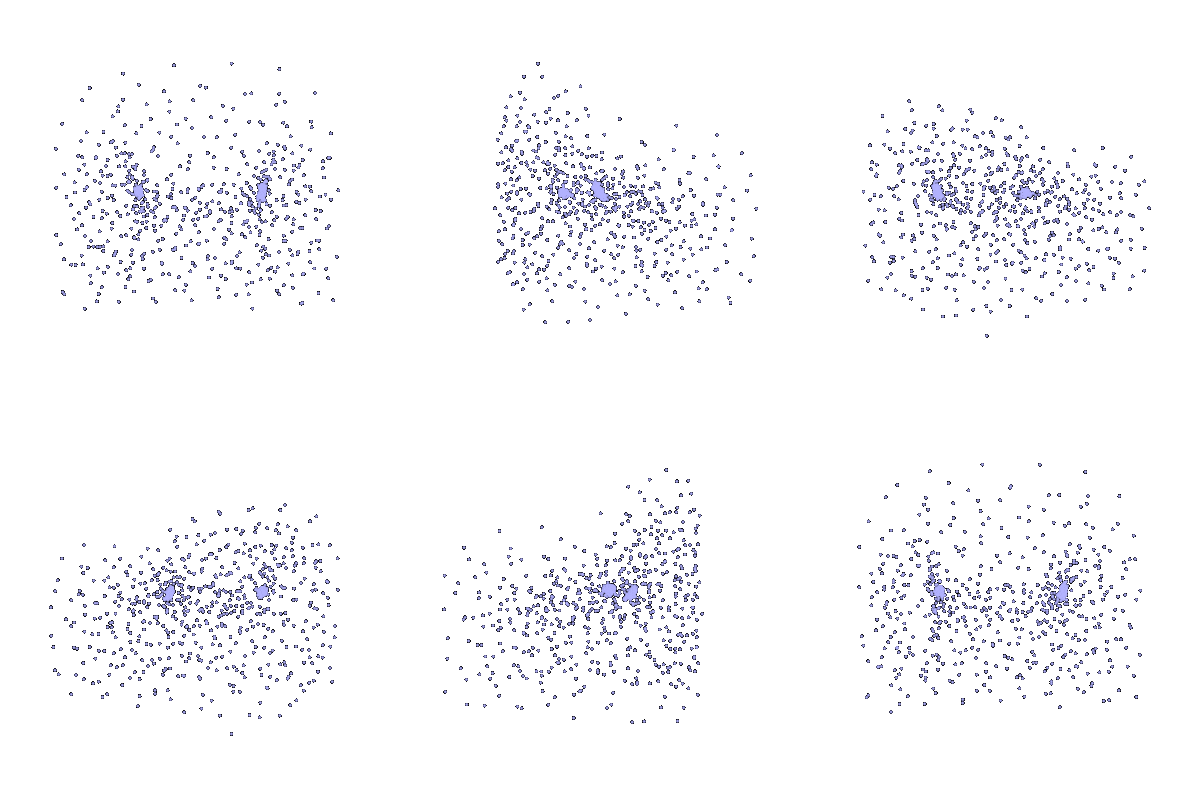
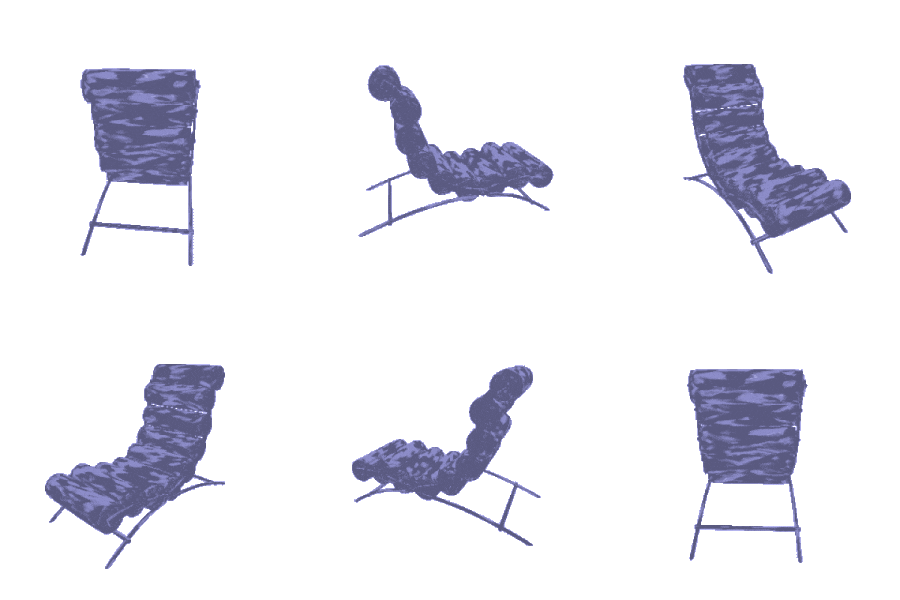
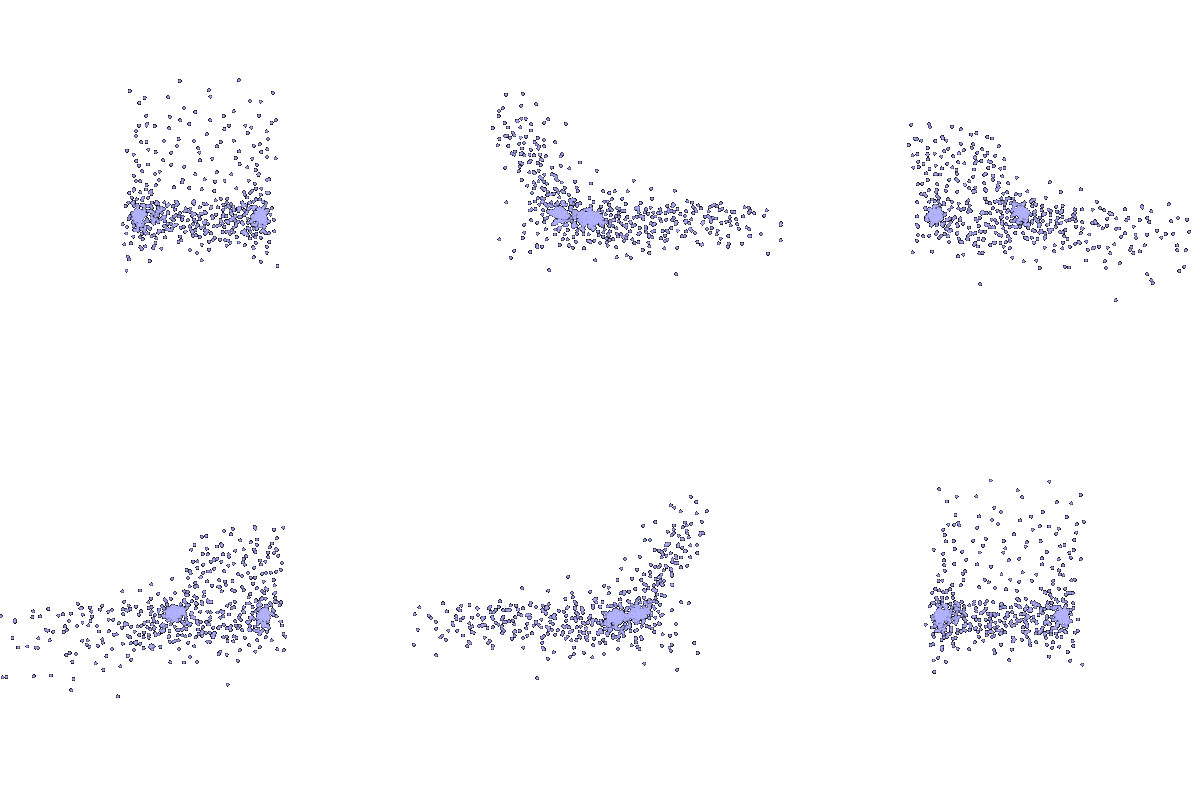
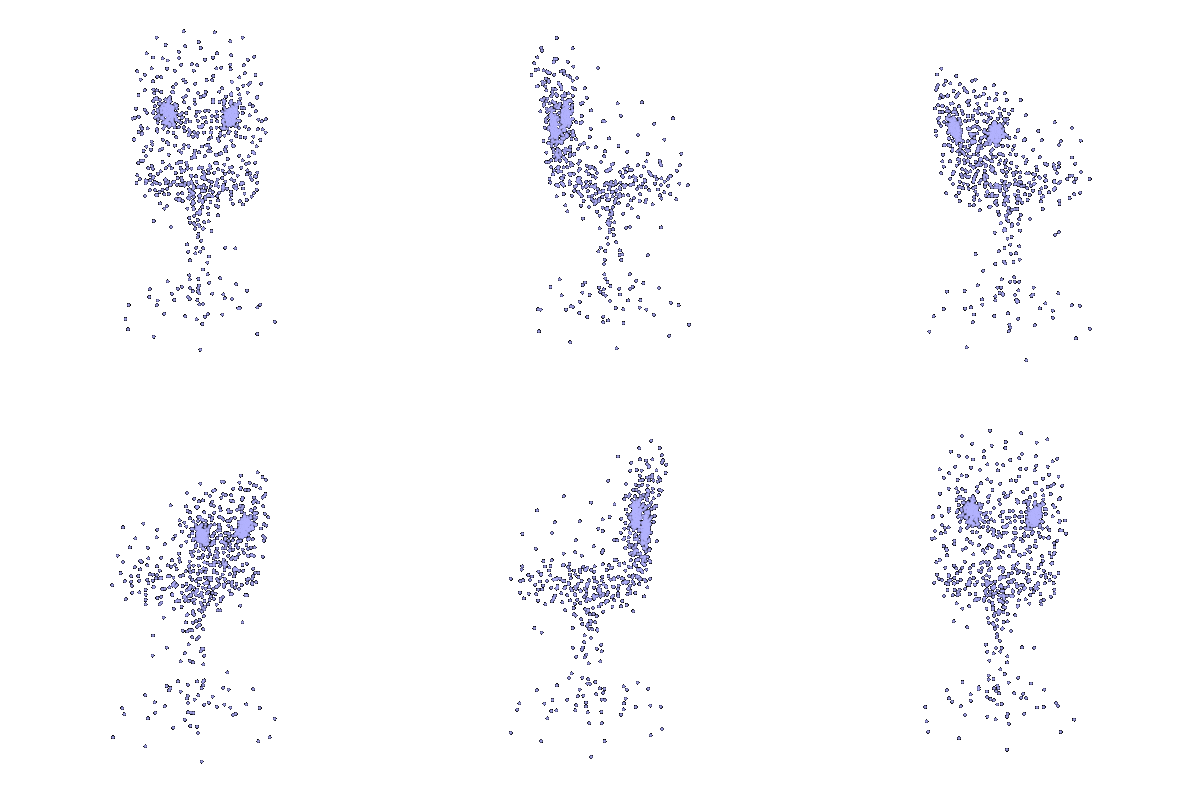
In the case of (1), we see that although the bulk of the chair appears to be represented, the legs are notably missing. For (2) and (3), the general shape of the chair, dimensions, holes, etc. do seem to be represented pretty well; that said, the low number of points makes it difficult to determine whether the finer details (e.g. the bottom rails for (2), or the armrests and center disk for (3)) are being represented. There also appears to be quite a bit of noise in general w.r.t. point placements.
Interestingly, all 3 network outputs have 2 notable clusters of points around the center of the seat back. My hypothesis is that this might just be points that the network didn't learn to put anywhere else -- the objective for the point cloud network was chamfer loss, which doesn't significantly punish extra points so long as those points are near points in the other set, so it may have been easier for the network to learn to concentrate points near a region of "expected" ground truth points vs. spreading out those points. if I had to guess, some change to the loss function could help this; alternatively, just training more/having larger intermediate layers might help as well.
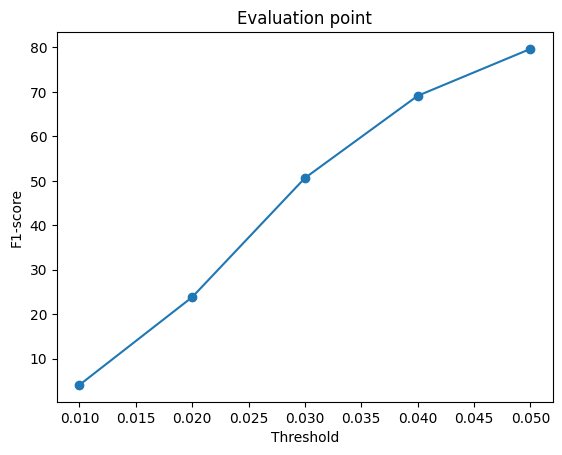
F1 Score
F1@0.05 score: 79.651
2.3. Image to mesh
The same architecture was used for both the image-to-pointcloud and image-to-mesh problems. (This model, too, was cut down in size while I was trying to debug the same issue with training times.) For image-to-mesh, the number of output points was simply the number of vertices in the base mesh.
- # iterations: 20,000
w_smooth: 0.1- Base mesh:
ico_sphere
Predictions
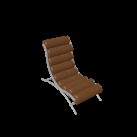
Input images:


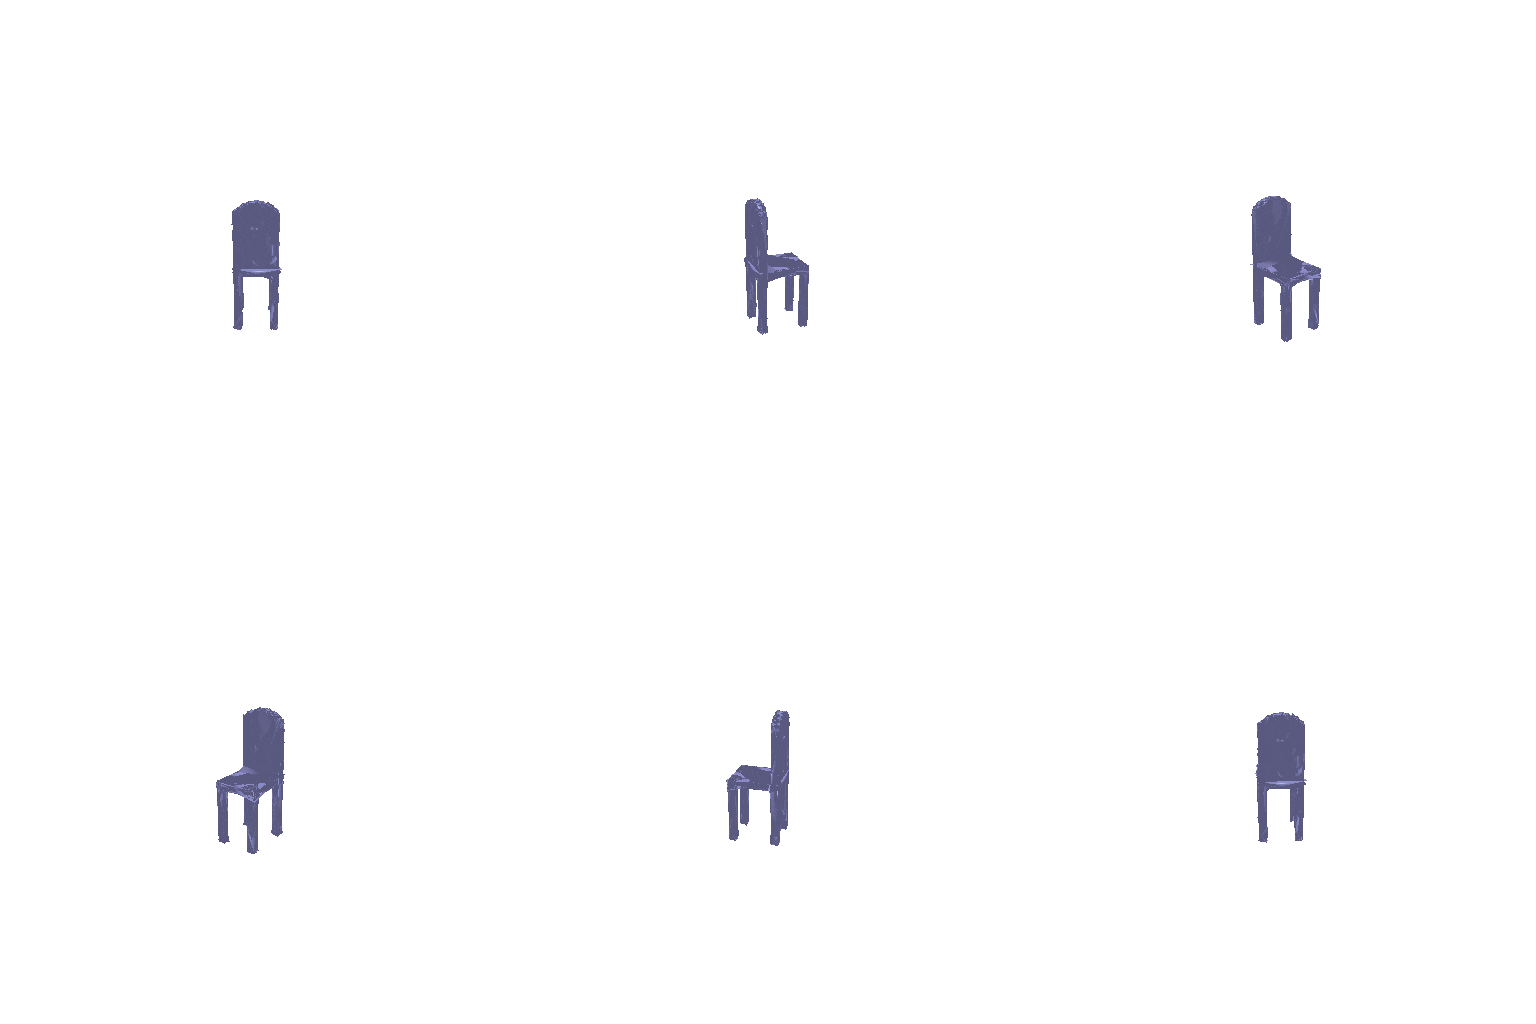
Ground truth mesh vs. predicted mesh:
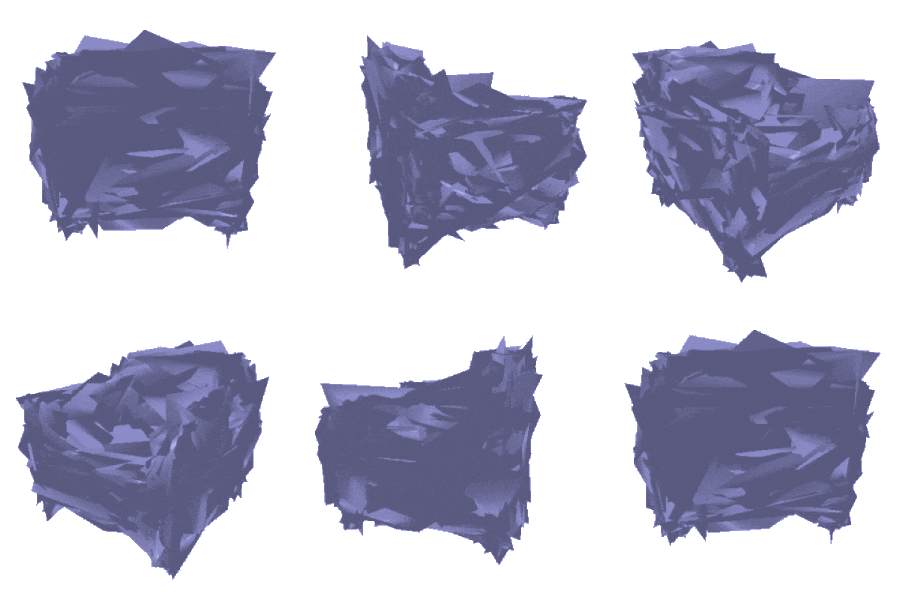
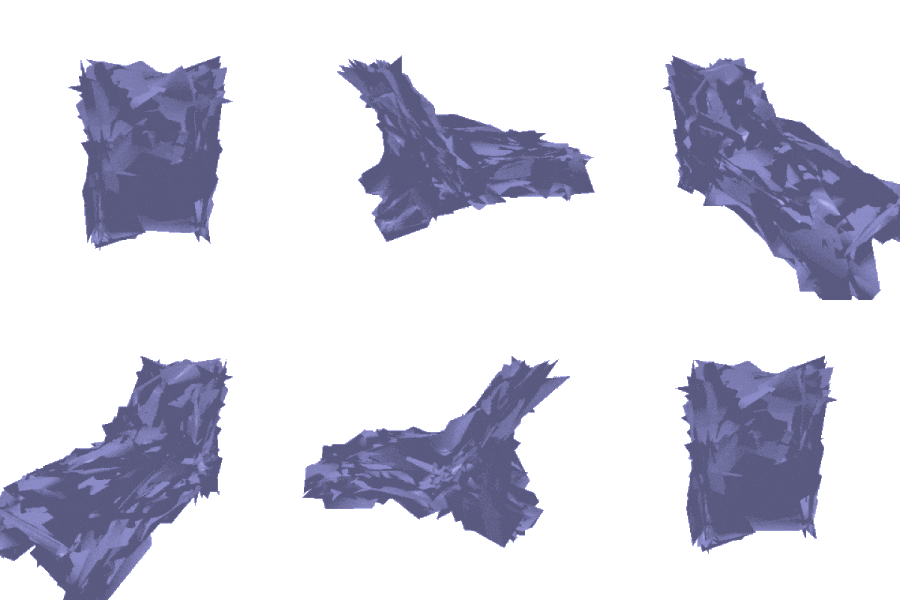
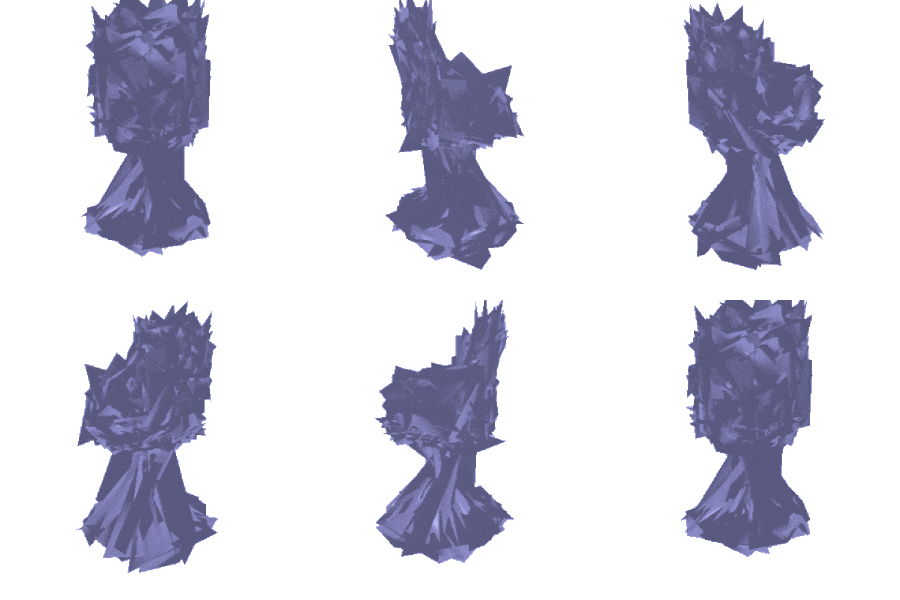
All 3 meshes look pretty garbled and non-smooth, possibly indicating that a higher value of w_smooth might be beneficial. (1) is probably closest to the ground truth, possibly due to the simpler geometry. For (2) and (3), we see that the model does seem to approximate the general outlines of both pretty well -- this may be the effect of the chamfer loss, which should move the vertices of the output mesh towards those of the ground truth meshes. At the same time, however, we see that the mesh is unable to properly represent the holes in both models. In fact, the network outputting vertices around holes results in majorly malformed meshes, as the triangles are sort of stretched out across said holes.
Naturally, possible solutions would be (a) replacing ico_sphere with a different base mesh, or (b) using some piecewise approach that can adapt to the predicted geometry.
F1 Score
F1@0.05 score: 74.967
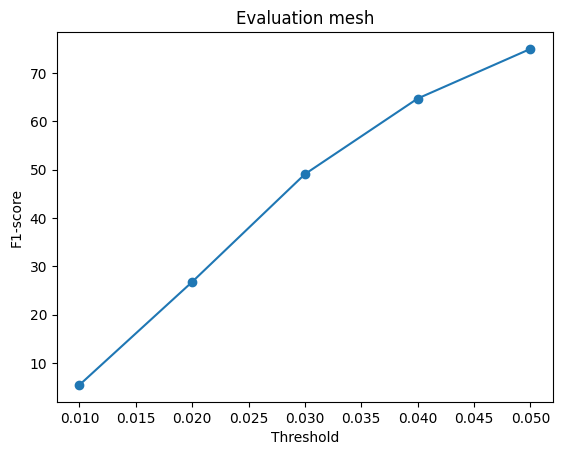
Voxel vs. Point Cloud vs. Mesh Comparison
| # iterations | F1@0.05 | |
|---|---|---|
| Voxel | 20,000 | 67.951 |
| Point Cloud | 16,000 | 79.651 |
| Mesh | 20,000 | 74.967 |
The voxel network ends up having the lowest F1@0.05 score (though it's worth noting that this score is dependent on the occupancy threshold used during the evaluation process), with the mesh being second-highest, and the point cloud the highest.
Intuitively, it makes sense that the point cloud is the highest. F1@0.05 measures what percentage of points in each set (GT & predicted points) have a point from the other set within a distance of 0.05. This is very similar to chamfer loss, the loss function used by the point cloud network, which attempts to minimize the distance from each point in the GT set to its nearest point in the predicted set and vice versa. As such, the point cloud network -- which uses only chamfer loss as its loss function -- can be seen as the network that most directly optimizes F1@0.05, whereas the mesh network (which also utilizes chamfer loss) is less direct in optimizing F1@0.05 due to also having to take into account mesh smoothness. Finally, the voxel network is the least direct of the three in that it optimizes an entirely different metric altogether (cross-entropy loss), hence the lower F1@0.05.
2.4. Analyse effects of hyperparams variations
One hyperparameter I looked at was the weight of positive examples, pos_weight, for the binary cross-entropy loss I used for the voxel networks. I trained voxel networks using 3 different values for pos_weight (1, 3, and 5) for 10,000 iterations each and compared the results.
Input:

Results (isovalue=0.5):
pos_weight |
% valid mesh | Mean pred. | % occupied voxels (>0.7) | F1@0.05 | Sample output |
|---|---|---|---|---|---|
1.0 |
91.2% | 0.1096 |
6.57% | 56.208 | 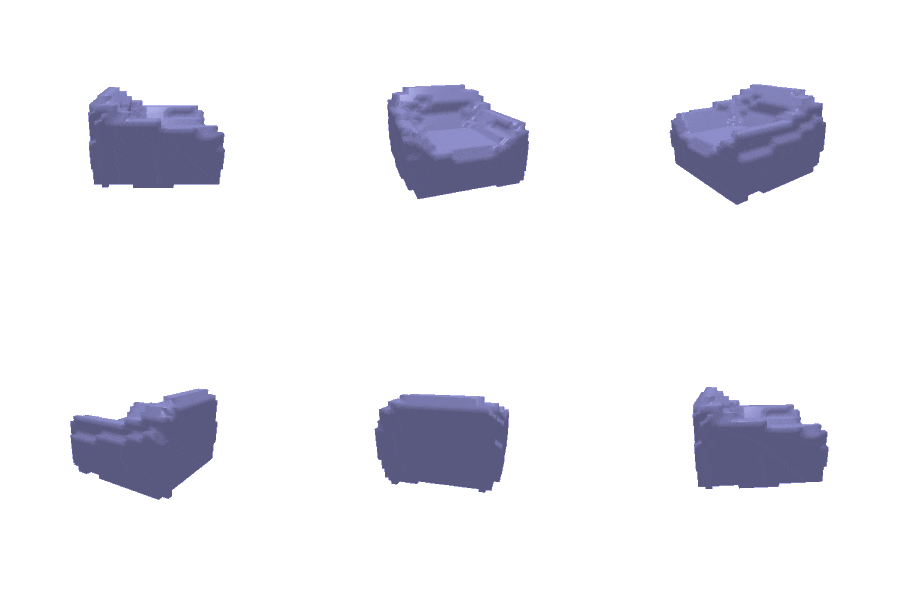 |
3.0 |
100% | 0.1560 |
13.03% | 64.822 | 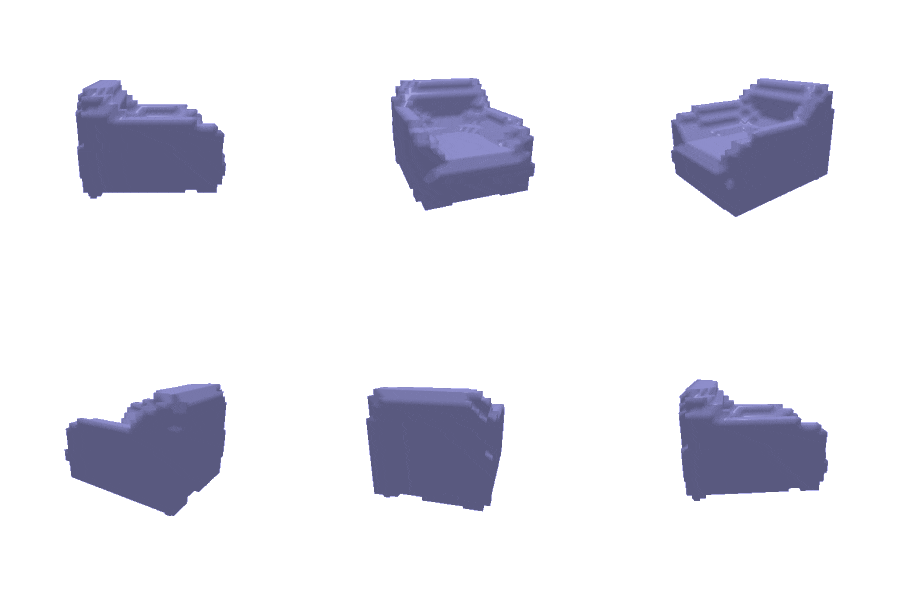 |
5.0 |
100% | 0.1661 |
13.78% | 60.326 | 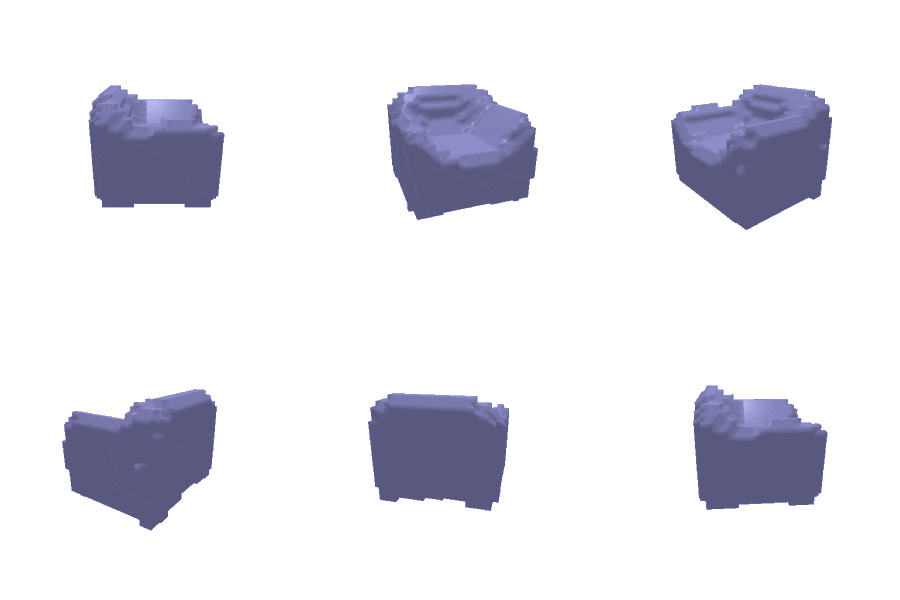 |
Comparing the three networks, the pos_weight=1 network appears to have converged to somewhat of a degenerate optimum in that it often fails to produce a valid mesh, presumably due to having learned to over-predict unoccupied voxels on account of unoccupied voxels representing the majority of the dataset. It has a significantly lower mean prediction compared to the other two networks, predicting only half as many occupied voxels -- we see this in the sample output as well, where the 1.0 network's output appears significantly eroded (particularly the armrests). In comparison, the 3.0 and 5.0 networks appear much closer in both mean and % predicted occupied voxels, though the 5.0 network does still have both a higher mean prediction and higher % predicted occupied voxels on account of the higher pos_weight -- we can see this in the sample output as well, where the 5.0 network predicts more occupied voxels around the armrests and chair seat compared to the 3.0 network.
Interestingly, the network with the highest F1 score is actually the 3.0 network, seemingly indicating that the 5.0 network is overpredicting occupied voxels and that 3.0 (or some value around that) might actually be the "sweet spot" for pos_weight. Despite the 1.0 network making very different predictions compared to the 3.0 or 5.0 networks, it's actually not too far behind in terms of F1 score, likely due to it successfully predicting all unoccupied voxels (comprising the majority of points in the dataset).
2.5. Interpret your model
Predictions across Chair Types
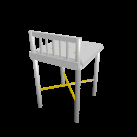
We can first look at how our models respond to different chair types, starting with a fairly standard chair, which our model predicts fairly well:
Moving onto a chair with holes, we see that our model now begins to struggle more:

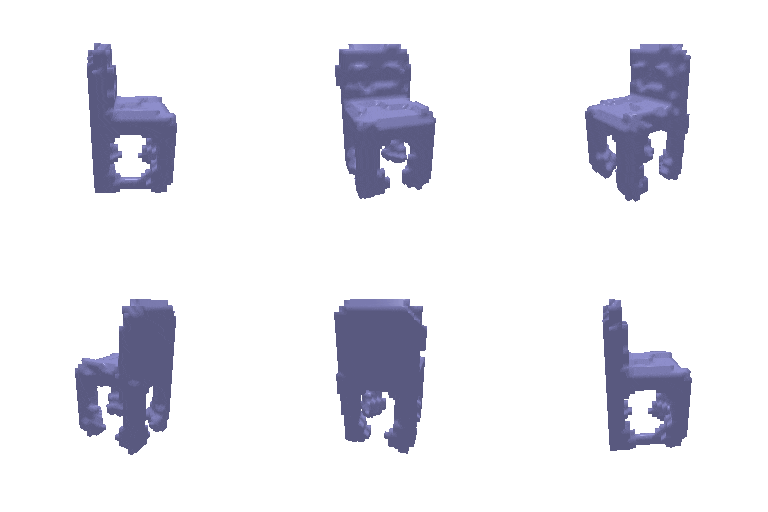
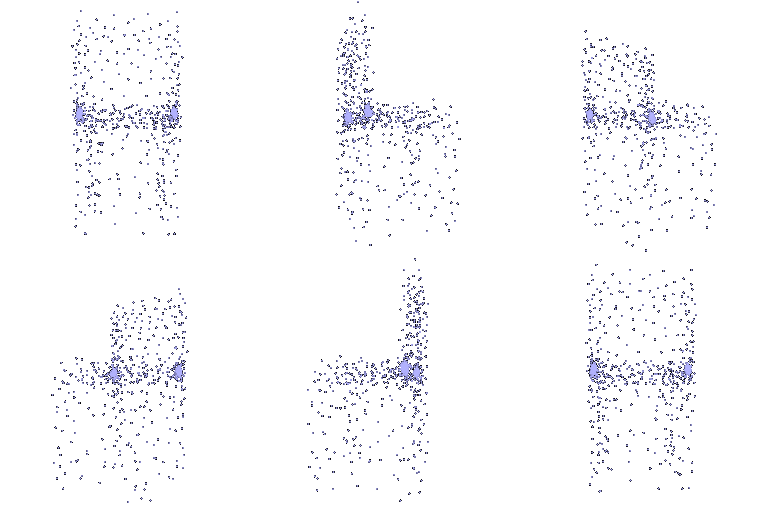
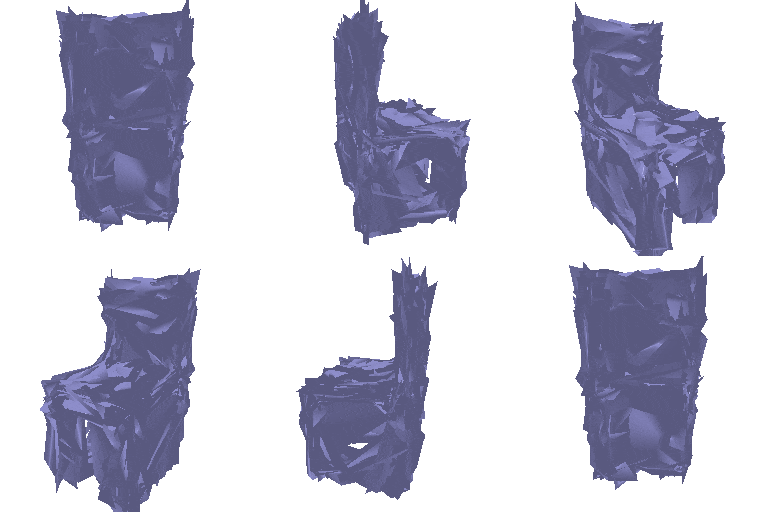
Looking at our three network outputs:
The voxel network appears to be the closest to matching the ground truth, but is missing the little slats on the chair back and the enclosing bars on the bottom of the chair legs. The missing slats may just be down to the voxel resolution being too low to depict them, but the missing pieces on the bottom are certainly a misprediction.
The point network also appears to be in the ballpark, though not 100% there yet -- although there aren't any clear holes in the point cloud, we do see regions with much lower point density that appear to correspond to holes on the true chair (e.g. the holes in the chair legs + the large hole on the bottom of the chair back). That said, there do still appear to be points in the hole regions, hence the prediction is still off.
The mesh network appears to capture the overall shape of the chair okay, but it very clearly struggles to capture holes of any sort, as seen in the mess of triangles in the lower half of the mesh. The mesh also appears to be malformed in general, further indicating that it's struggling to represent the chair.
Our takeaway from this example might be that a simplistic mesh network like mine isn't the best choice for handling complex geometries.
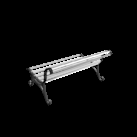
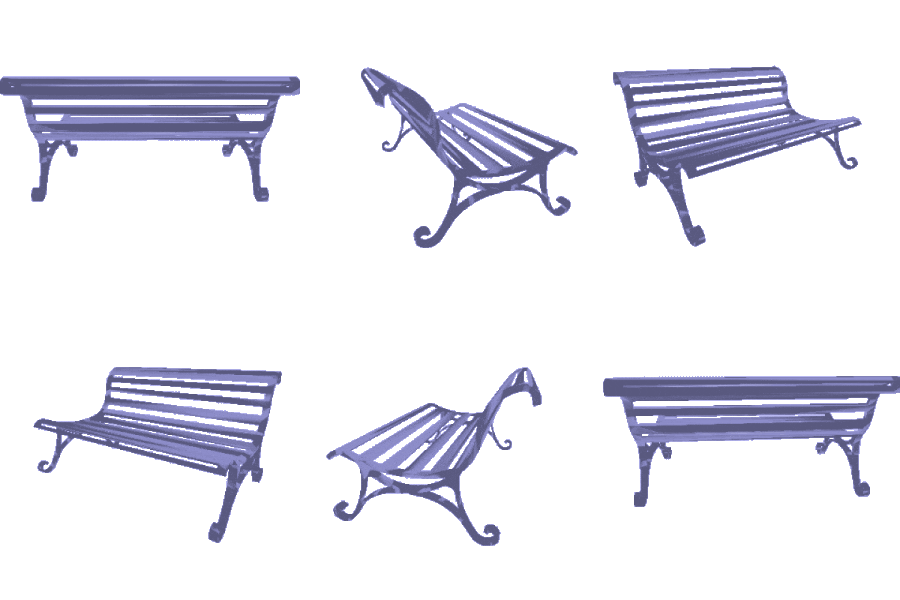
We can also look at a bench, which similarly proves difficult:
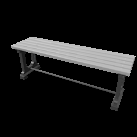
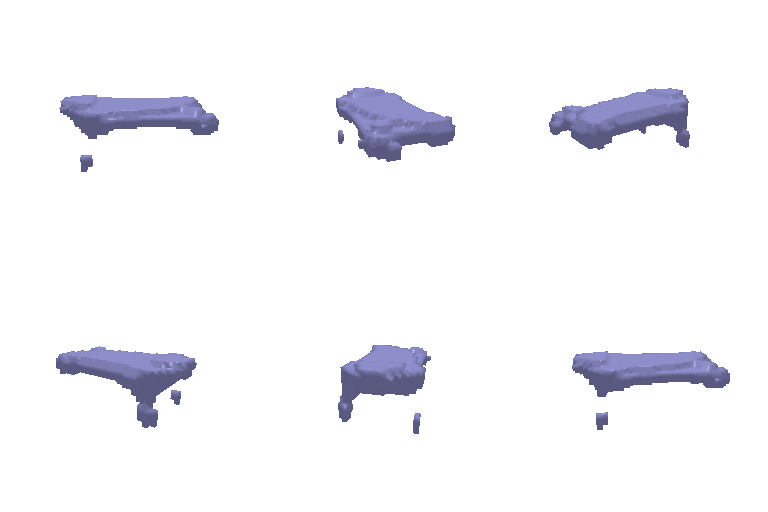
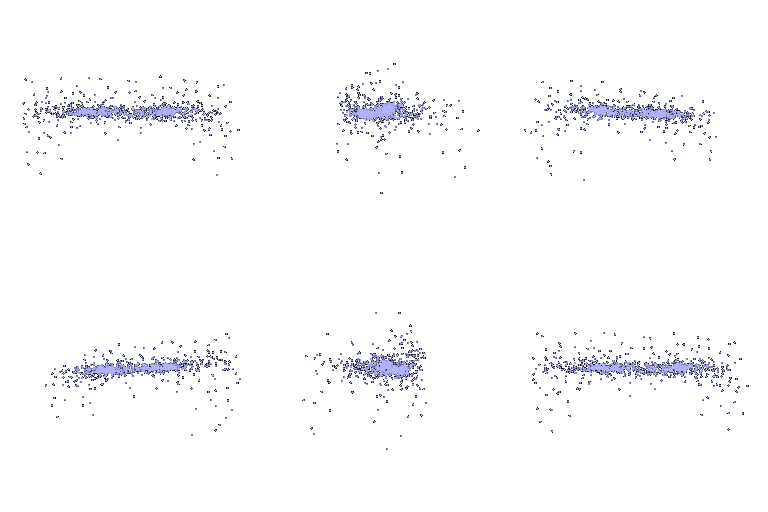
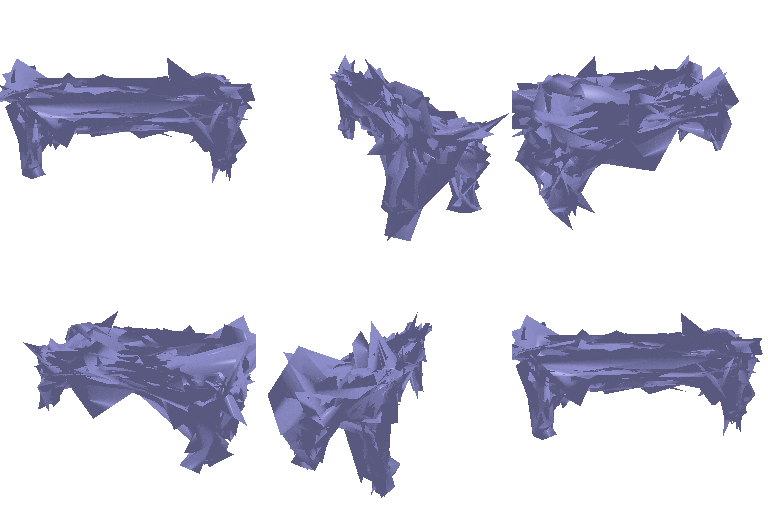
One note: the voxel rendering with my normal 0.7 occupancy threshold actually turned up empty, so the voxel rendering above was done with an 0.5 threshold.
With the aforementioned note in mind, it's clear that the voxel network has some sense of what a bench is, but is still significantly underpredicting occupancy across the board for the bench. One solution to this might be increase the number and/or weighting of benches in the dataset; another could just be to train more/try a larger network and hope for the best.
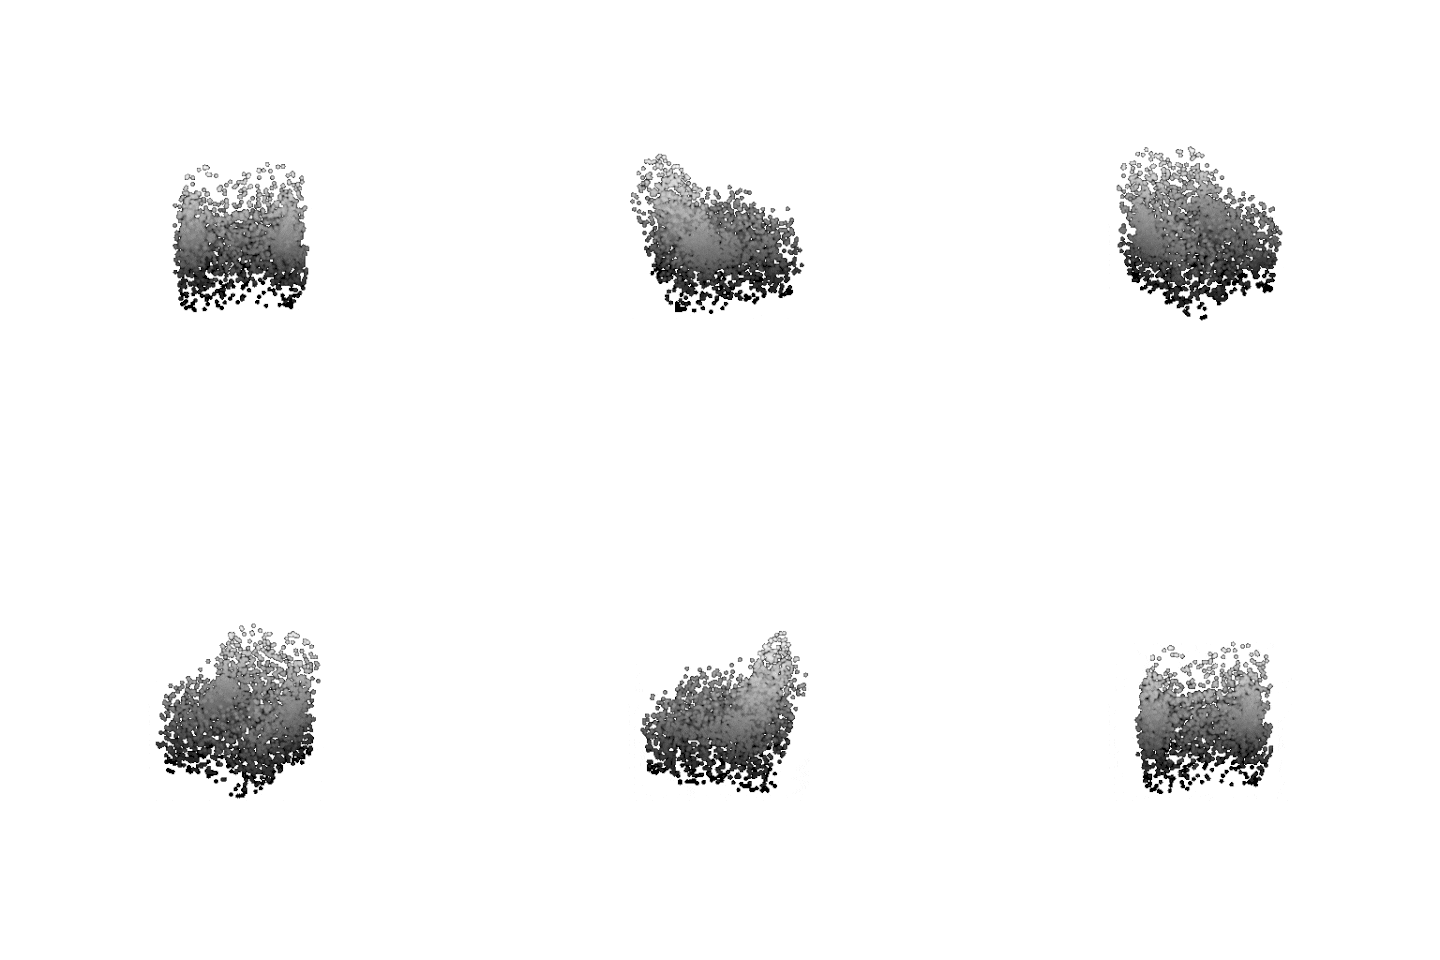
The point network output isn't 100% there in terms of geometry, but seems to mostly capture the overall shape (including the gaps between the bench legs).
The mesh network output also appears to get in the ballpark of what the bench should be, although the mesh does appear to be pretty messy geometry-wise.
One reason why the voxel network may be underperforming here, compared to the other two networks, is that the other two networks are "forced to" predict where point locations are, whereas the voxel network only has to predict whether there are points. As such, even if there aren't many benches in the dataset, the point & mesh networks might still be able to learn a low-confidence representation that nonetheless outweighs "standard-chair" representations enough to appear in the output, whereas the voxel network's low-confidence representation is simply too low to produce large-enough occupancy values in the output.
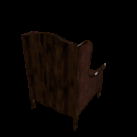
Finally, we can look at results with an image of a real-life chair in a standard indoor environment, which are somewhat poor:
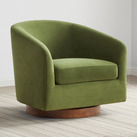
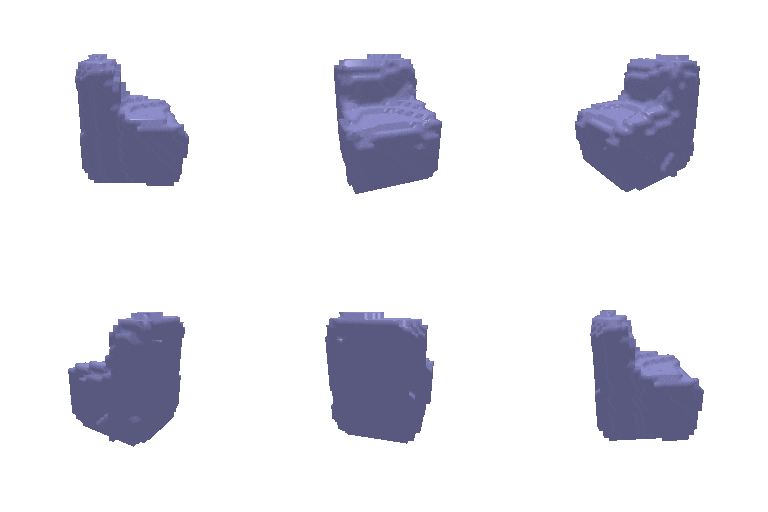
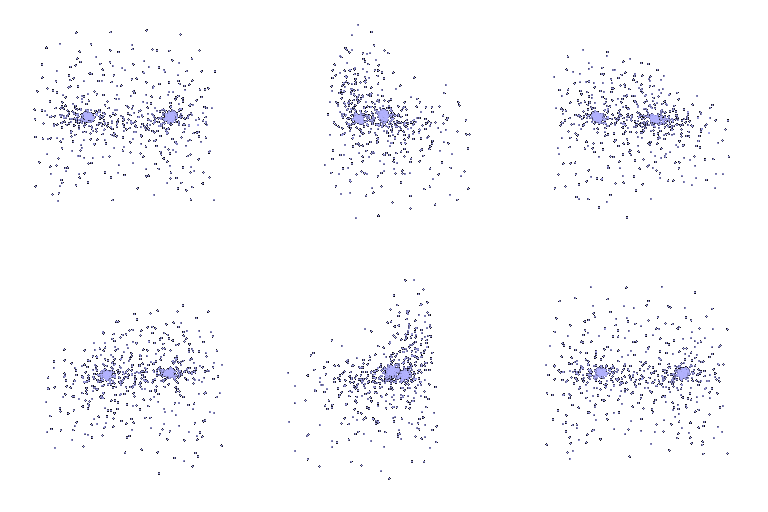
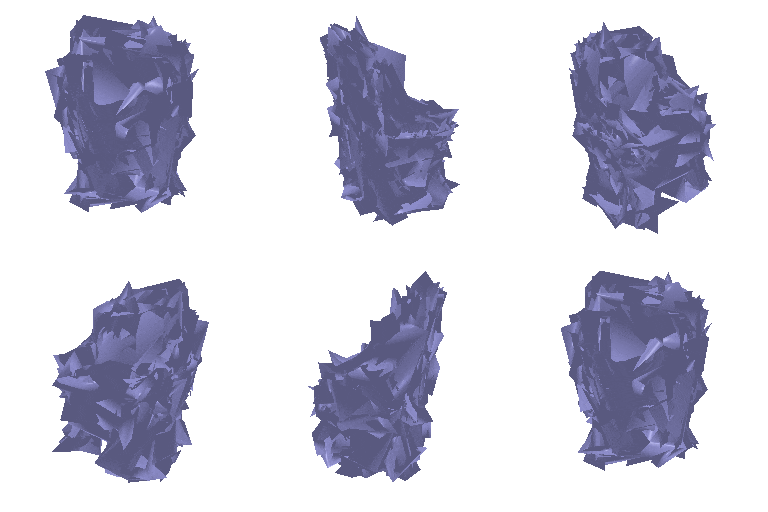
The mesh network seems to be the closest, with a decent-but-not-great prediction of the chair. The point network output is pretty bad, but is closer to matching the overall shape of the chair (i.e. not a straight-backed chair) compared to the voxel network, which seemingly outputs a different kind of chair altogether. It's likely that supplying an image more like the training images (e.g. with a black background) would improve results, but it's clear that the network struggles to generalize.
Predictions across Image Transformations
We can first look at how our models respond to different image transformations, starting with our standard chair with no transformation:
Interestingly, dividing the magnitude of image pixels by 10 doesn't appear to significantly affect the predictions:
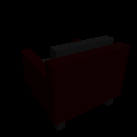
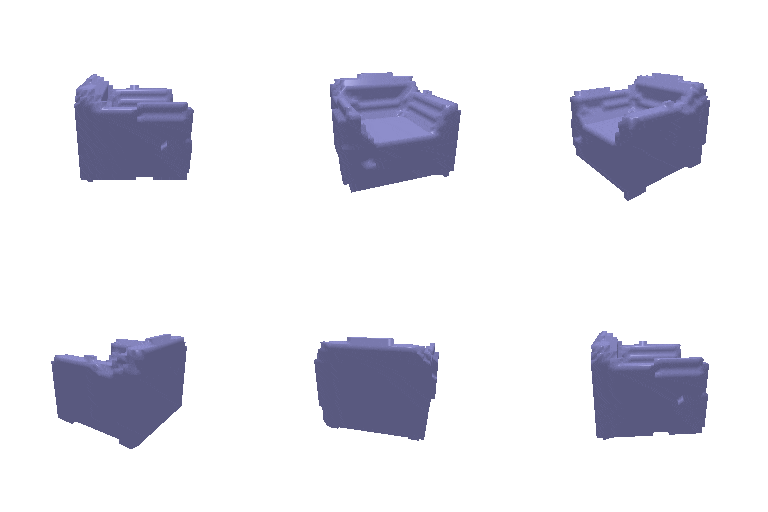
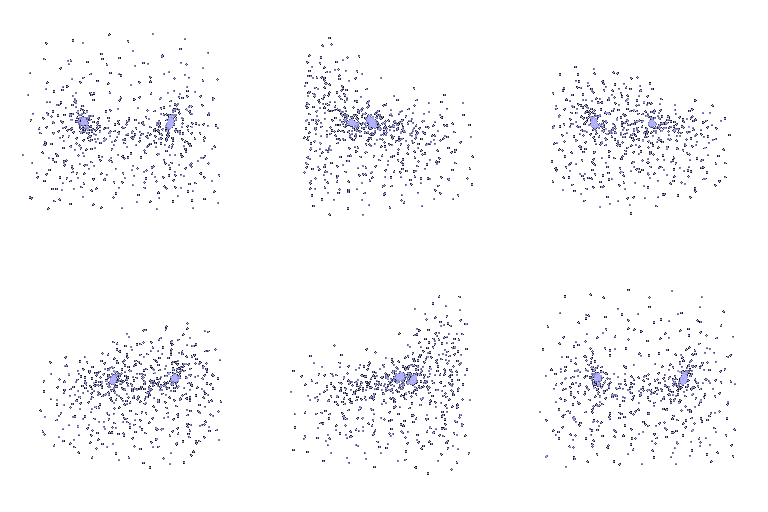
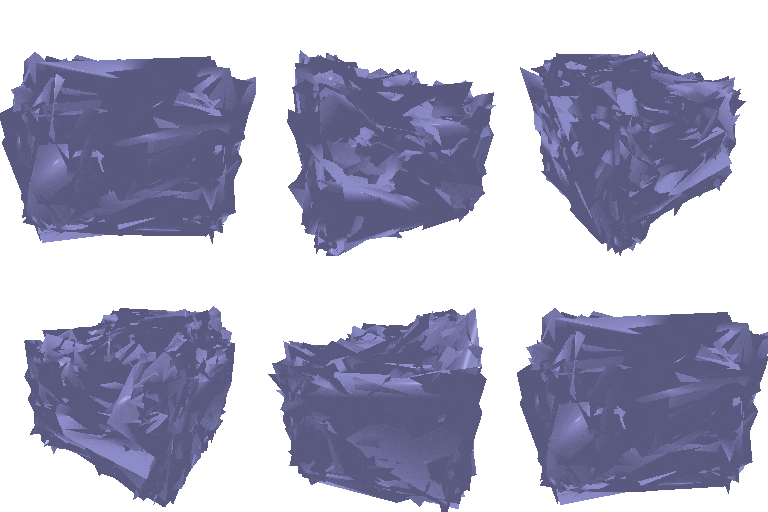
It seems that the intensity of input pixels does not have a significant effect on the predictions.
In contrast, providing an all-black image does change the outputs:

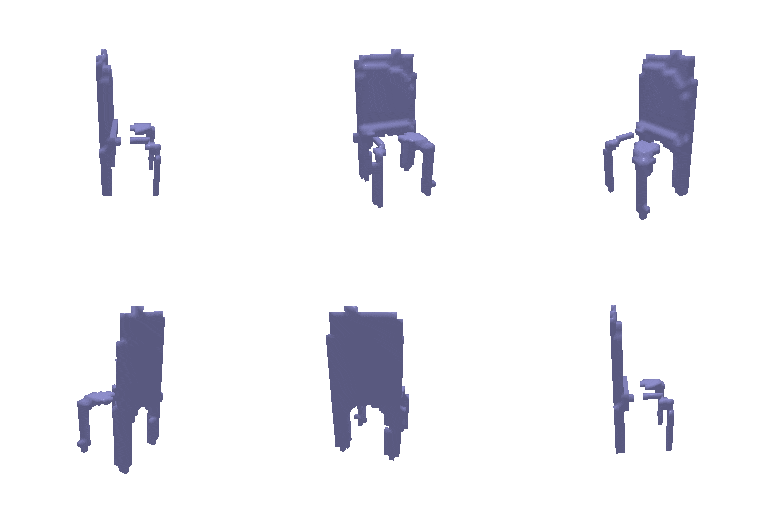
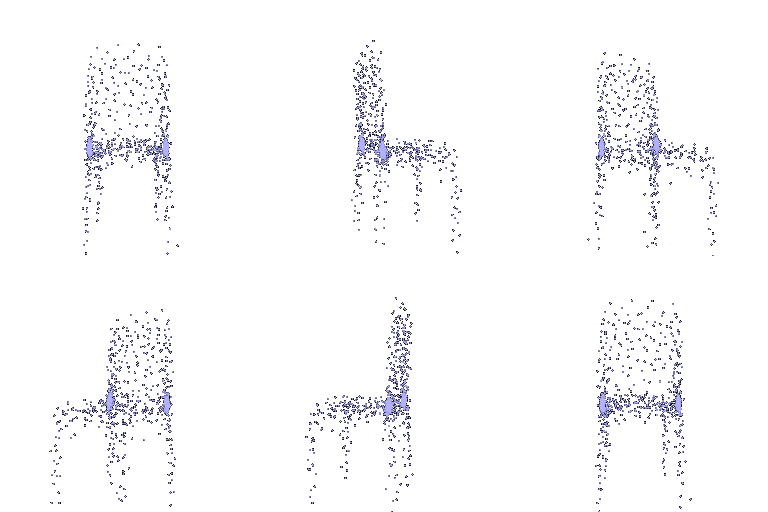
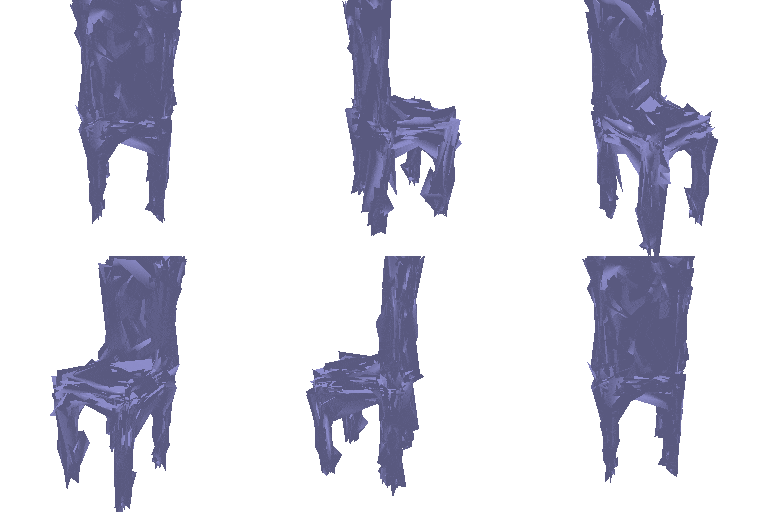
The fact that (surprisingly coherent) chairs are output, even for an all-black input image, seems to suggest that the network has learned some type of archetypal base chair across inputs. Granted, we are forcing the point and mesh networks to predict outputs, even if the signals are weak; that said, even our voxel network is predicting large-enough occupancy to create distinct chair parts, indicating that the network is somewhat confident in its prediction.
Another transform we can look at is inverting the image:
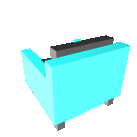
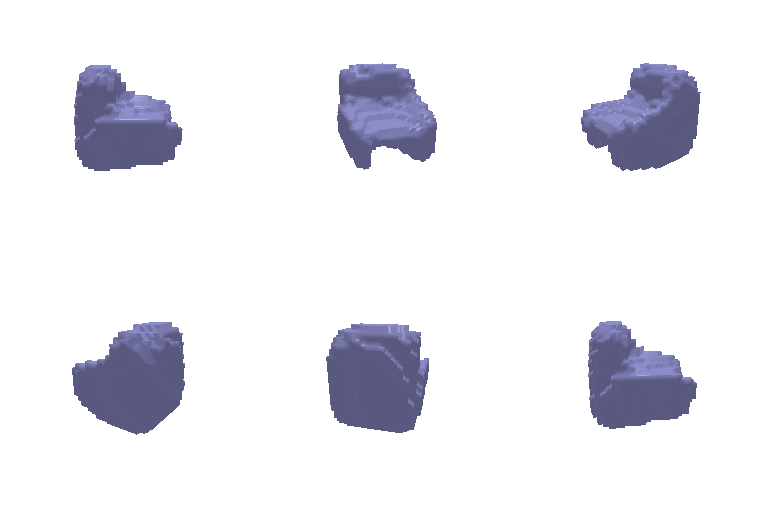
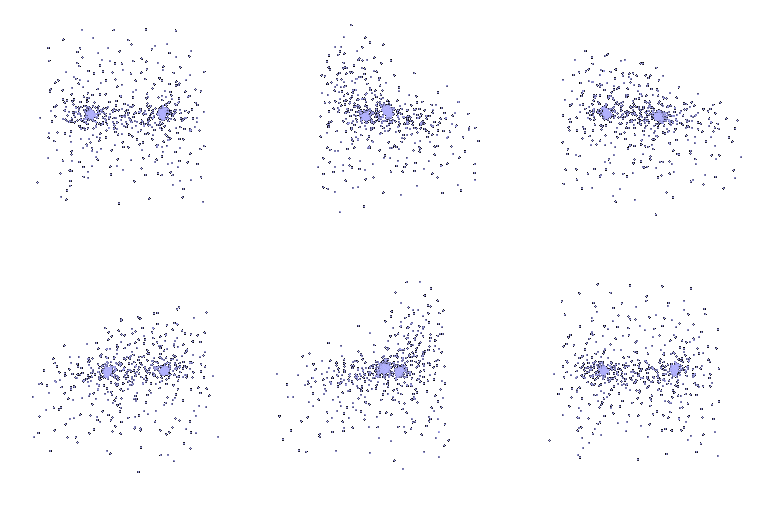
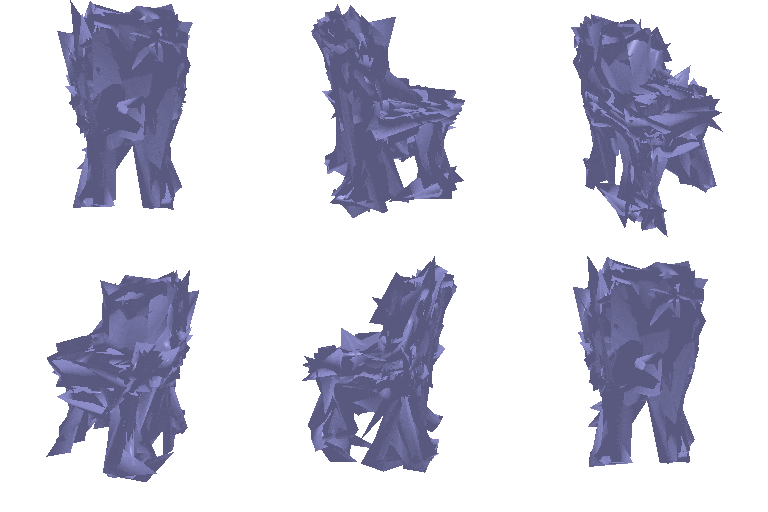
The voxel and point outputs are somewhat but not too significantly affected, though interestingly enough, the mesh network seems to be predicting an entirely different kind of chair. This is additionally interesting given that the point and mesh networks share the same architecture -- given that their outputs still differ, they seem to have learned meaningfully different representations in spite of their common architecture.
3. Exploring other architectures / datasets.
3.1 Implicit network
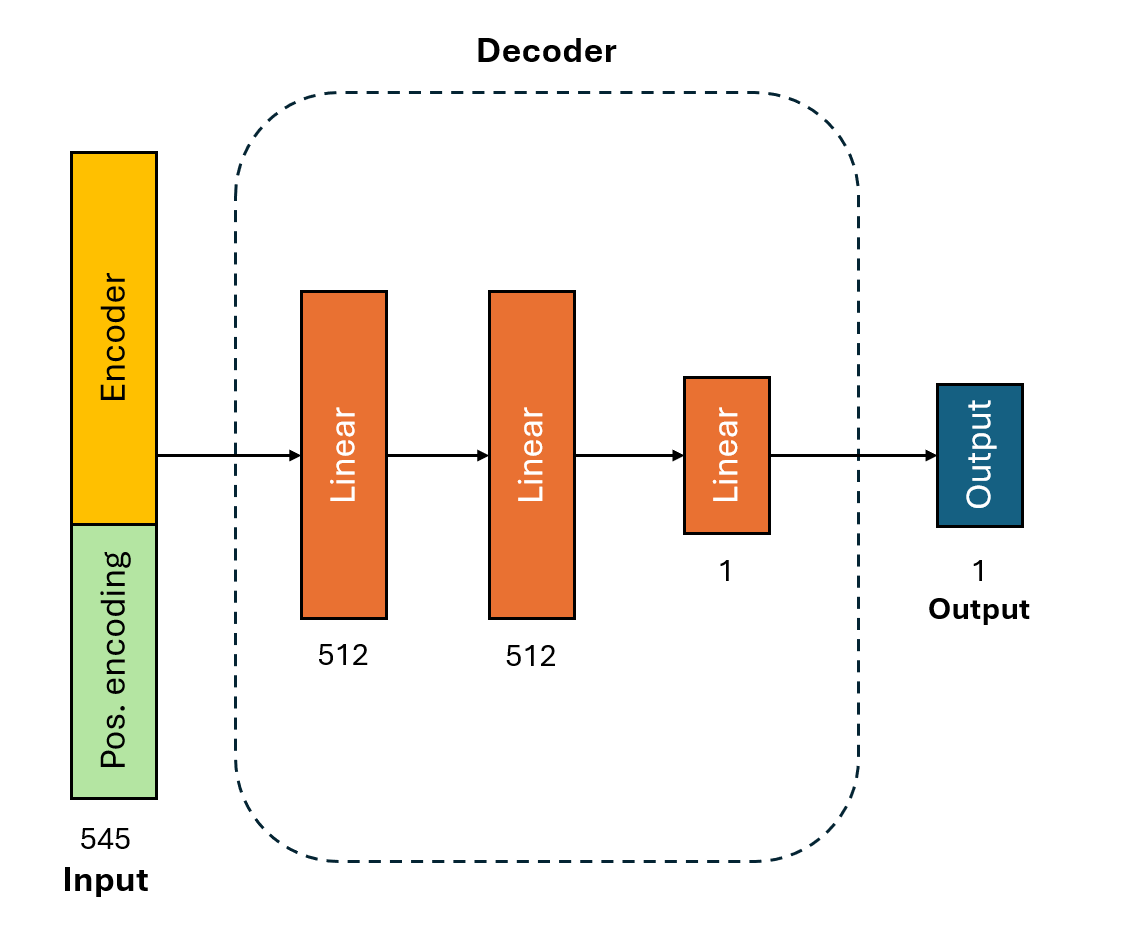
For the implicit network, I used a similar network architecture as with my mesh & point cloud networks, with the exception of (i) an extra positional encoding field in the input, and (ii) an output size of 1 rather than num_points.
For the positional encoding, I used the following encoding for each of $x,y,z$ in the query:
$$ v_{encode}(x)=[x,\;\sin(\pi x),\;\cos(\pi x),\;\sin(2\pi x),\;\cos(2\pi x),...,\;\sin(5\pi x),\;\cos(5\pi x)]^T $$
To train, for each training example, I sampled 400 random query points $p\in[0,32]^3$ and, for each query point, took the occupancy label of the nearest voxel center as the ground truth value. For my loss function, I used binary cross-entropy loss with pos_weight=3, the same settings I used to train my voxel network.
- In hindsight, 400 may have been too low, as the network performance was somewhat lackluster.
(Due to time constraints, query point sampling was done uniformly over $[0,32]^3$, and I took the nearest neighbor for ground truth rather than doing any interpolation of occupancy values.)
- # iterations: 20,000
Predictions
Input images:

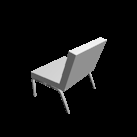
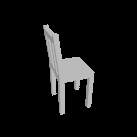
Ground truth mesh vs. predicted mesh:
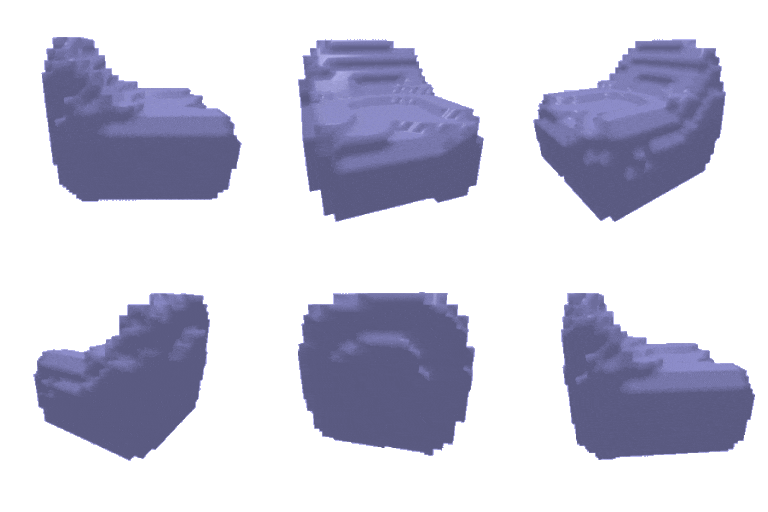
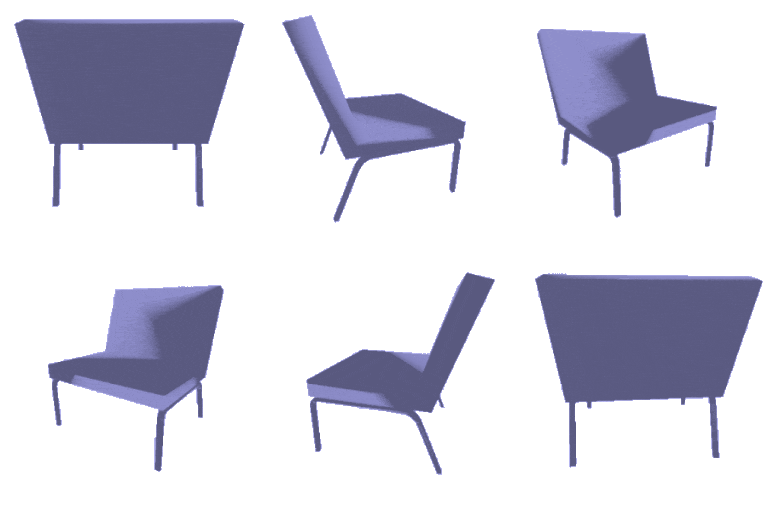

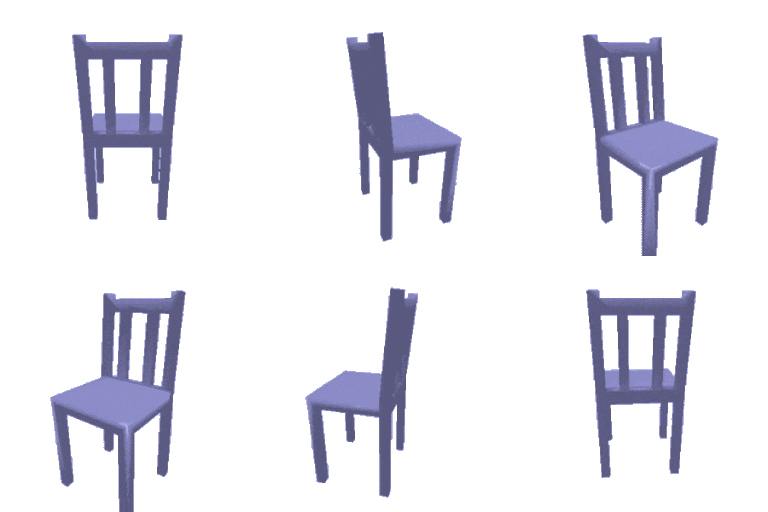
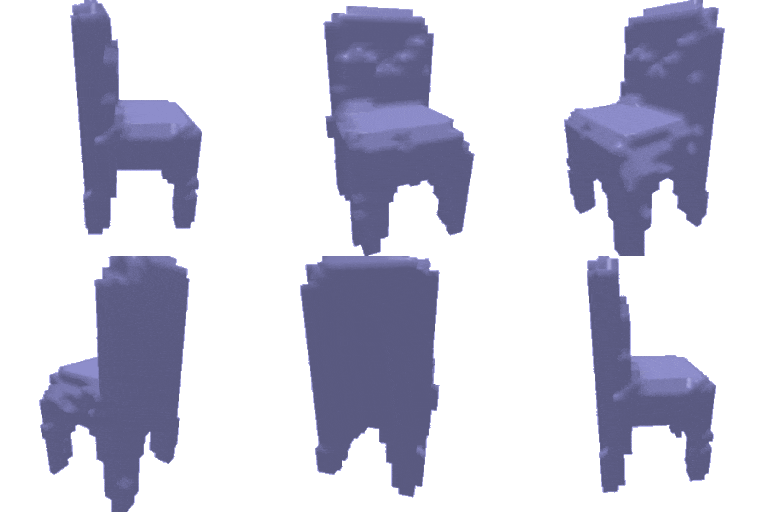
The major problem with the implicit network appears to be a severe lack of fine detail. For (1), although the predicted output gets the general shape, it overpredicts occupied pixels around the chair seat. In (2), the output is missing legs (and maybe too narrow?), whereas in (3), the output has legs but is now missing holes. Notably, all 3 output meshes are actually overpredicting in some areas, indicating that this isn't a pos_weight issue. I couldn't say what the issue is here, but (i) a larger network, and (ii) sampling more points during training might help.
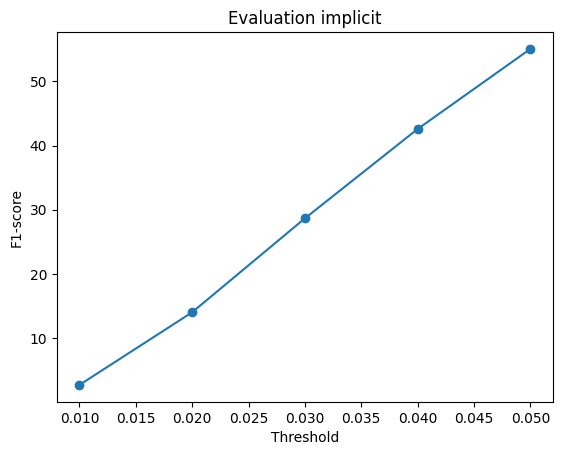
F1 Score
F1@0.05 score: 55.581
I originally trained my implicit network using pos_weight=5, before I found via experimenting that pos_weight=3 performed better for my voxel networks (see 2.4).
Compared to my voxel network, the F1 is noticeably lower in this case (55.6 vs. 64.8 for the voxel network). This was somewhat surprising to me, given that the same loss function was used in both cases -- it's possible that better sampling strategies, a more sophisticated means of calculating ground truth, or simply more sampled points per iteration and/or a larger NN could help bridge this gap.
3.2 Parametric network
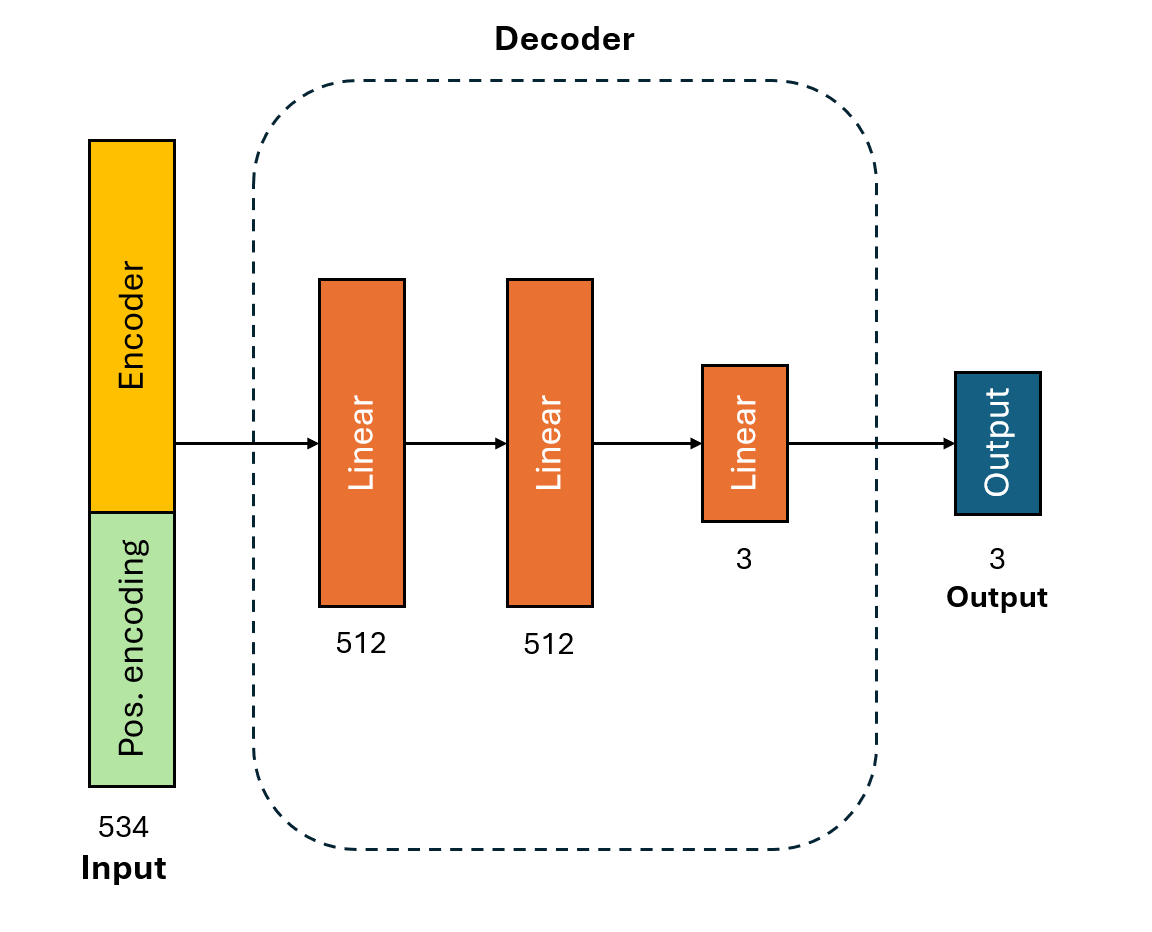
For my parametric network, I used (almost) the exact same network as for my implicit network. 2D points were sampled uniformly on $[0,1]^2$ and encoded via the same encoding scheme as in my implicit network. For training, I used the chamfer loss between points on the ground-truth mesh and 1,000 sampled points from the network.
# iterations: 20,000
Predictions
Input images:

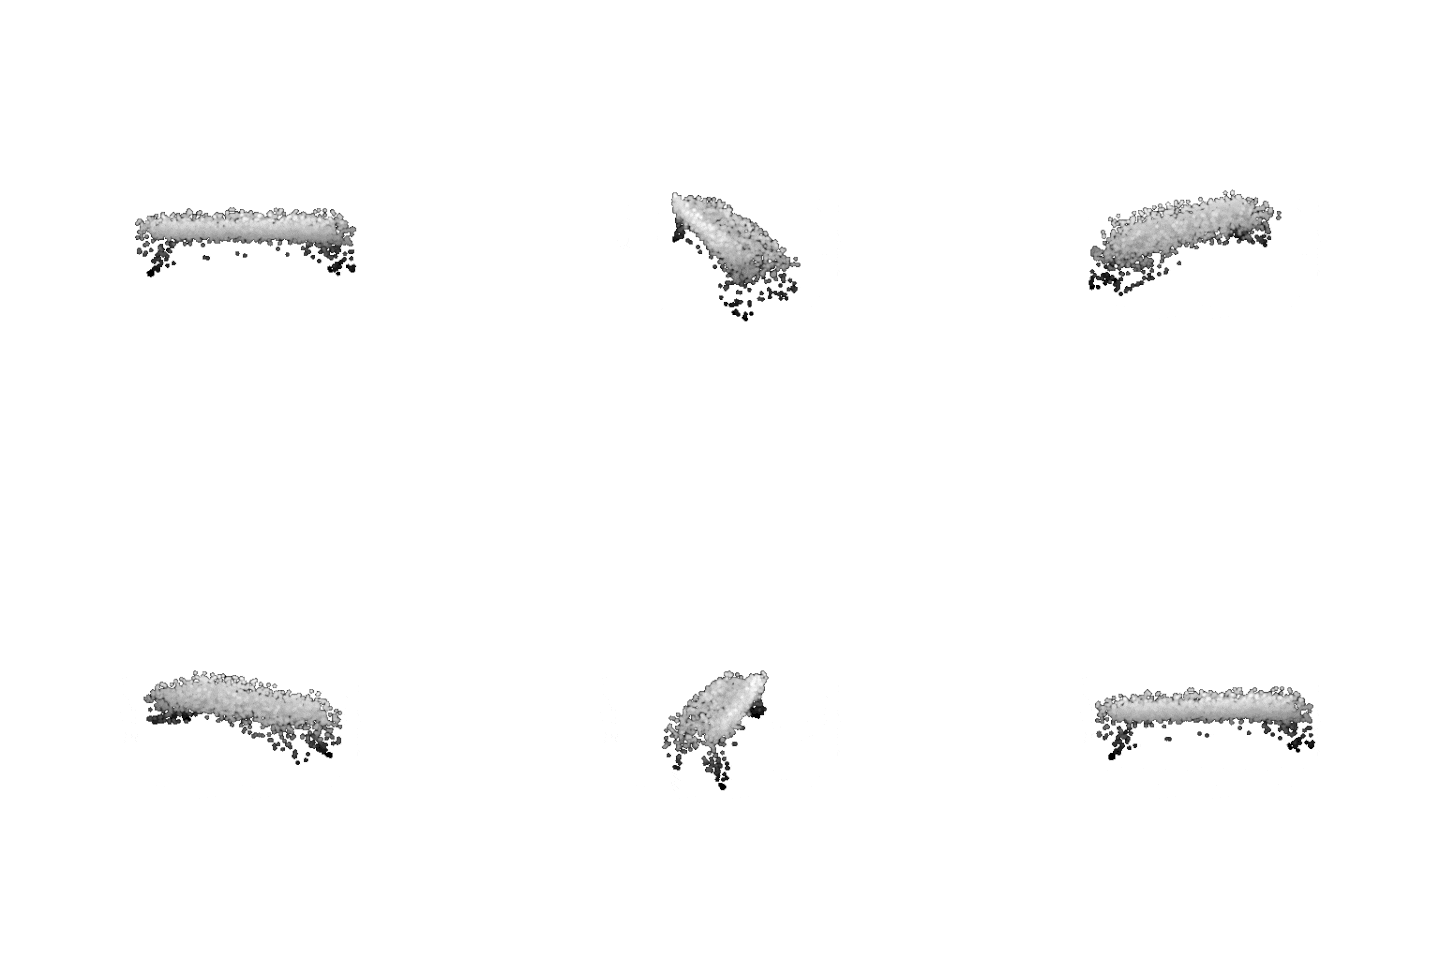
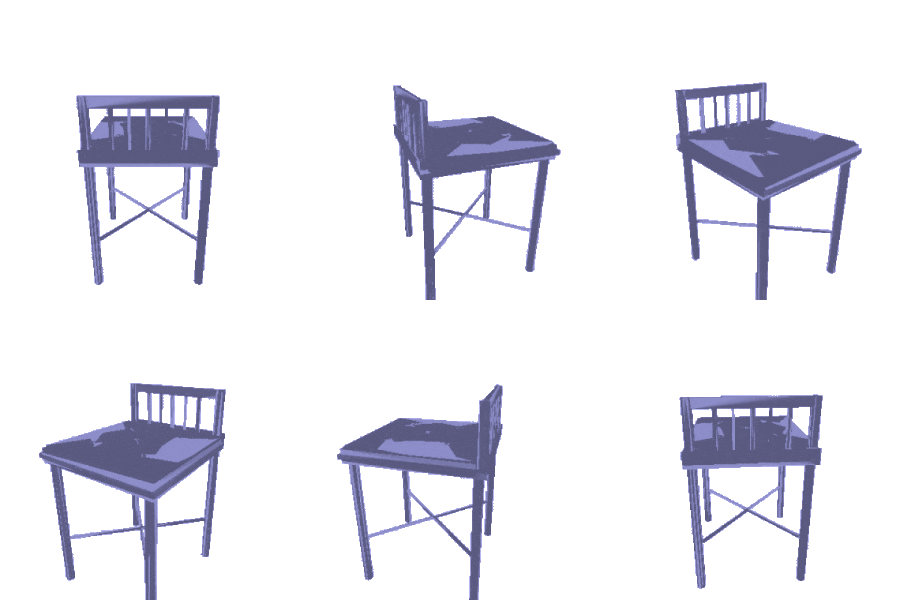
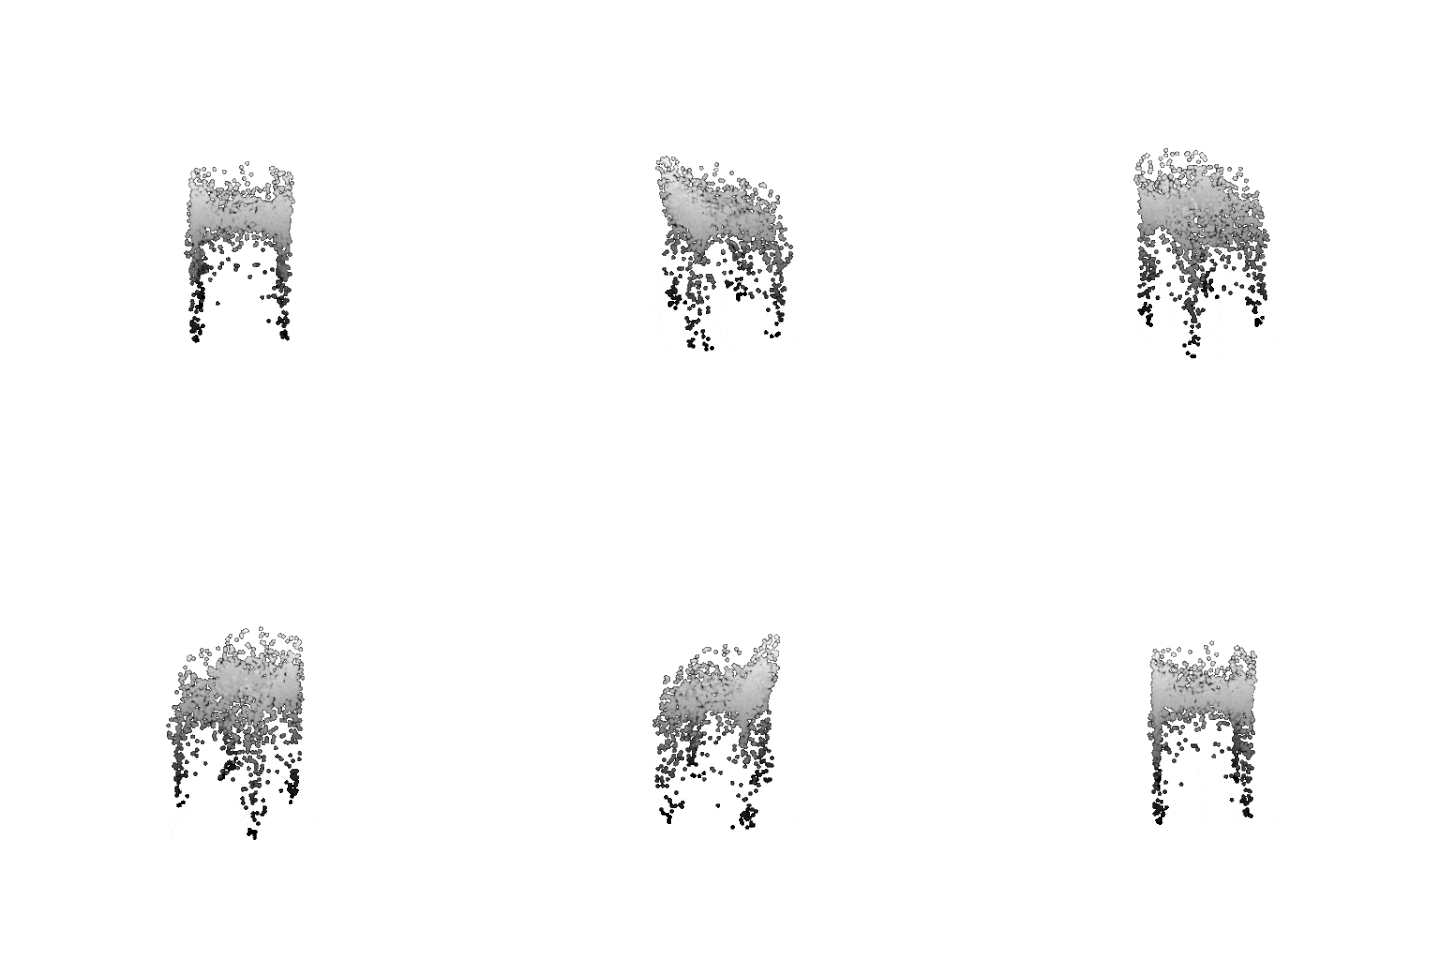
Ground truth mesh vs. predicted mesh:
Variable-(# point) Samples
Example sampling:
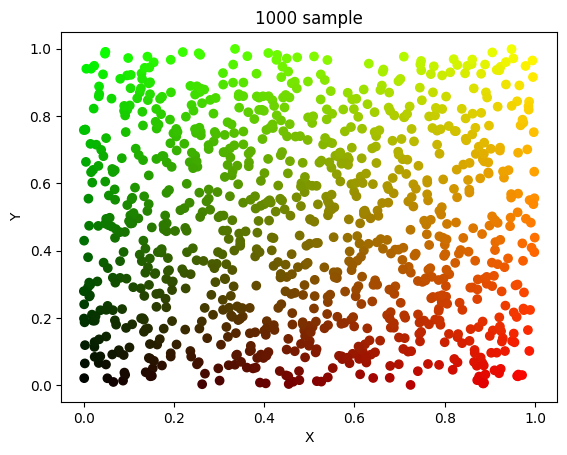
Results for $n=10,100,1000,10000$:
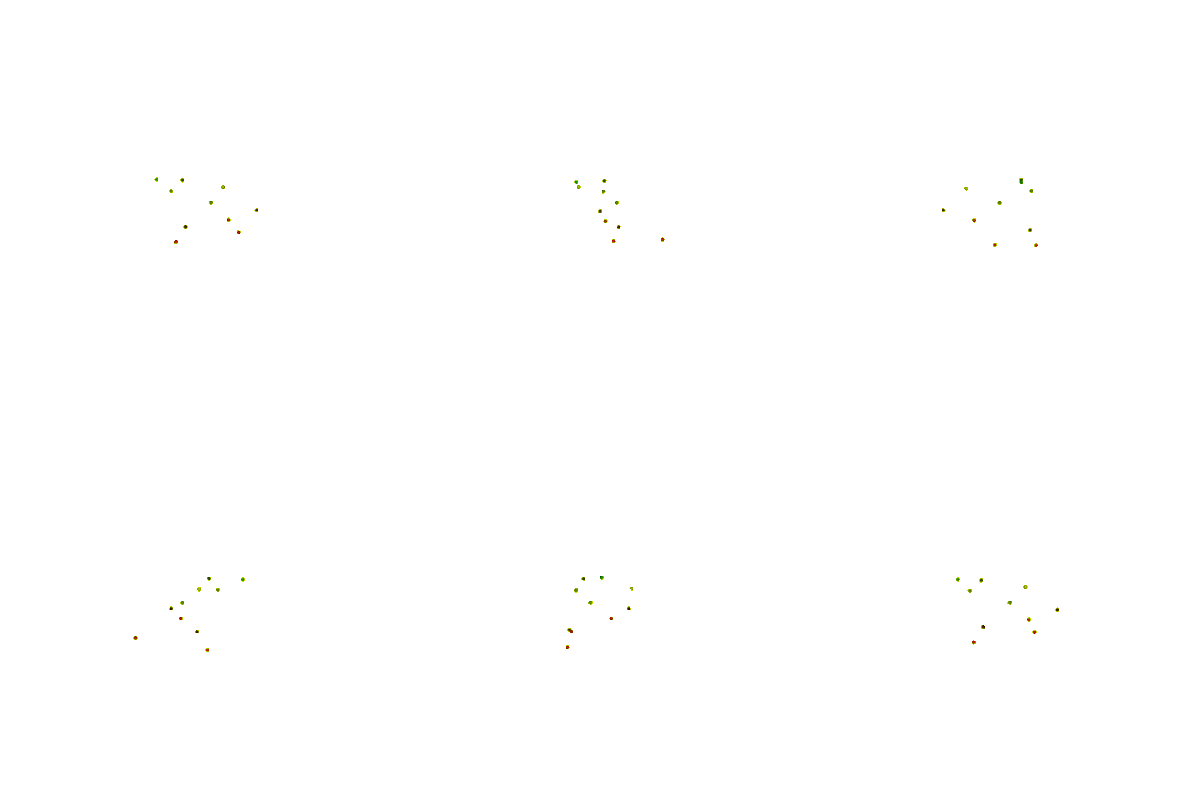
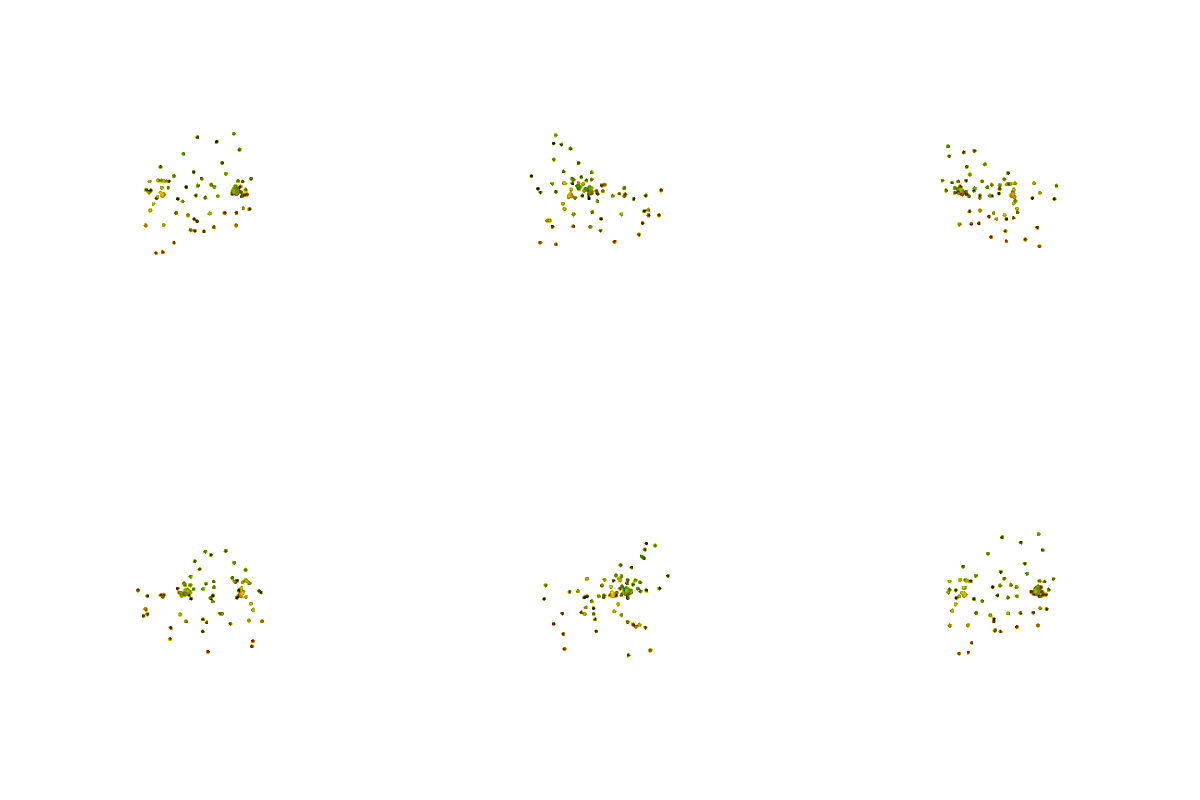
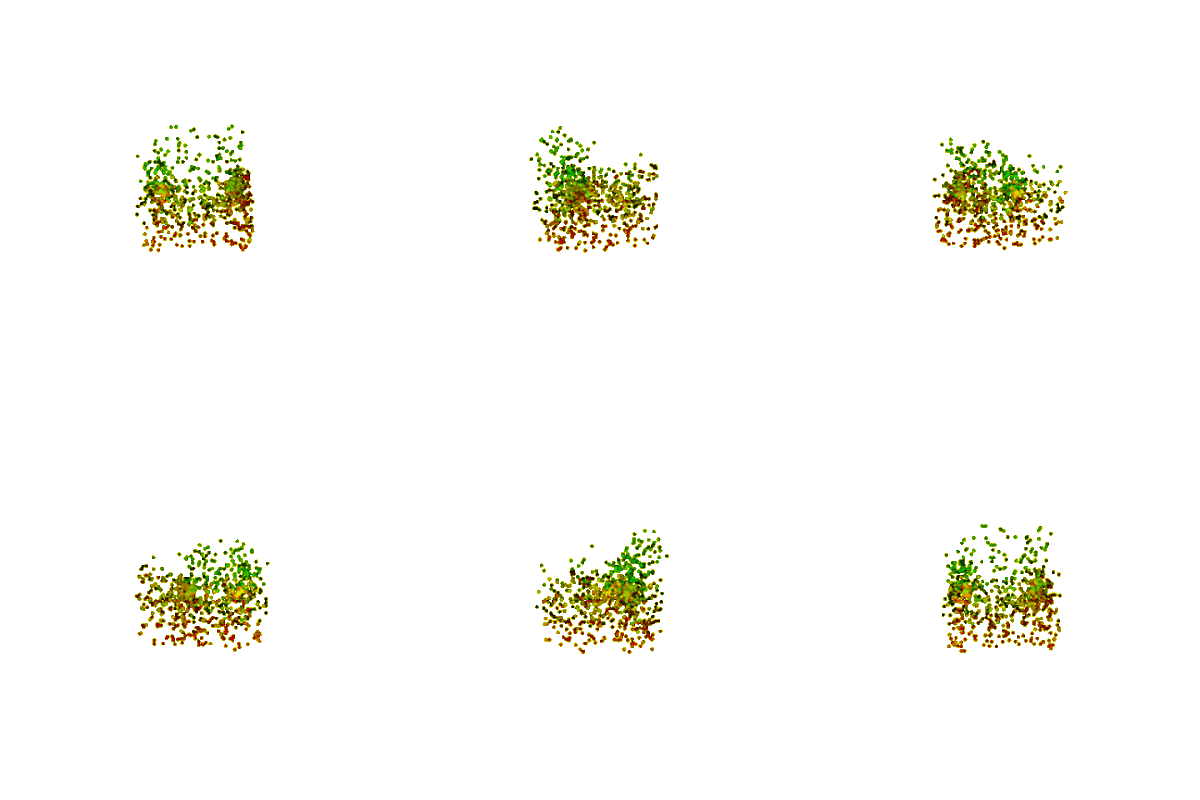
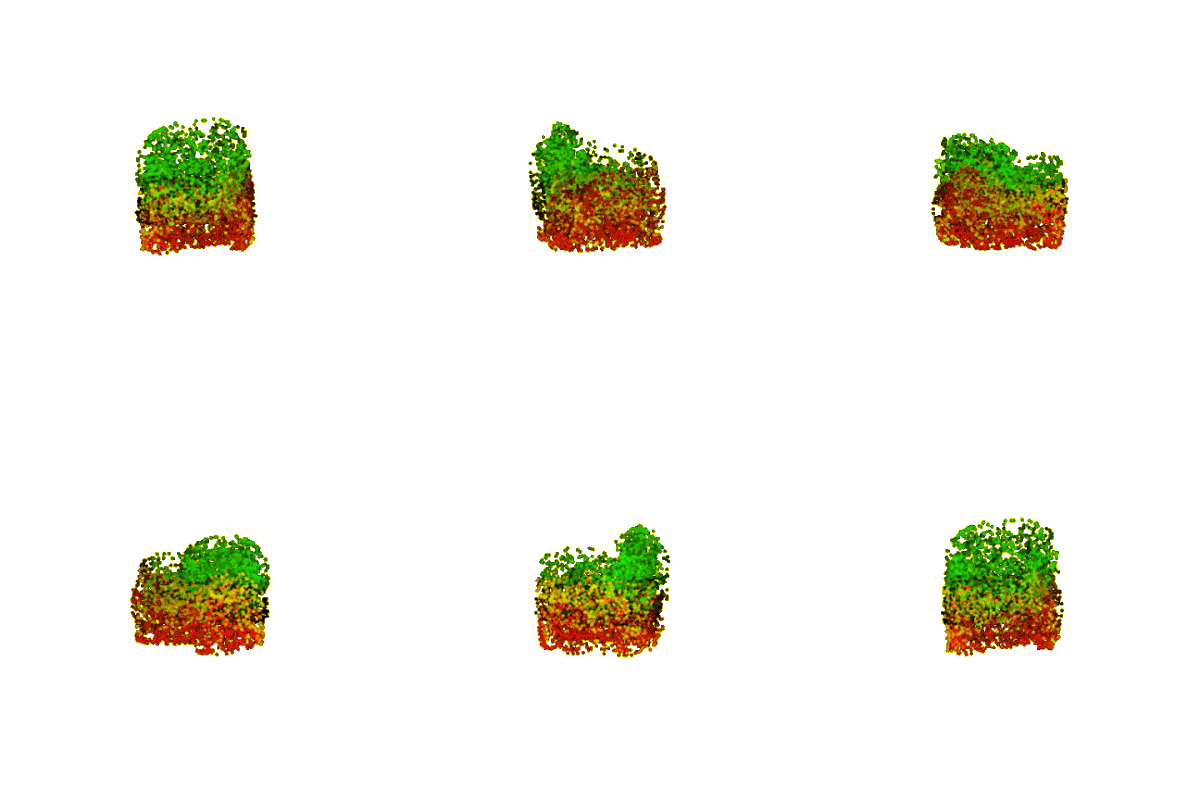
In general, we do see that the point distribution on the 3D outputs follow some kind of gradient (e.g. greener points [lower X, higher Y] are on top, redder points [higher X, lower Y] are on the bottom). However, it clearly isn't a perfect correspondence, as shown by the black points that are kind of interspersed throughout the model.
F1 Score
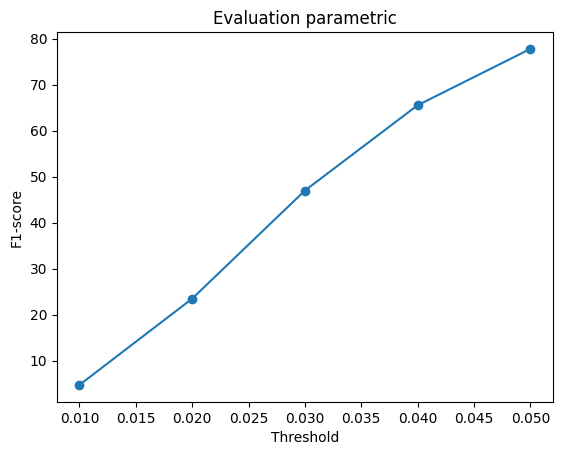
F1@0.05 score: 77.784