


Shown: selected test objects 0, 4, and 12. F1 scores use all 678 test objects.
F1@0.05: 49.74%
Occupied voxel cells (p > 0.5) and the mesh extracted from the same probabilities are shown side by side.


F1@0.05: 79.23%


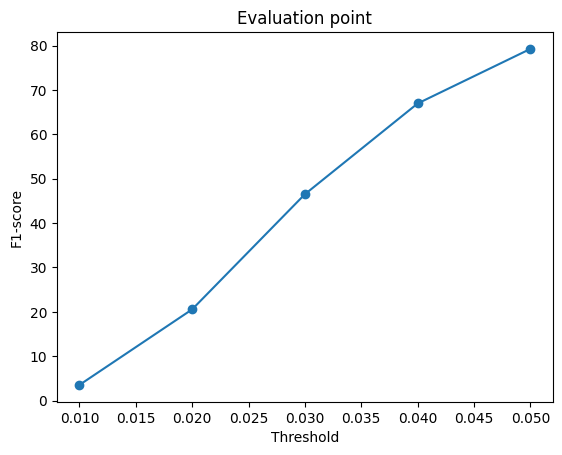
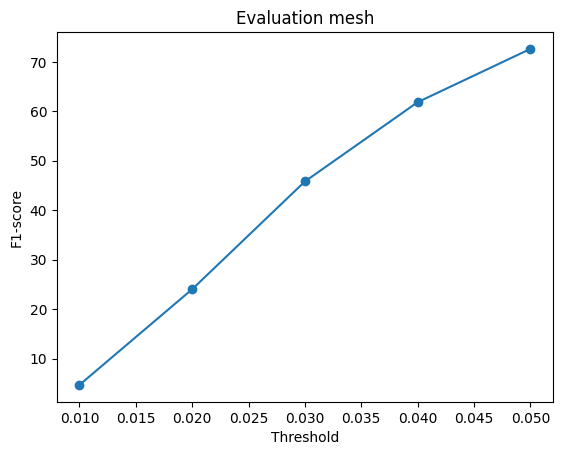
F1@0.05: 72.62%


| Representation | F1@0.05 |
|---|---|
| Voxel grid | 49.74% |
| Point cloud | 79.23% |
| Mesh | 72.62% |
Point Cloud has the best F1 score, then mesh and voxel grid has the worst score. Voxel grid has the worst score because it has a lot of missing pieces due to low confidence in narrow places. Meshes perform worse than point clouds because its a harder problem to learn, possibly because meshes are constrained because of the connectivity of the vertices and learning the folds is tricky
We vary the mesh smoothness weight in L = Chamfer + w × smoothness. All models use the same architecture, batch size 28, learning rate 0.0004, 1,000 sampled points, and step-10,000 checkpoints.
| Smoothness weight | F1@0.05 | Chamfer (squared) | Laplacian norm |
|---|---|---|---|
| 0 | 75.71% | 0.00480 | 0.10443 |
| 0.1 | 72.11% | 0.00556 | 0.00608 |
| 1 | 69.07% | 0.00626 | 0.00291 |
Weight 0 has the highest F1 in this comparison. Increasing the weight from 0 to 1 lowers F1 by 6.64 percentage points and decreases the mean Laplacian norm by 0.10152. Lower Laplacian norm means neighboring mesh vertices vary less; this can reduce roughness but also suppress thin parts.
Evaluation uses all 678 test objects with the same fixed input view and sampling seed for each model. The existing 0.1 baseline is reused; these are single-run results, so training randomness may also affect differences.
Test object 4, same input view for every model. All mesh renders rotate together.

With w = 0, the mesh contains many jagged, folded triangles. w = 0.1 reduces this fragmentation, although stretched faces remain. w = 1 produces a smoother surface but rounds the back and deforms the legs. This example scores highest at w = 0.1 (52.89%); the table above reports the full-test averages, which favor w = 0.
I realised that most voxels had low probablitliy, so in order to check the probability distribution, I colored each probability range with a different color. Purple indicates low probability; yellow indicates high probability. Cells with p ≤ 0.1 are hidden for clarity. Both views use the saved predictions from Q2.1.


It is seen that the legs of the chairs and other thin regions are low probablity and that is why they didnt show up in the earlier representation of the voxel grid. If we decrease the threshold we will get the legs of the chair, but will also get a lot of extra bulk around the top and seat of the chair which is not desirable
Both models use the latest saved step-8,000 checkpoints after training was stopped early. They use ResNet18 image features learned from RGB inputs, batch size 28, and learning rate 0.0004; precomputed features are not used. Scores average all 678 test objects, using the first available view and the same per-object sampling seed. Examples below are test objects 0, 4, and 12.
The decoder concatenates a 512-dimensional image feature with a 3D coordinate and uses an MLP, 515 → 256 → 256 → 128 → 1, to predict an occupancy logit. Binary cross entropy trains the decoder on a normalized 32 × 32 × 32 coordinate grid. Occupancy probabilities above 0.5 form the displayed voxel grid and extracted surface.
F1@0.05: 37.98%
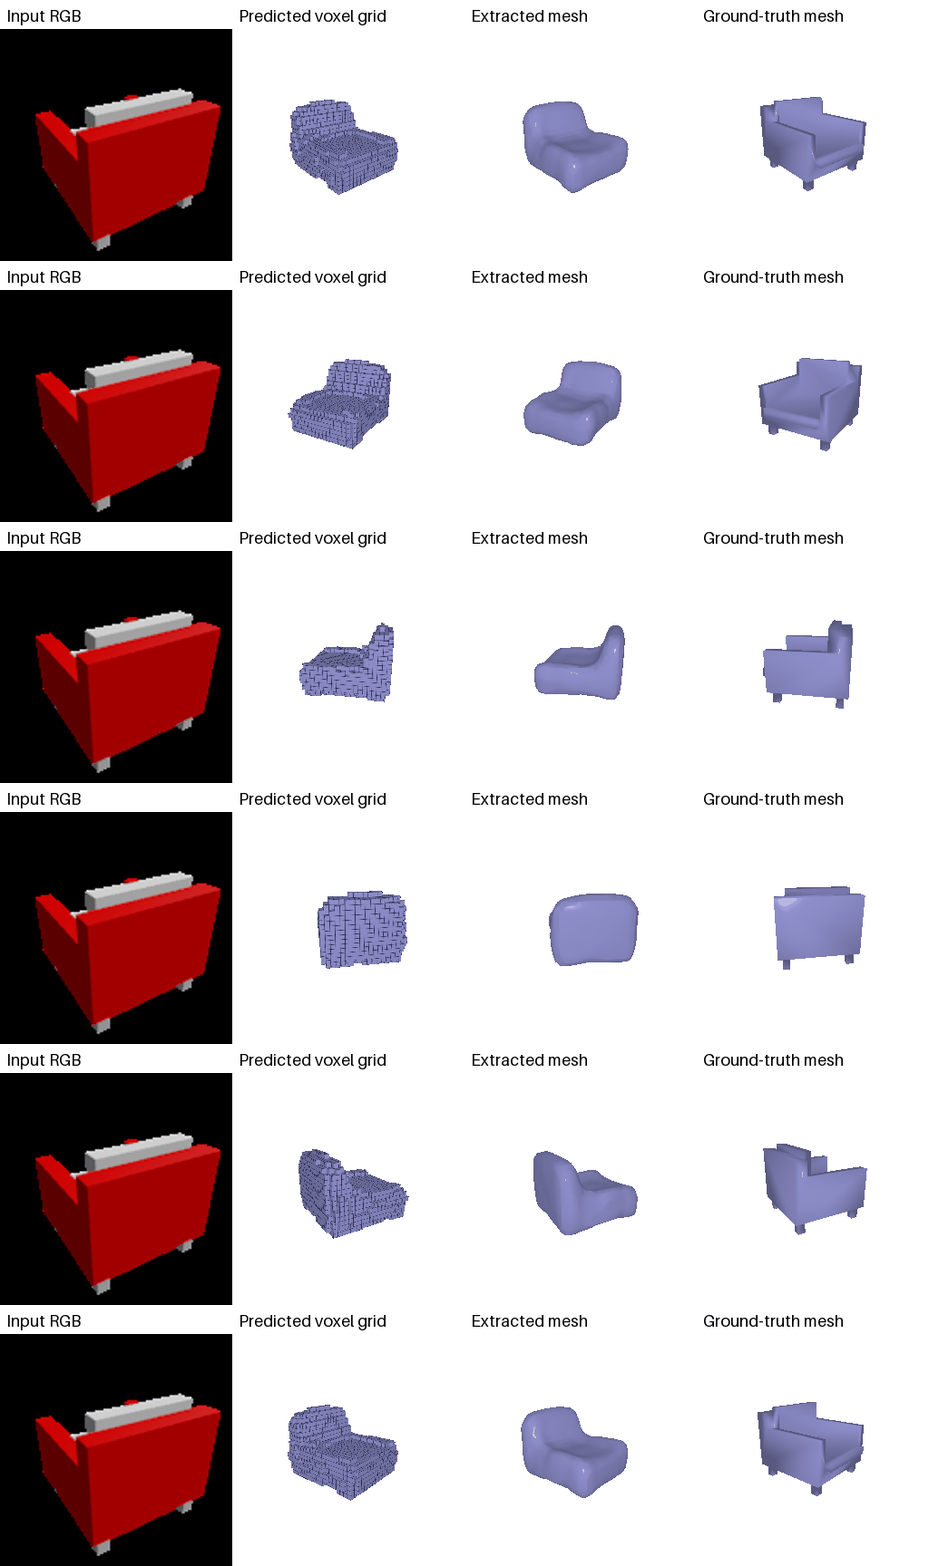
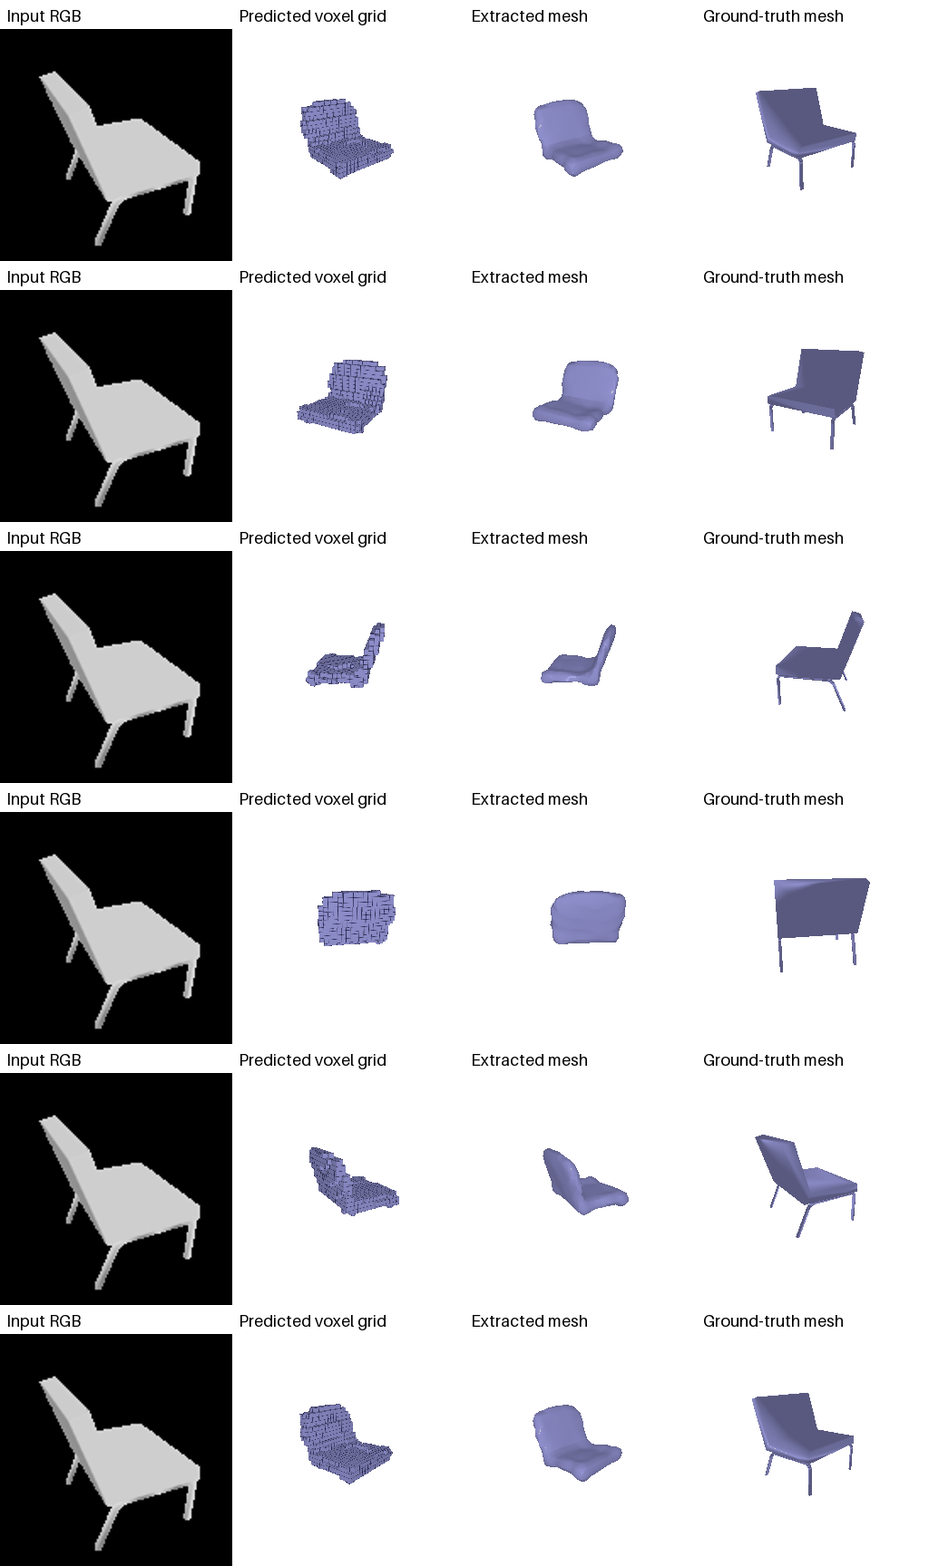
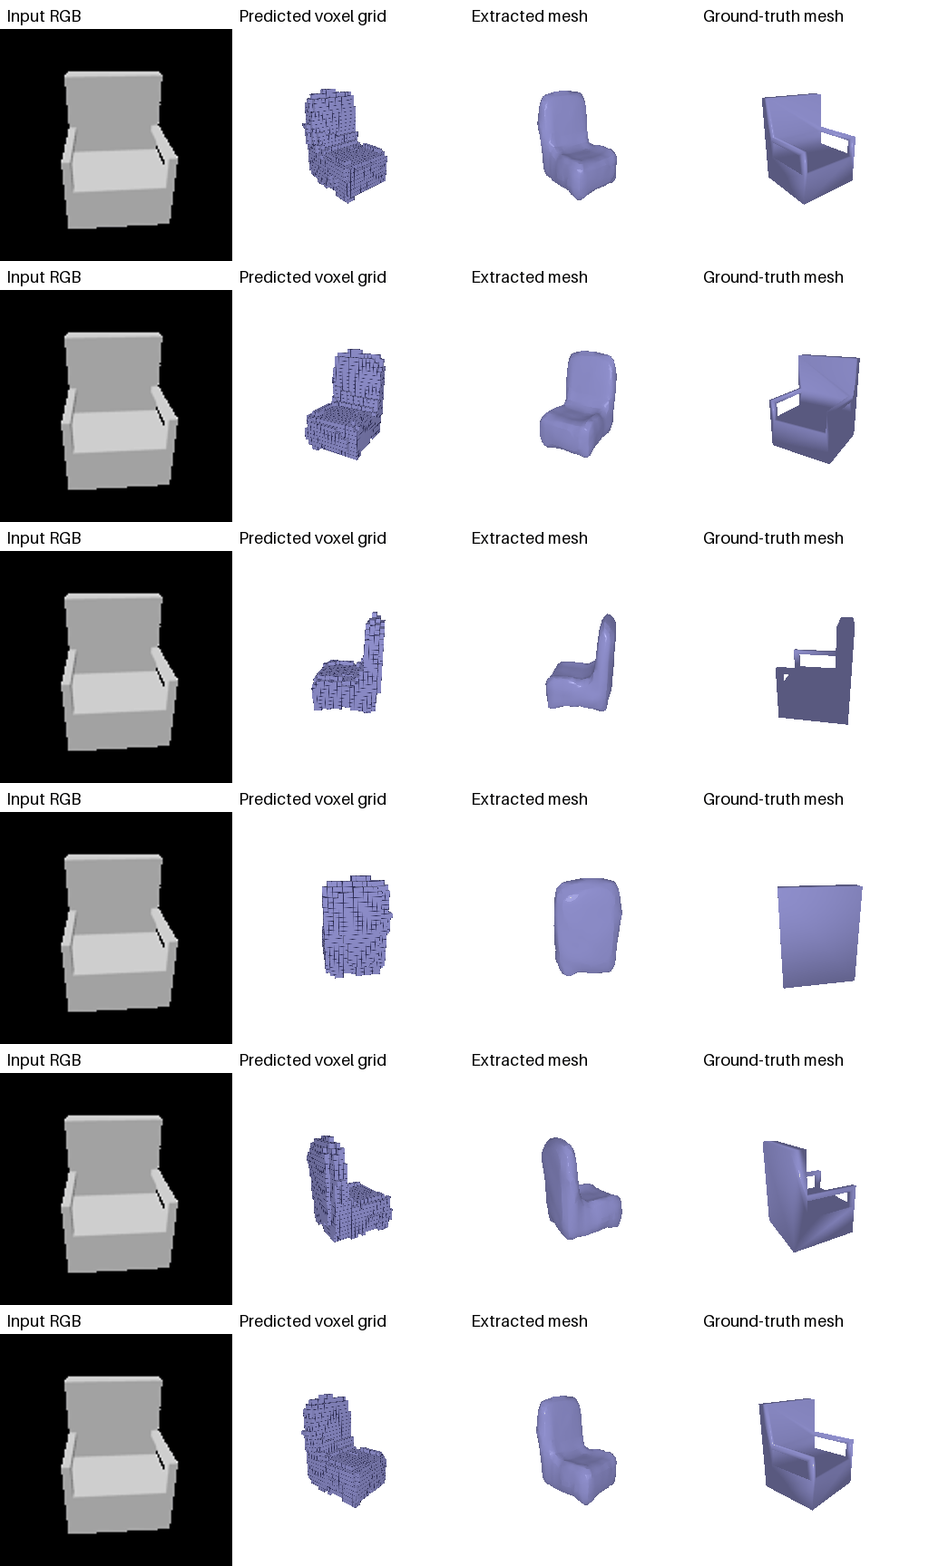
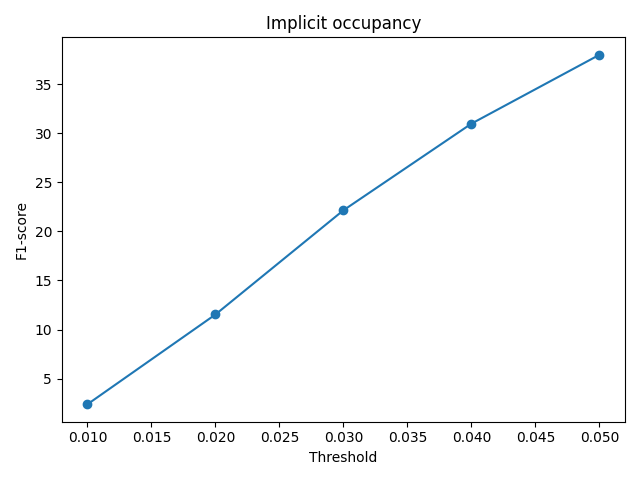
The implicit network scores below the Q2.1 voxel decoder (49.74%). In the shown examples, it captures the broad seat and back but produces rounded shapes and loses thin parts. Predicting occupancy through a shared coordinate MLP gives a smooth field, but the 0.5 cutoff can discard uncertain details.
The decoder concatenates the image feature with sampled 2D coordinates and uses an MLP, 514 → 256 → 256 → 128 → 3, to map them to 3D points. Training uses 1,000 random 2D samples and Chamfer loss; evaluation uses a fixed set of 1,000 samples.
F1@0.05: 70.83%


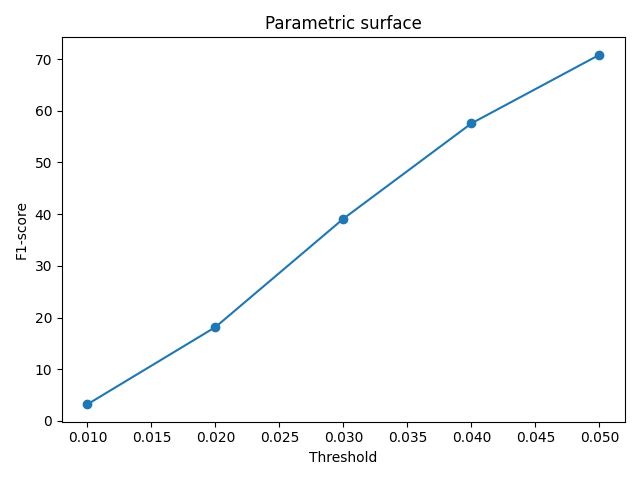
The parametric network scores below the Q2.2 direct point decoder (79.23%). Its point clouds capture the overall seat and back, but coverage is uneven and thin legs are sparse. The shared mapping from a 2D domain encourages a continuous surface, while also making it harder to distribute points independently across distinct chair parts.