Fitting a voxel grid
4 pts
Fitting a point cloud
3 pts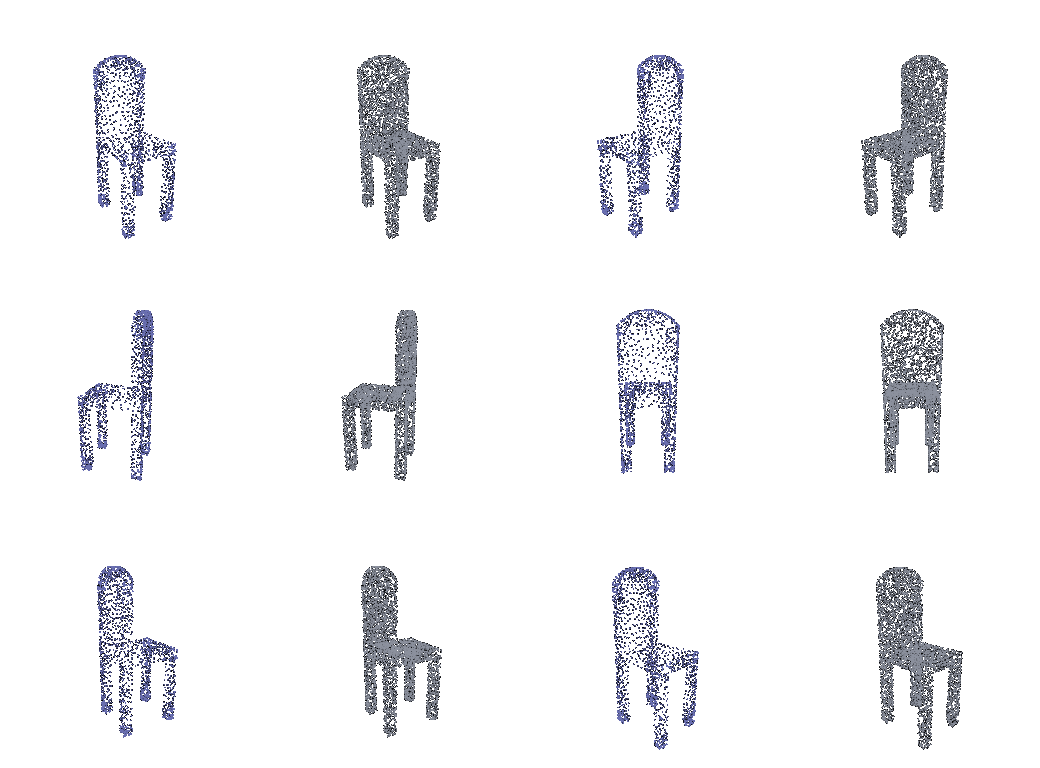
Fitting a mesh
3 pts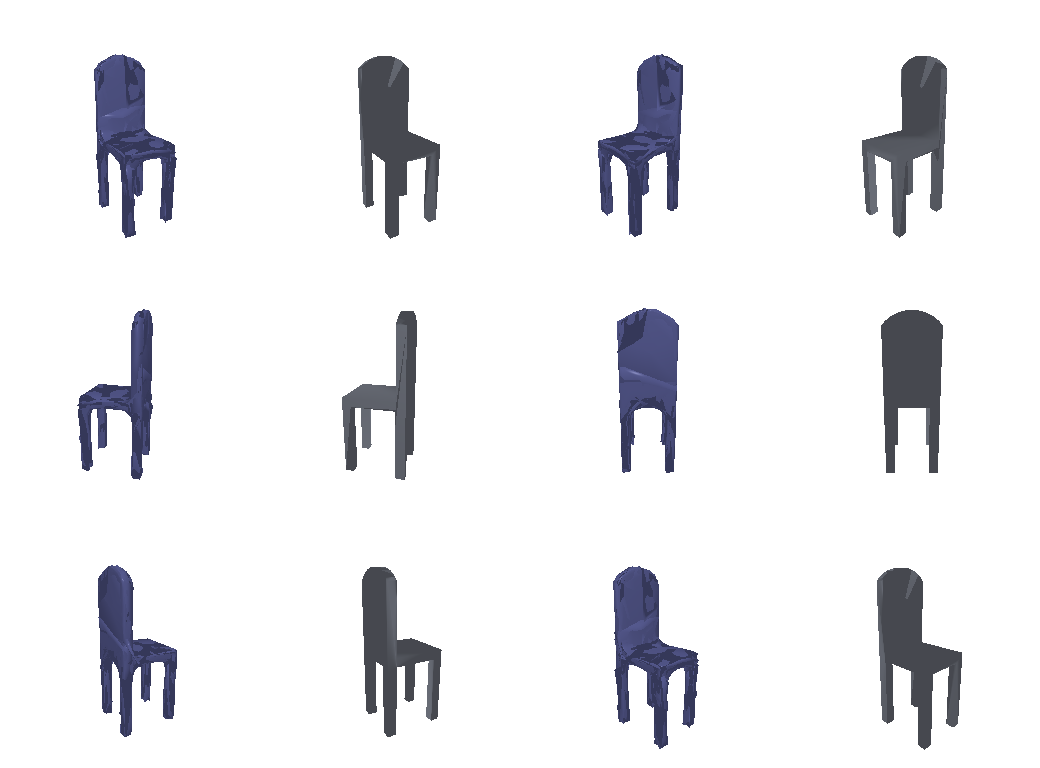
Image to voxel grid
20 ptsAll single-view models are trained end to end from the RGB image (--load_feat was not used). F1 is averaged over all 678 test chairs.
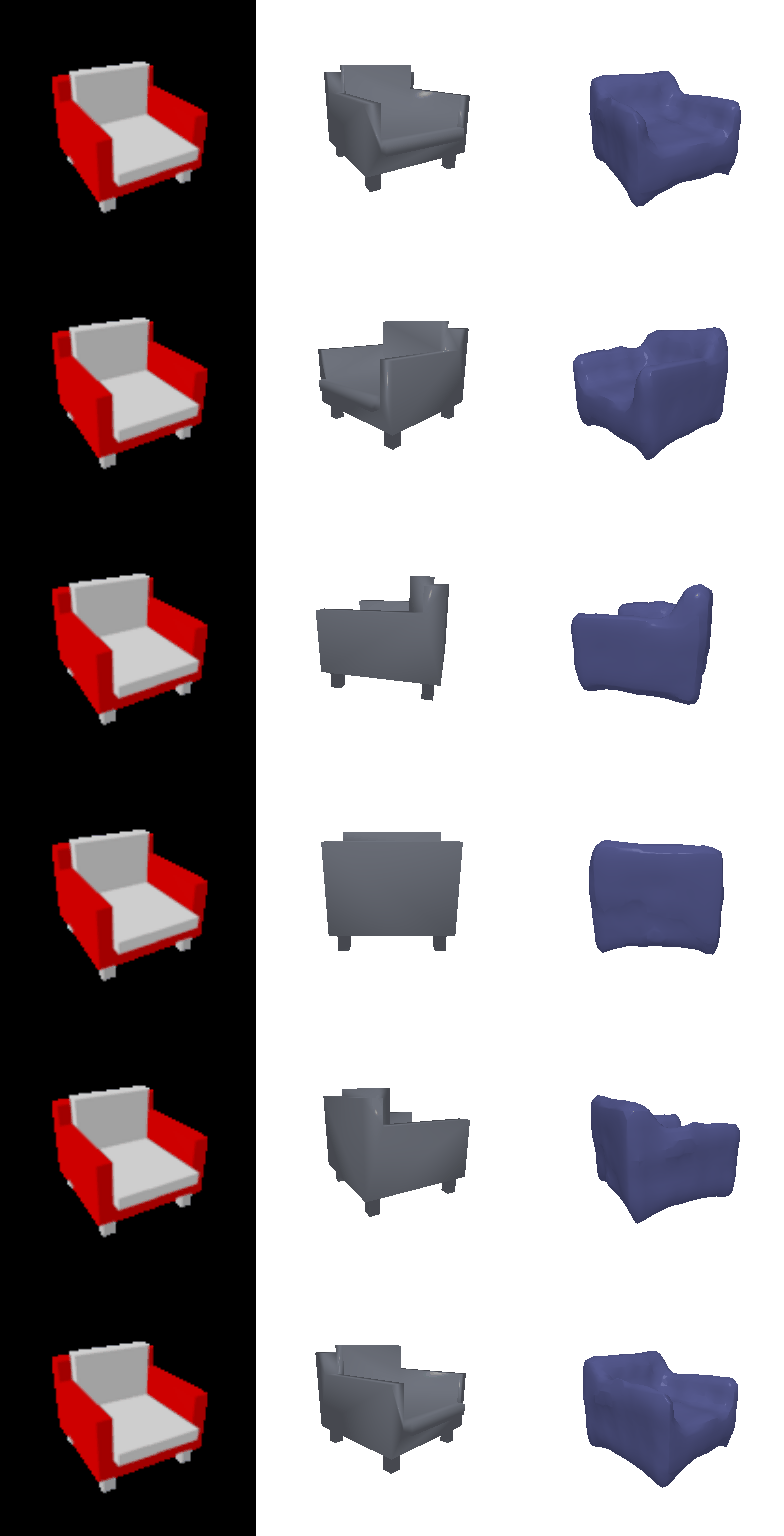
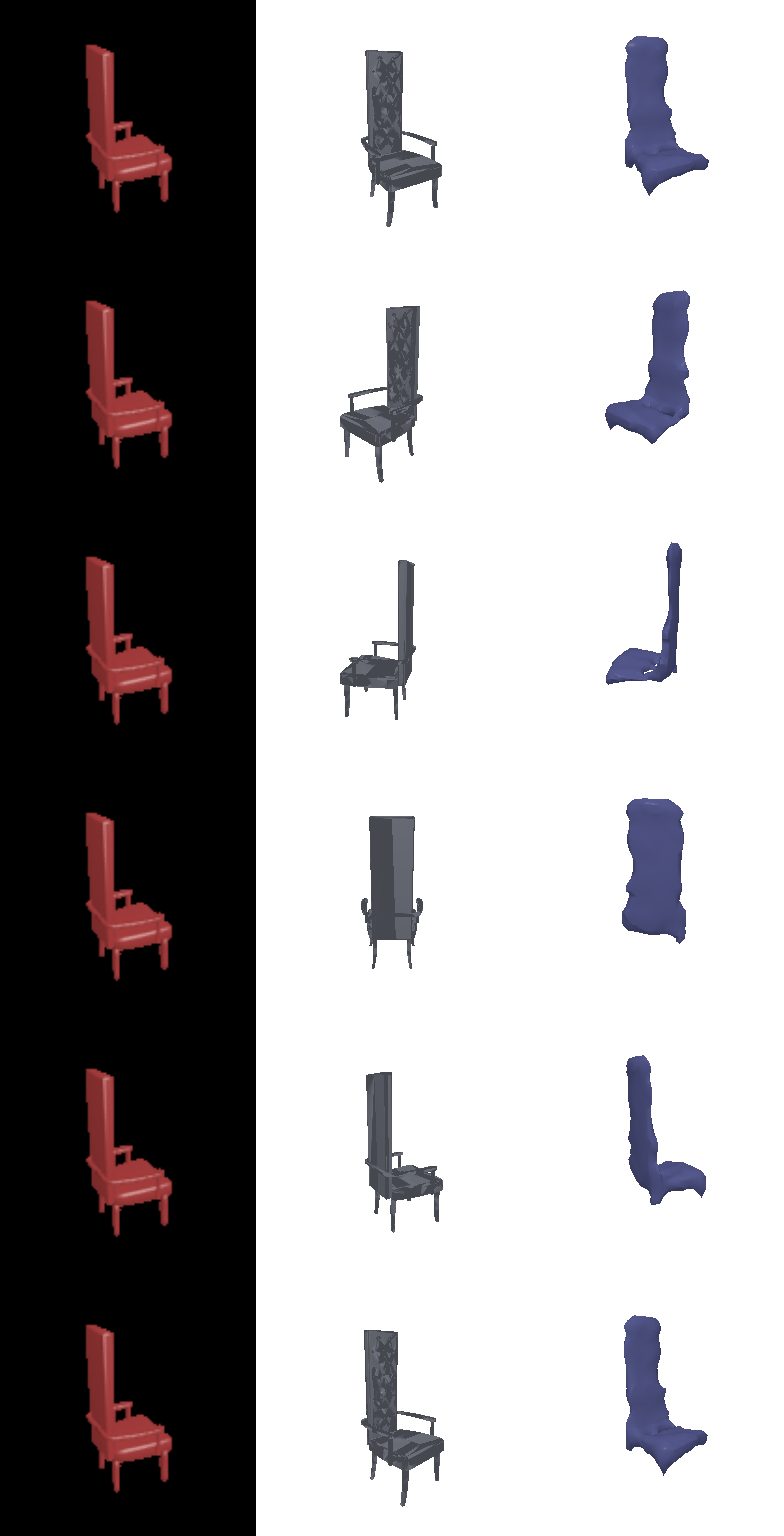
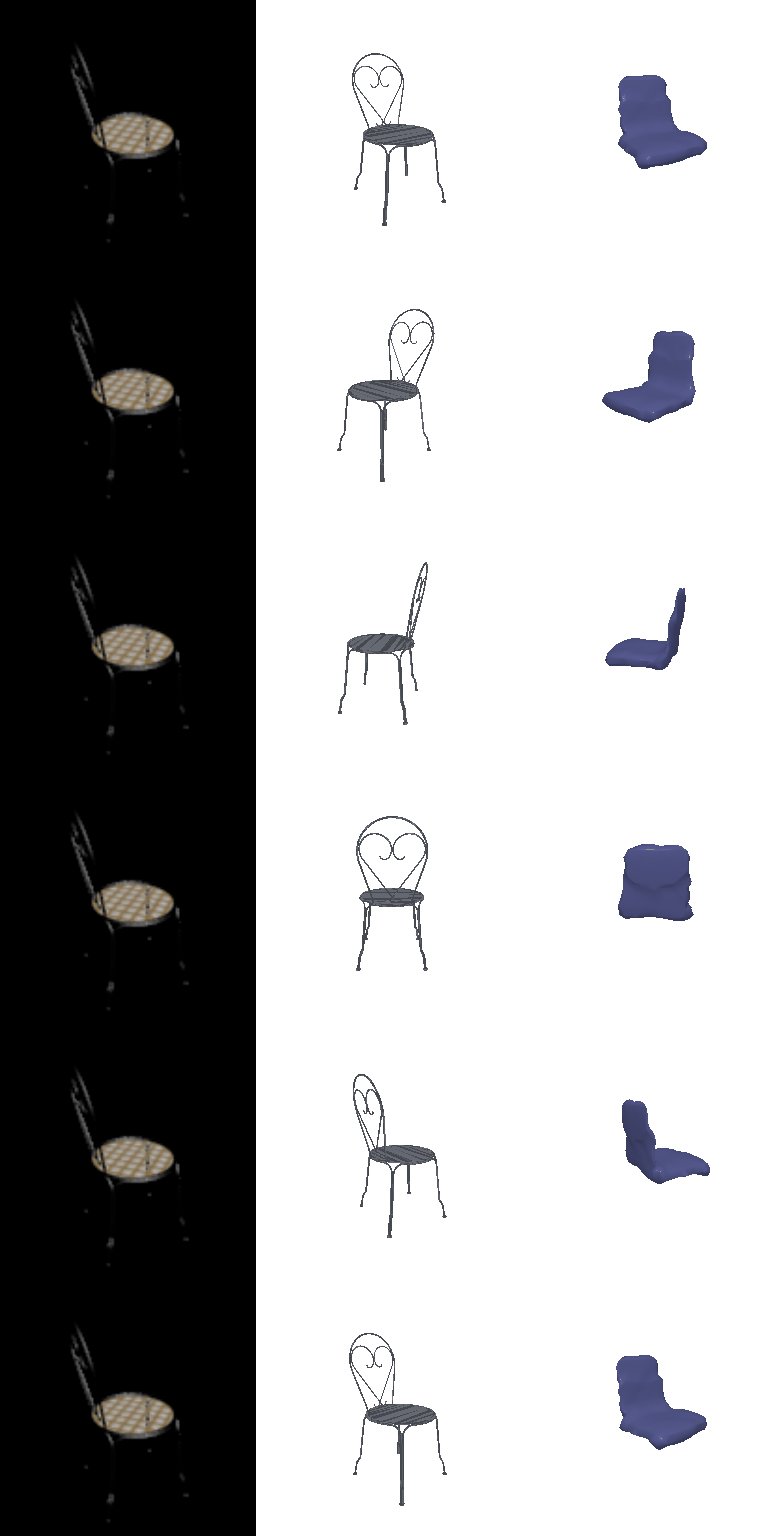
Each row: input RGB view · ground-truth mesh · prediction (360° turntable).
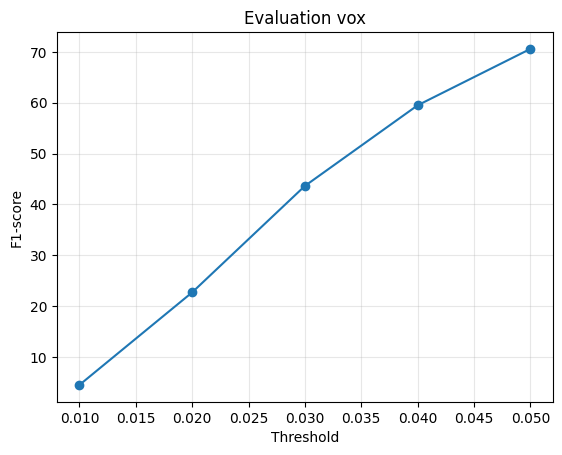
eval_vox.png: F1 against the distance threshold.Image to point cloud
20 pts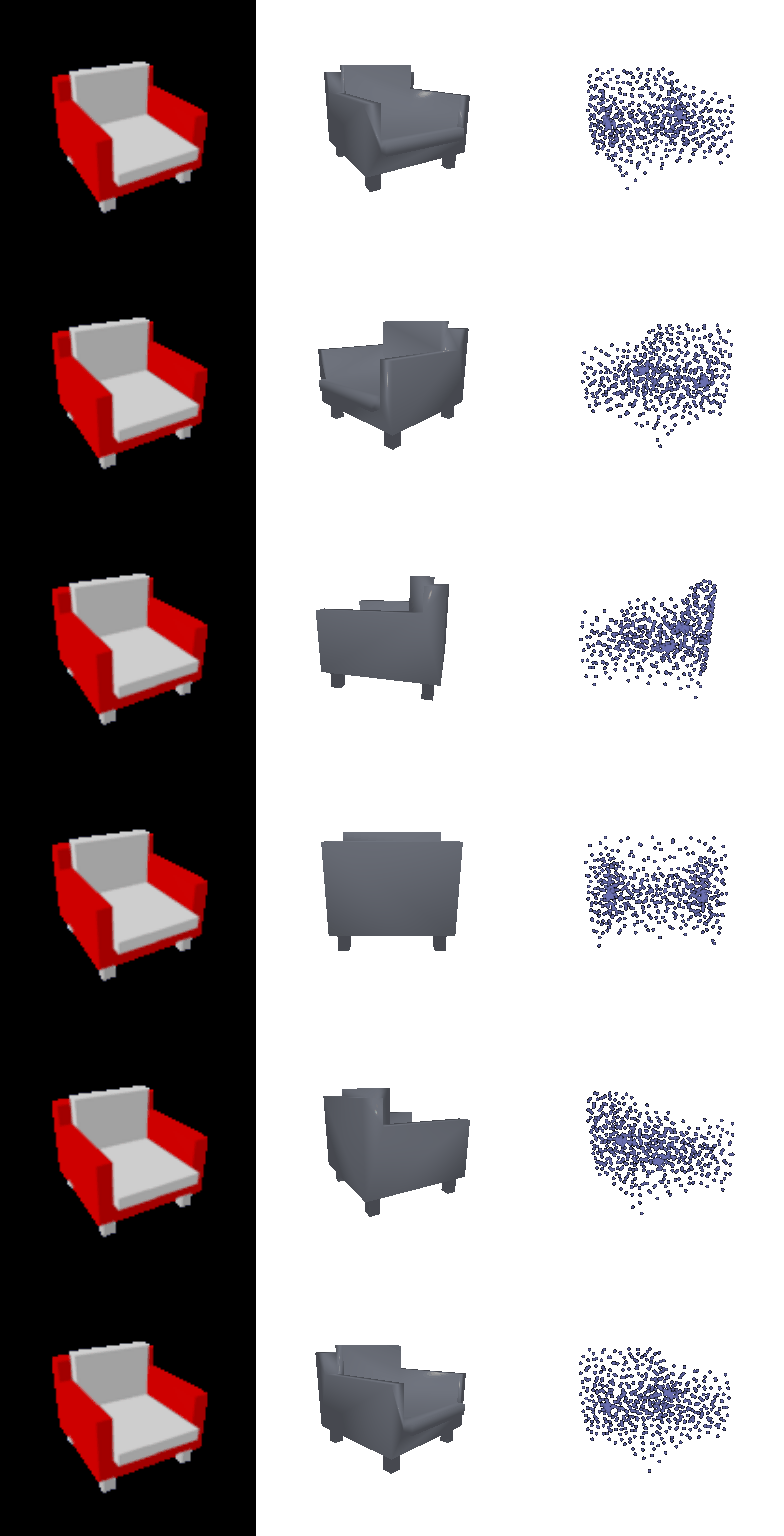
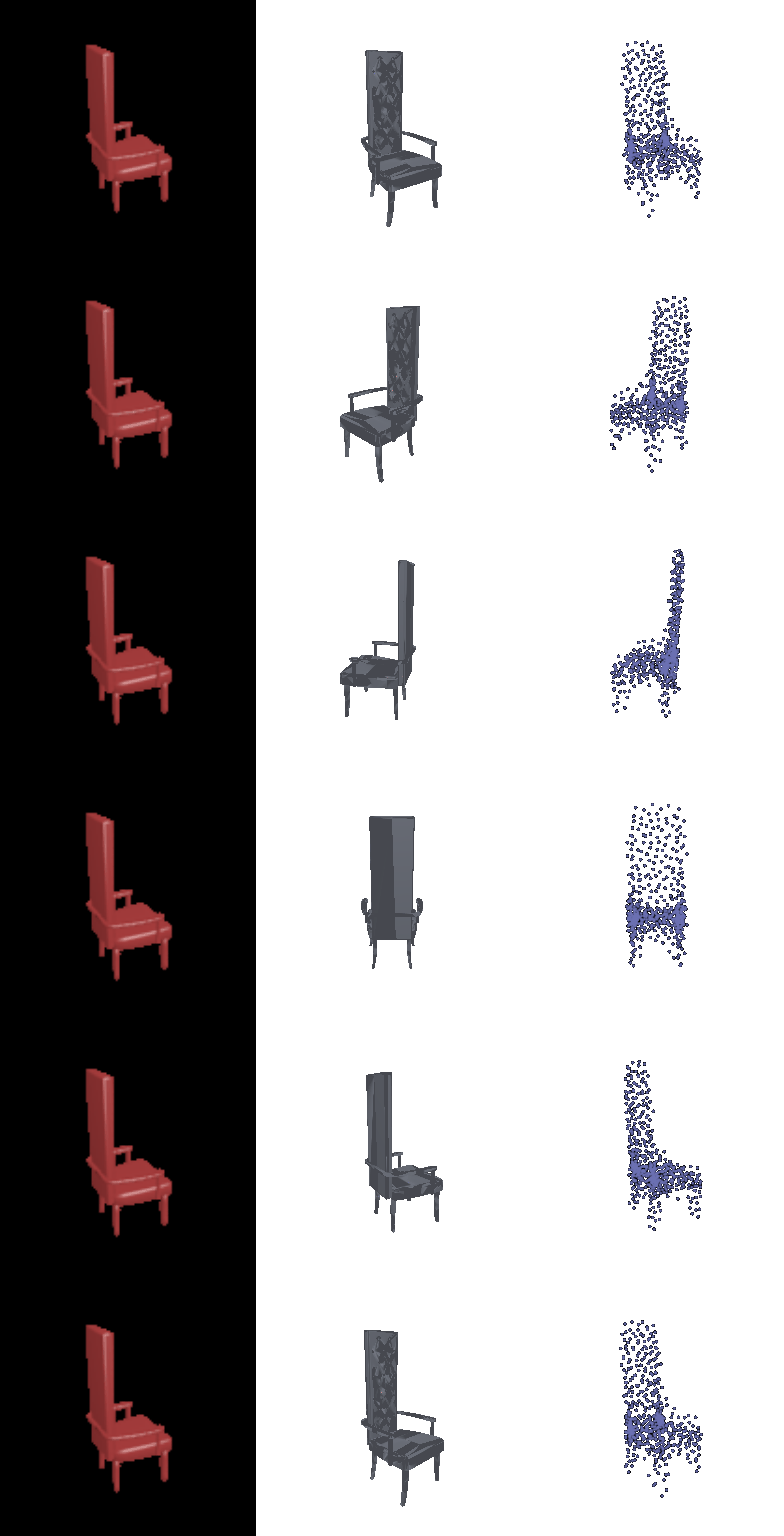
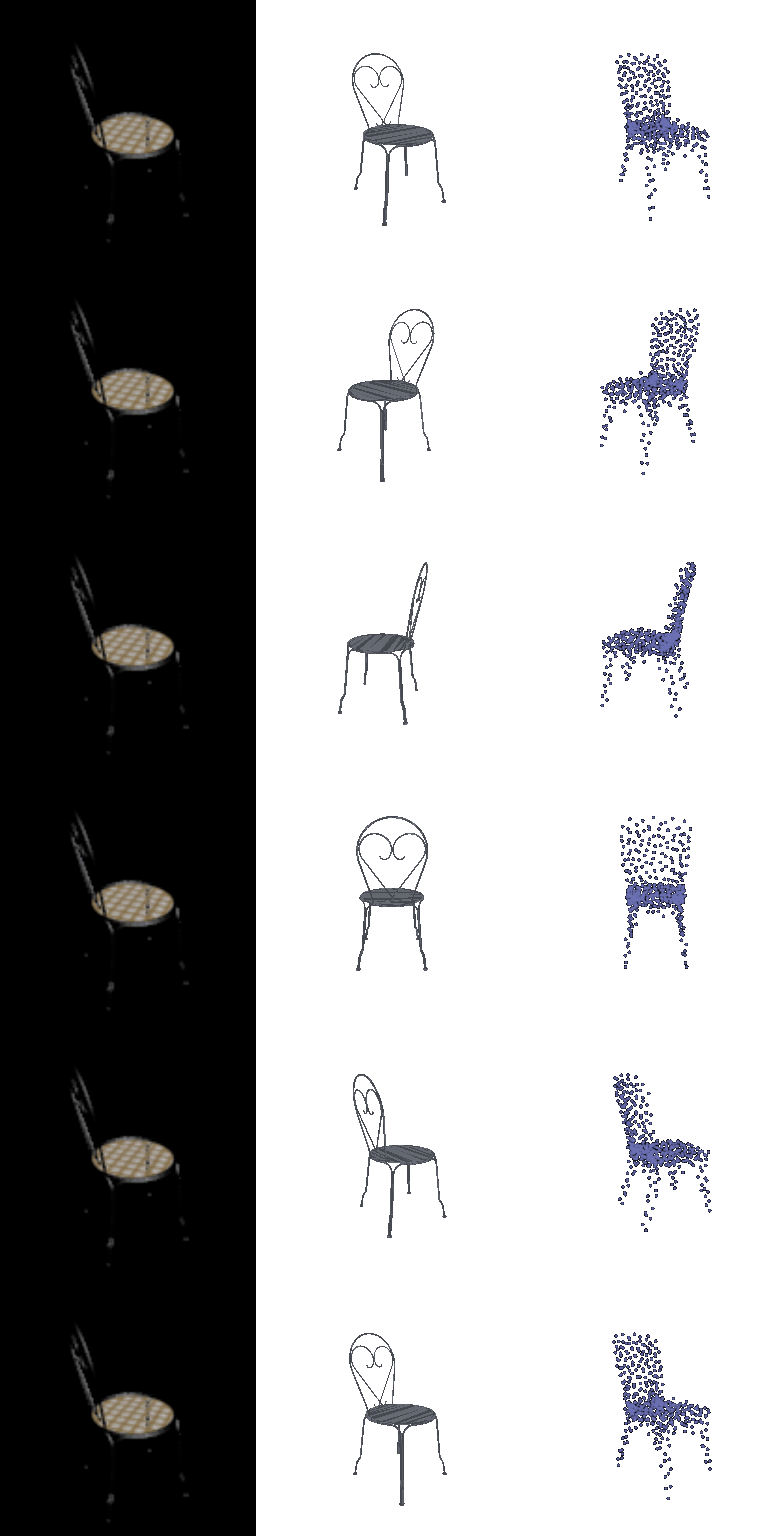
Each row: input RGB view · ground-truth mesh · prediction (360° turntable).
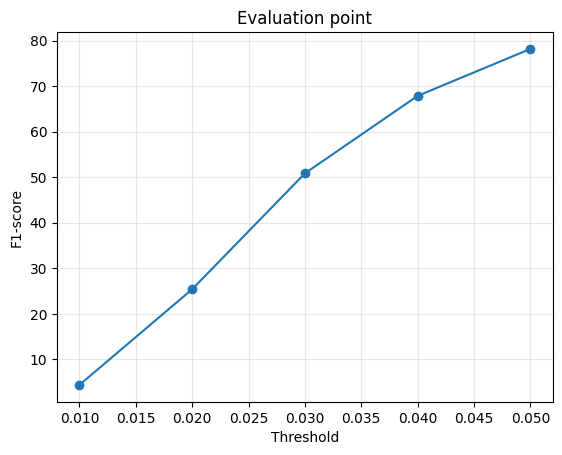
eval_point.png: F1 against the distance threshold.Image to mesh
20 pts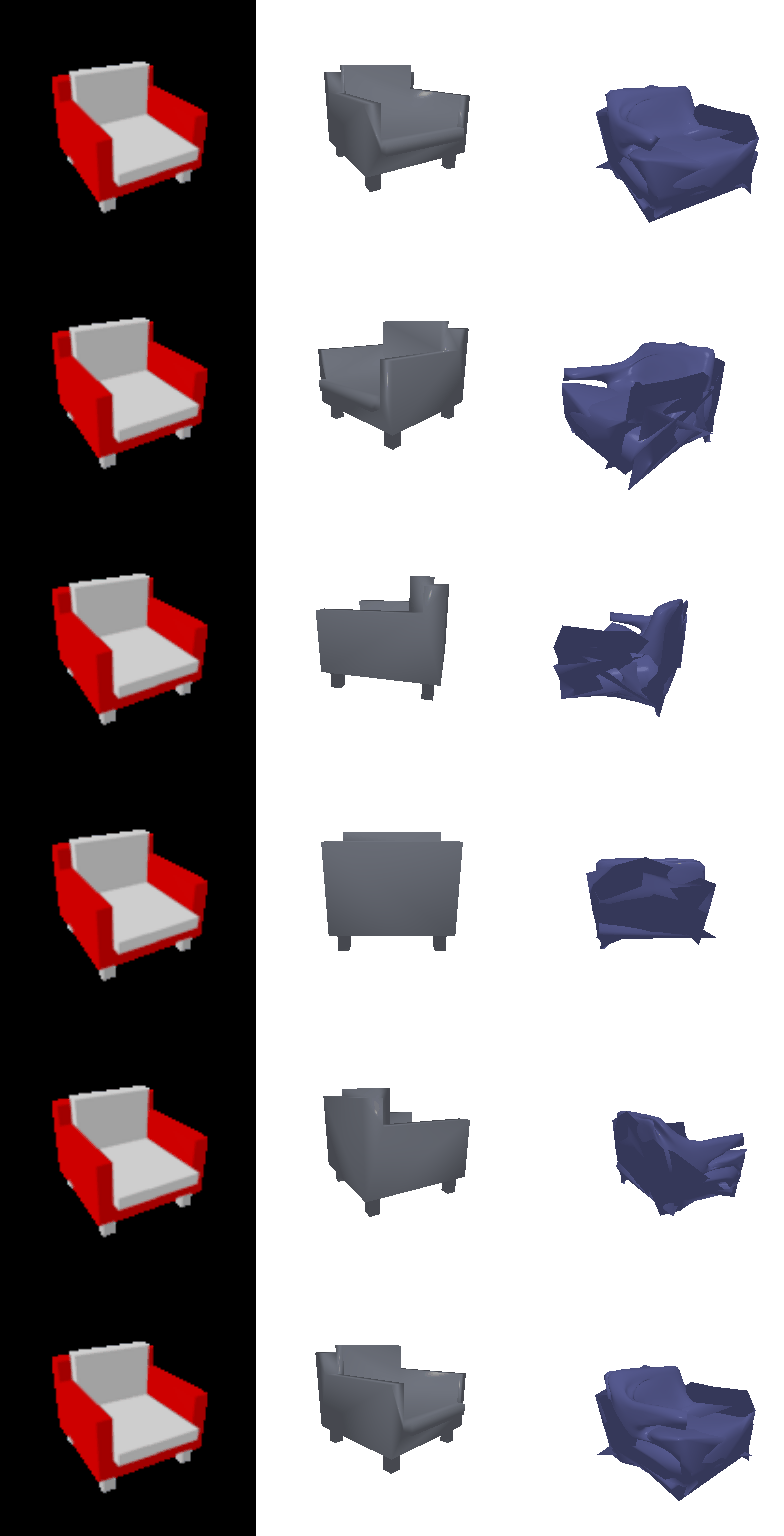
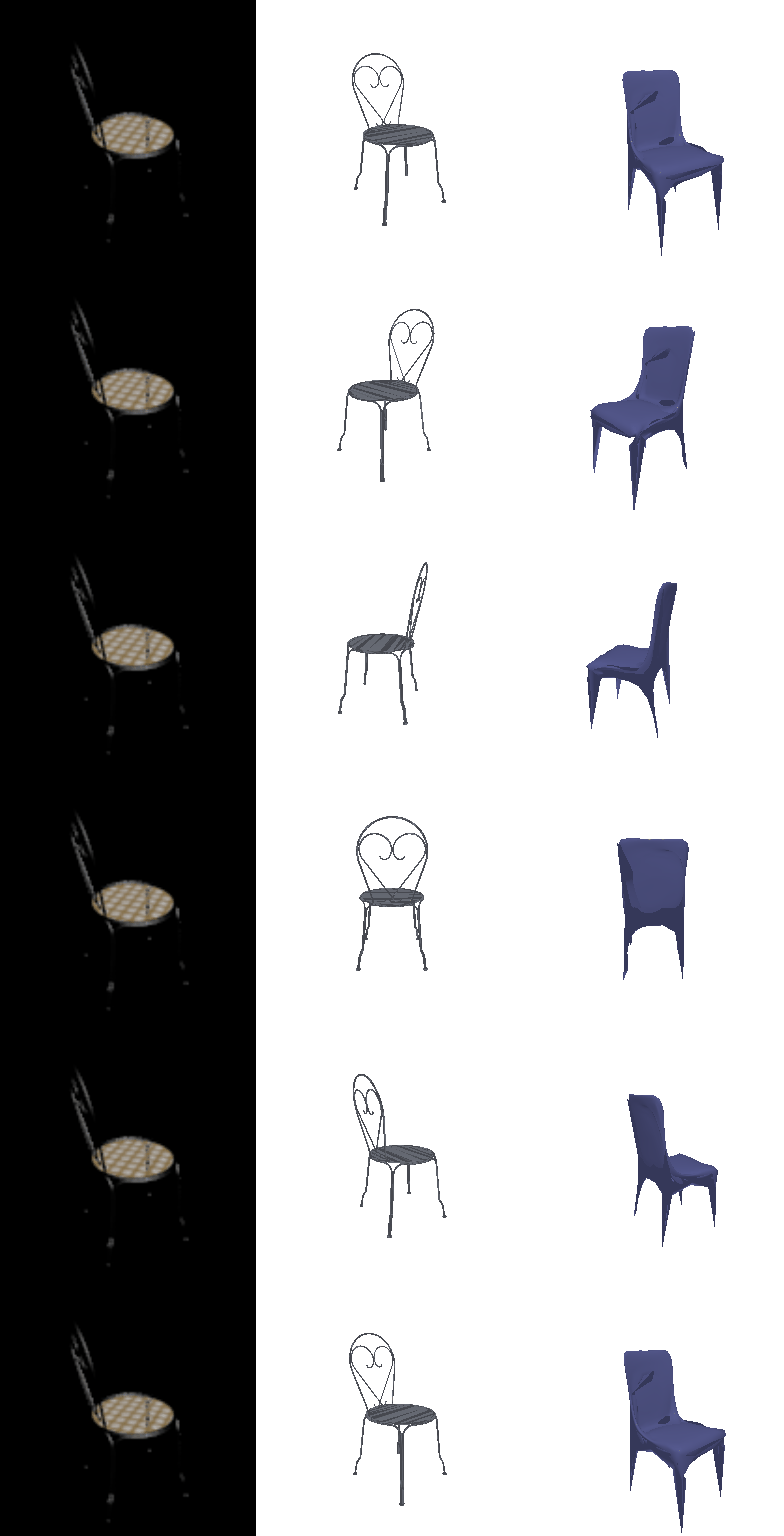
Each row: input RGB view · ground-truth mesh · prediction (360° turntable).
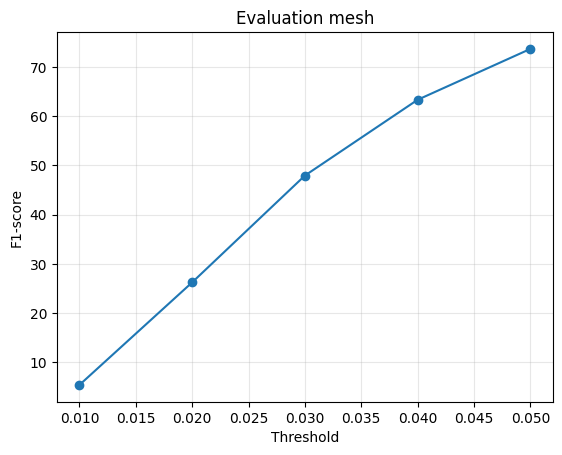
eval_mesh.png: F1 against the distance threshold.Voxel vs point cloud vs mesh
| Representation | F1@0.05 |
|---|---|
| Voxel grid (32³) | 70.57 |
| Point cloud (1,000 points) | 78.16 |
| Mesh (ico-sphere, 2,562 vertices) | 73.63 |
Point cloud > mesh > voxel grid (78.2 > 73.6 > 70.6). The ordering follows how much structure each representation forces on its output:
- Point cloud: no structure
- Points go wherever chamfer wants them, and F1 is itself a nearest-neighbour score on sampled points, so the model optimises almost exactly what is measured. It can also concentrate points where it is confident, giving the highest precision (82.0 vs 73.7 mesh, 72.8 voxel).
- Mesh: one connected genus-0 sheet
- Sampled from a deformed sphere, which cannot open the holes a chair has, so it stretches skin across them and every sample on that skin is a false positive. In return it covers the surface evenly and wins at strict thresholds (F1@0.02: 26.2 vs 25.4).
- Voxels: fixed 32³ resolution
- One cell is about 0.031, already more than half the 0.05 threshold. Parts thinner than a cell rarely clear the 0.5 occupancy threshold and vanish (lowest recall, 71.2).
Effect of the smoothness weight
10 ptsVaried: w_smooth, the weight of the Laplacian term in the mesh loss, over 0, 0.01, 0.1, 1 and 10. Everything else, including the seed, matches the 2.3 model (the 0.1 run). Mean laplacian is the smoothing loss of each predicted test mesh (lower = smoother).
w_smooth | F1@0.05 | Mean laplacian |
|---|---|---|
| 0.0 | 74.59 | 0.1075 |
| 0.01 | 74.24 | 0.0123 |
| 0.1 | 73.63 | 0.0038 |
| 1.0 | 70.19 | 0.0014 |
| 10.0 | 56.04 | 0.0007 |


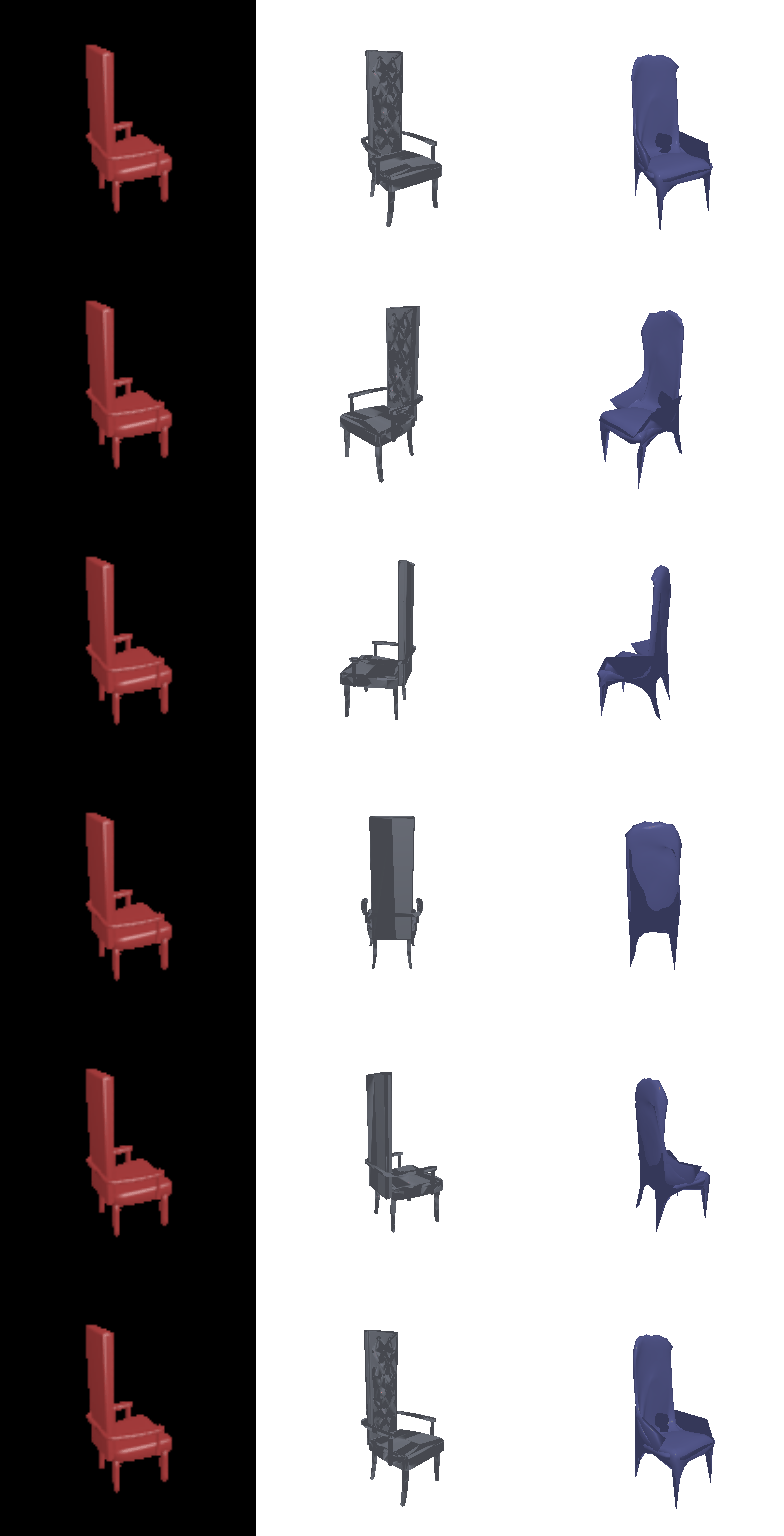
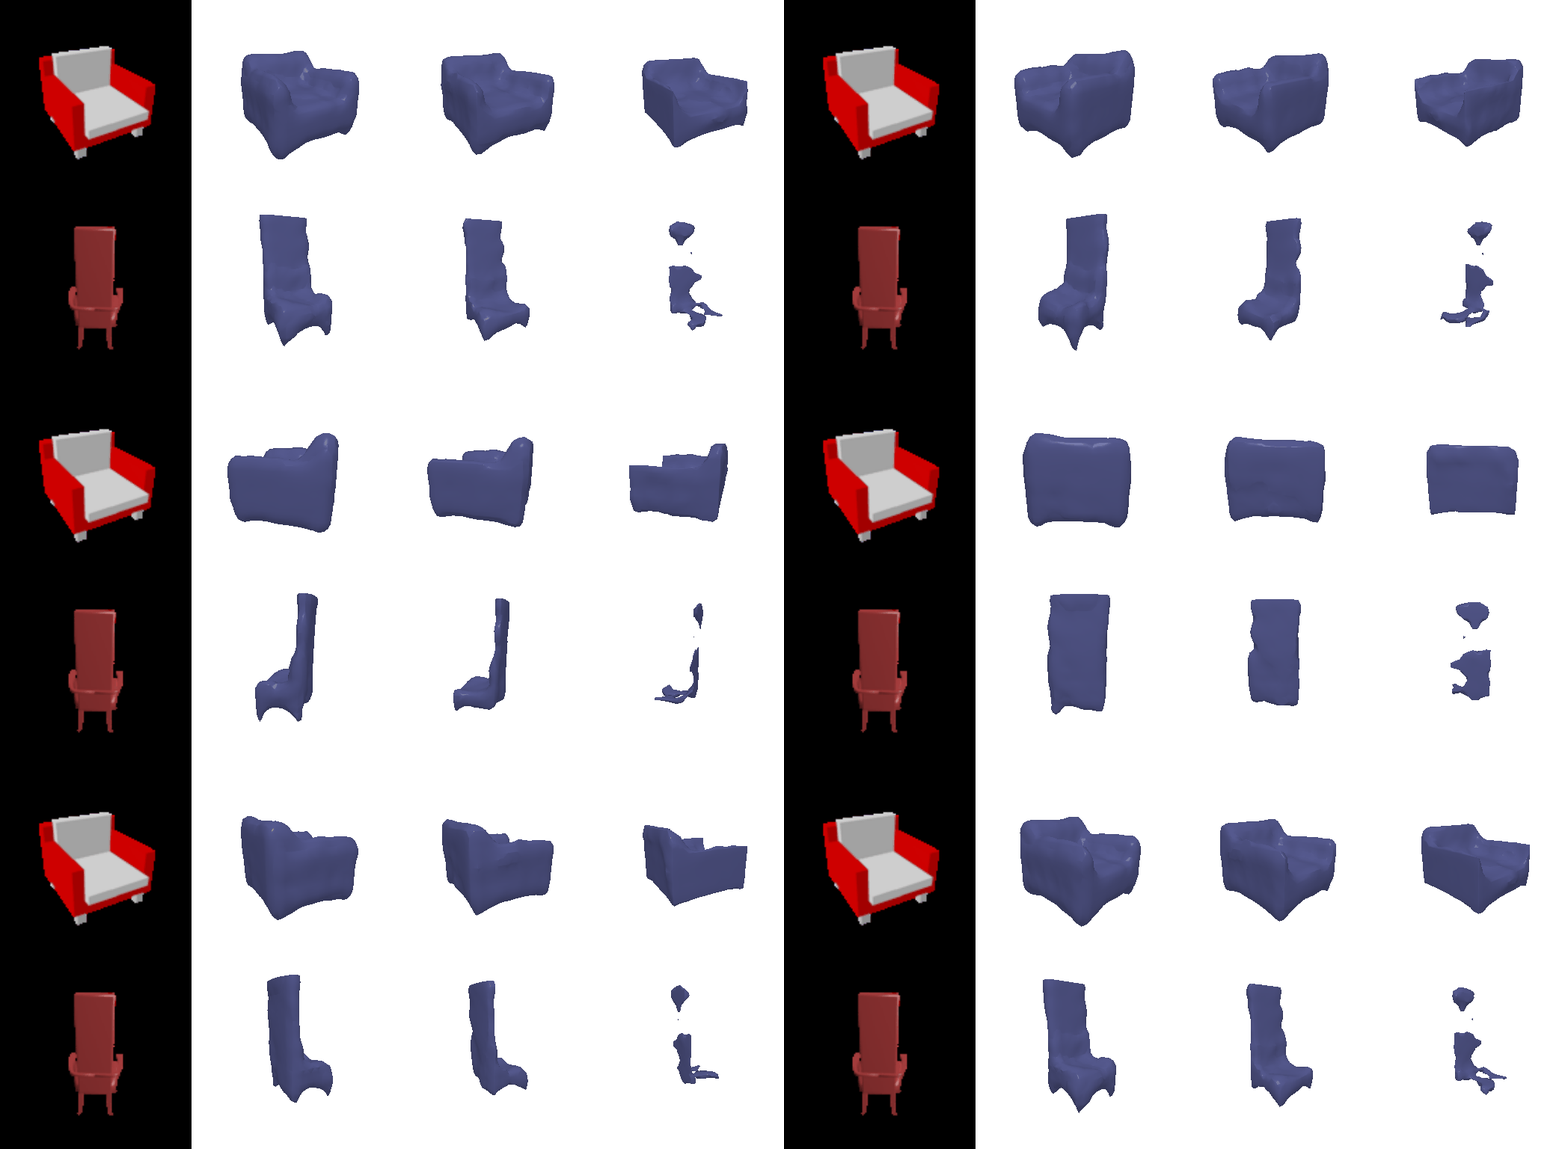
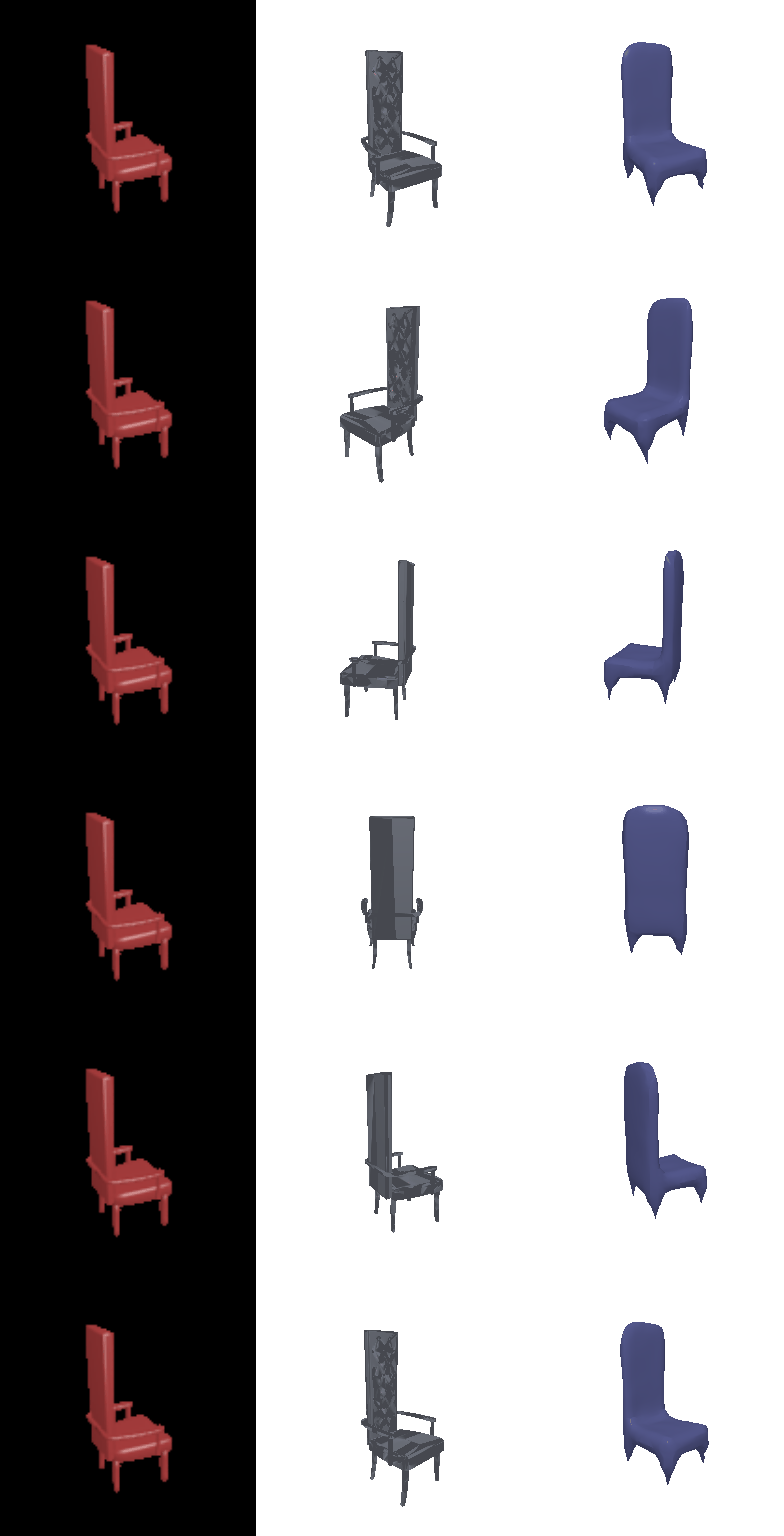
Each row is one test chair. Left to right: input, ground truth, then w_smooth = 0, 0.01, 0.1, 1 and 10.
Conclusion. The trade is lopsided at small weights: 0 → 0.1 makes surfaces 28× smoother (0.1075 → 0.0038) for 1.0 points of F1 (74.6 → 73.6). The unregularised meshes score best but are crumpled sheets, because chamfer sees sampled points and never how the surface between them folds. Past 1 the penalty dominates: the Laplacian pulls vertices to their neighbours' centroid and shrinks the mesh, until at 10 the chair collapses to a blob (F1 56.0). F1 alone would pick w_smooth = 0 because it cannot see surface quality; 0.1 sits at the knee.
Interpreting the models
10 ptsWhere the encoder looks: occlusion sensitivity (point model)

A 24×24 patch of the input is erased at every position of a stride-8 grid and the chamfer distance to the clean prediction recorded. The response is not spread over the silhouette: it peaks on the seat and the seat–back junction. The top of the tall backrest barely matters, so its height comes from the learned prior; on the wire chair the peak is at the legs, the only cue to its height.
What the voxel model is sure of: isosurfaces at 0.2 / 0.5 / 0.8
The predicted occupancy meshed at three isovalues. For the common armchair all three surfaces are nearly identical — confident everywhere. For the unusual tall chair the 0.8 surface breaks into fragments and the 0.2 surface is bulkier than the 0.5: the model hedges, spreading moderate probability over a thick region instead of committing to thin parts.
The point decoder learned a template, not a set

Each of the 1,000 output slots is coloured by where it lands on the first chair (x, y, z → r, g, b); the other chairs reuse those colours. The layout survives across very different chairs, so the decoder has learned a canonical ordering — a shared template it deforms per image — even though chamfer loss is invariant to point order.
A smooth shape space: interpolating image features

Encoder features of two test images are linearly interpolated in 5 steps and decoded by the voxel model. Every intermediate is a plausible chair and the change is gradual: armrests disappear, the seat narrows, the backrest rises. The decoder learned a continuous shape space, not a lookup of training shapes.
Implicit network
10 pts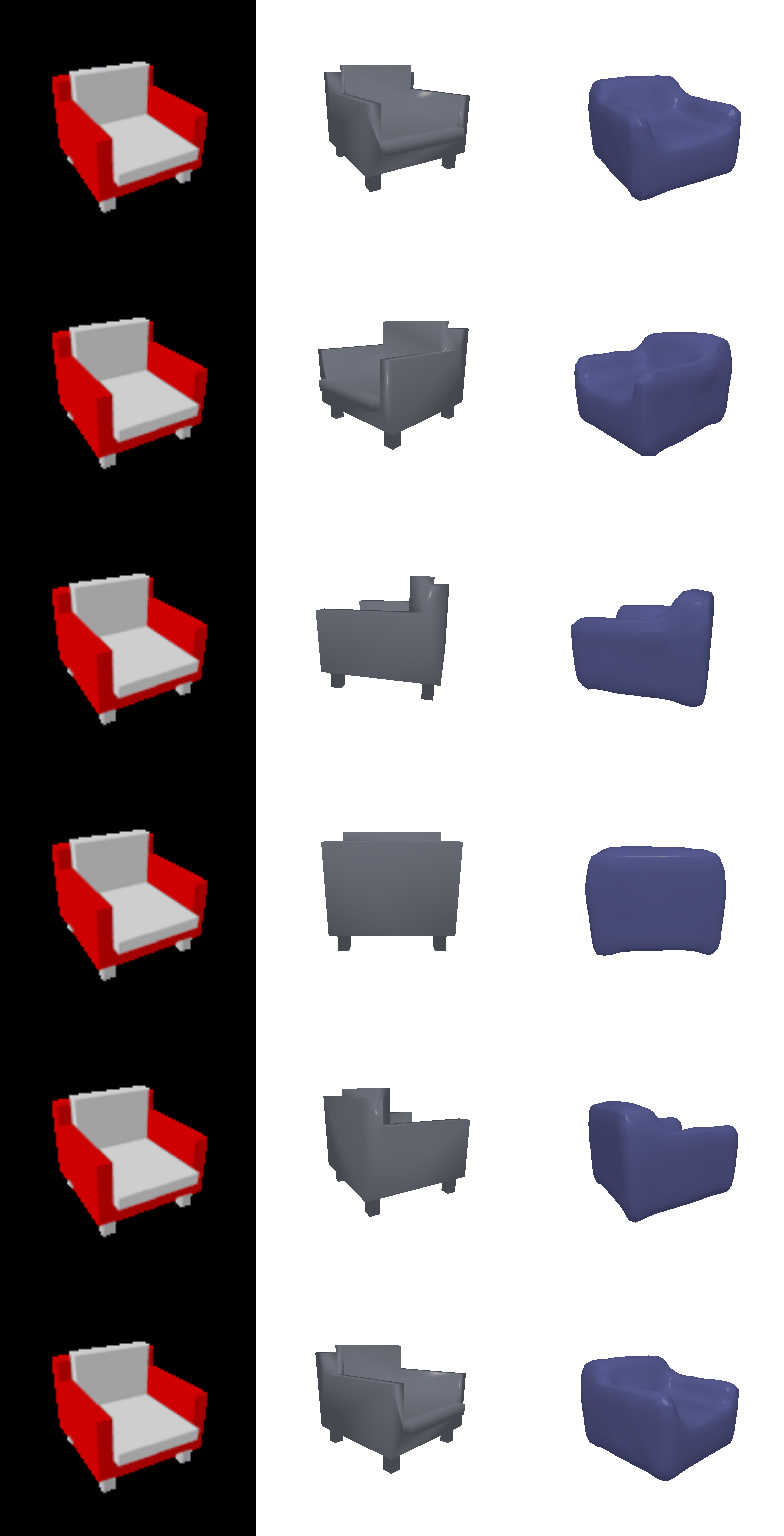
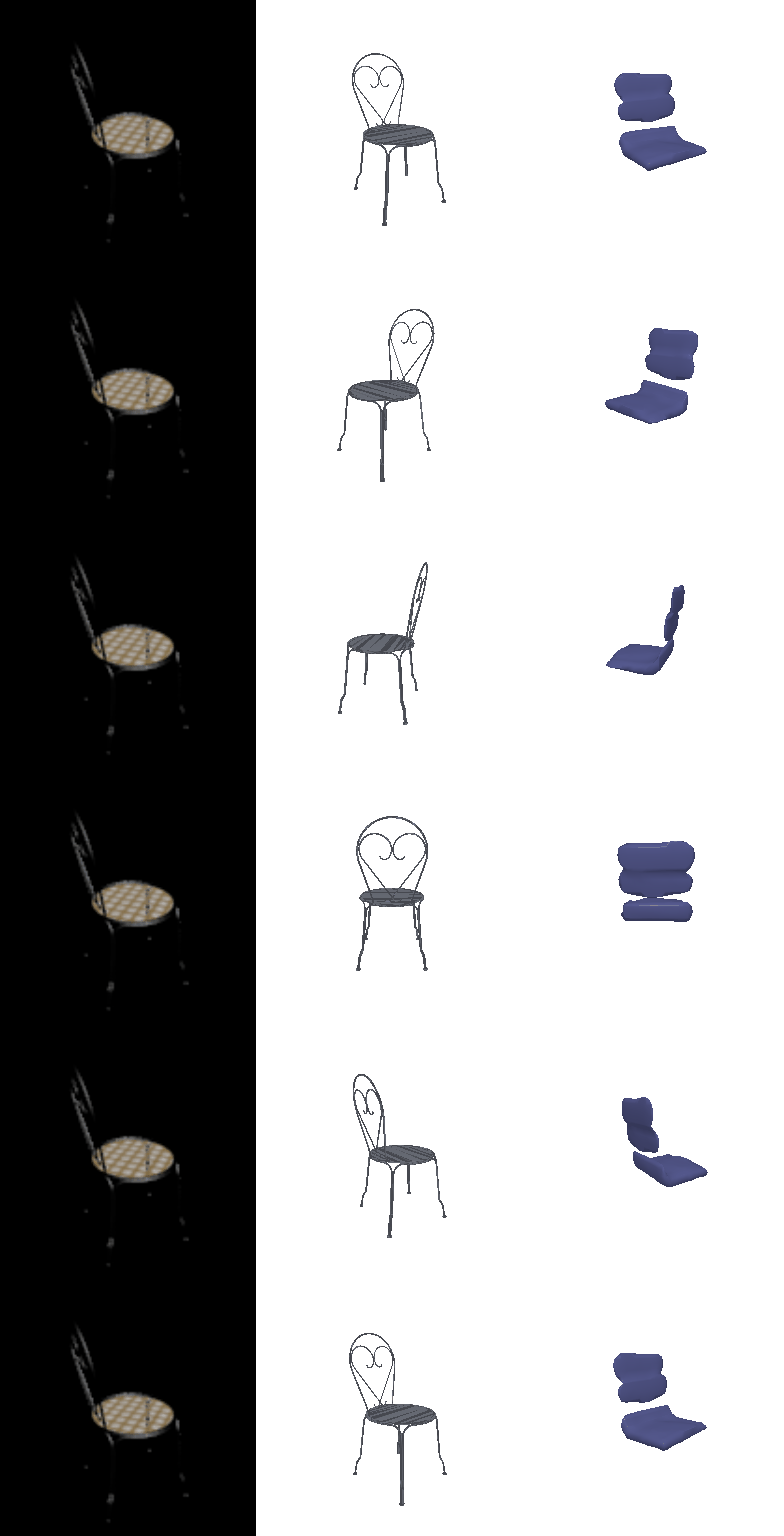
Each row: input RGB view · ground-truth mesh · prediction (360° turntable).
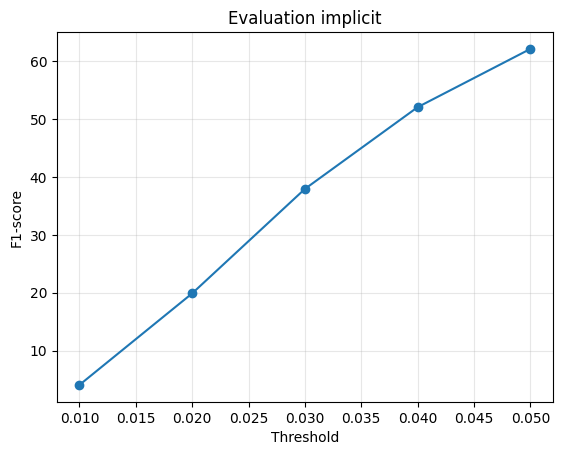
eval_implicit.png: F1 against the distance threshold.An MLP f(image feature, x) → occupancy logit: the query point is lifted to 256 dimensions and the image feature added to it before each of three residual blocks. Trained with BCE at 2,048 query points per chair; evaluated on a 32³ meshgrid through the same marching-cubes and F1 path as the voxel model.
Effect compared with the voxel decoder (2.1)
Same encoder, schedule and evaluation; F1@0.05 drops from 70.6 to 62.1. Precision is unchanged (72.8 vs 71.9) while recall falls (71.2 → 60.3), so it misses parts rather than inventing them. The cause is supervision density: a chair fills only 4.1% of the grid, so about 84 of 2,048 uniform query points land inside it and thin parts are rarely sampled, whereas the voxel decoder is supervised on all 32,768 cells. In return its surfaces are smoother, since neighbouring cells share one continuous function.
Parametric network
+10 EC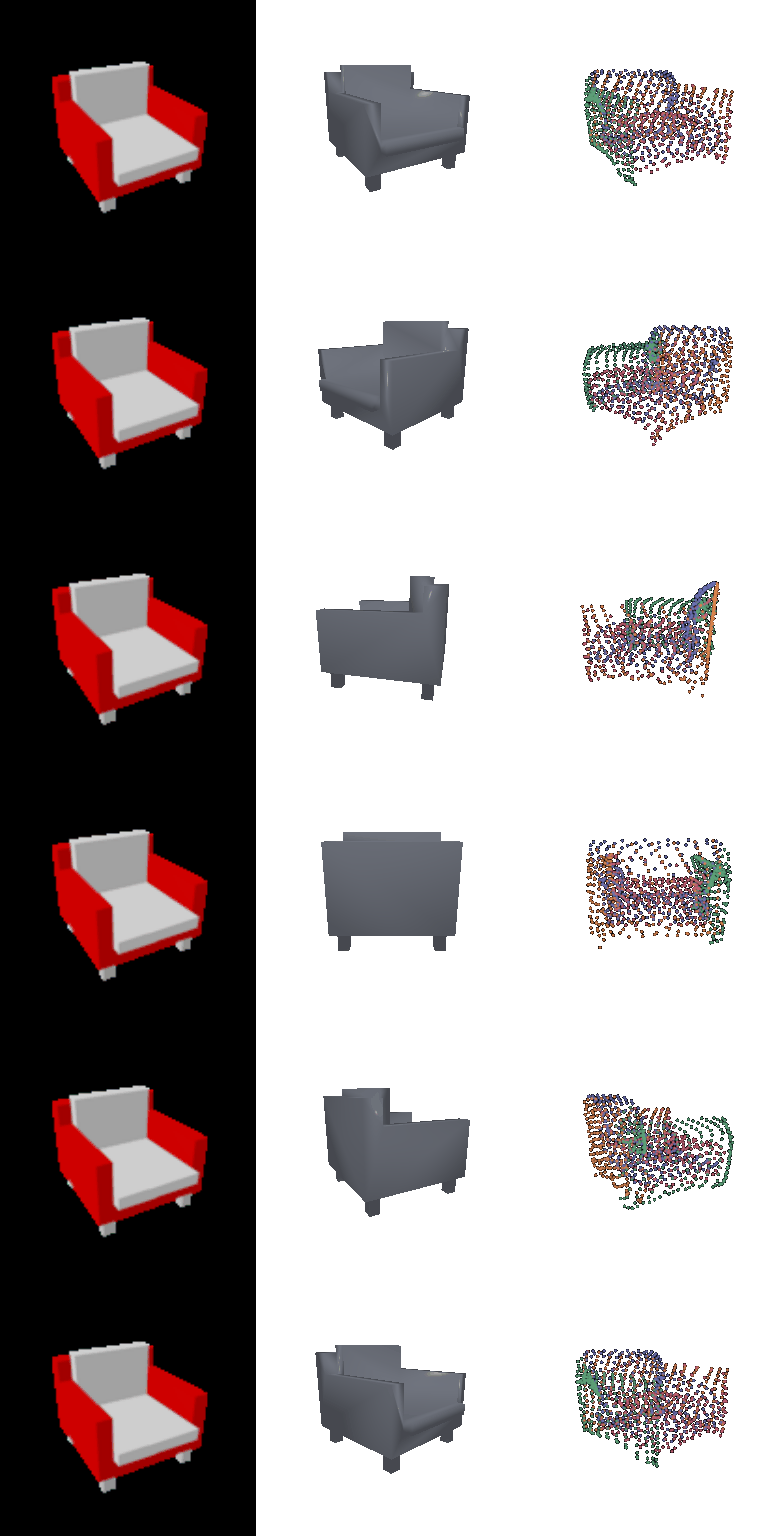
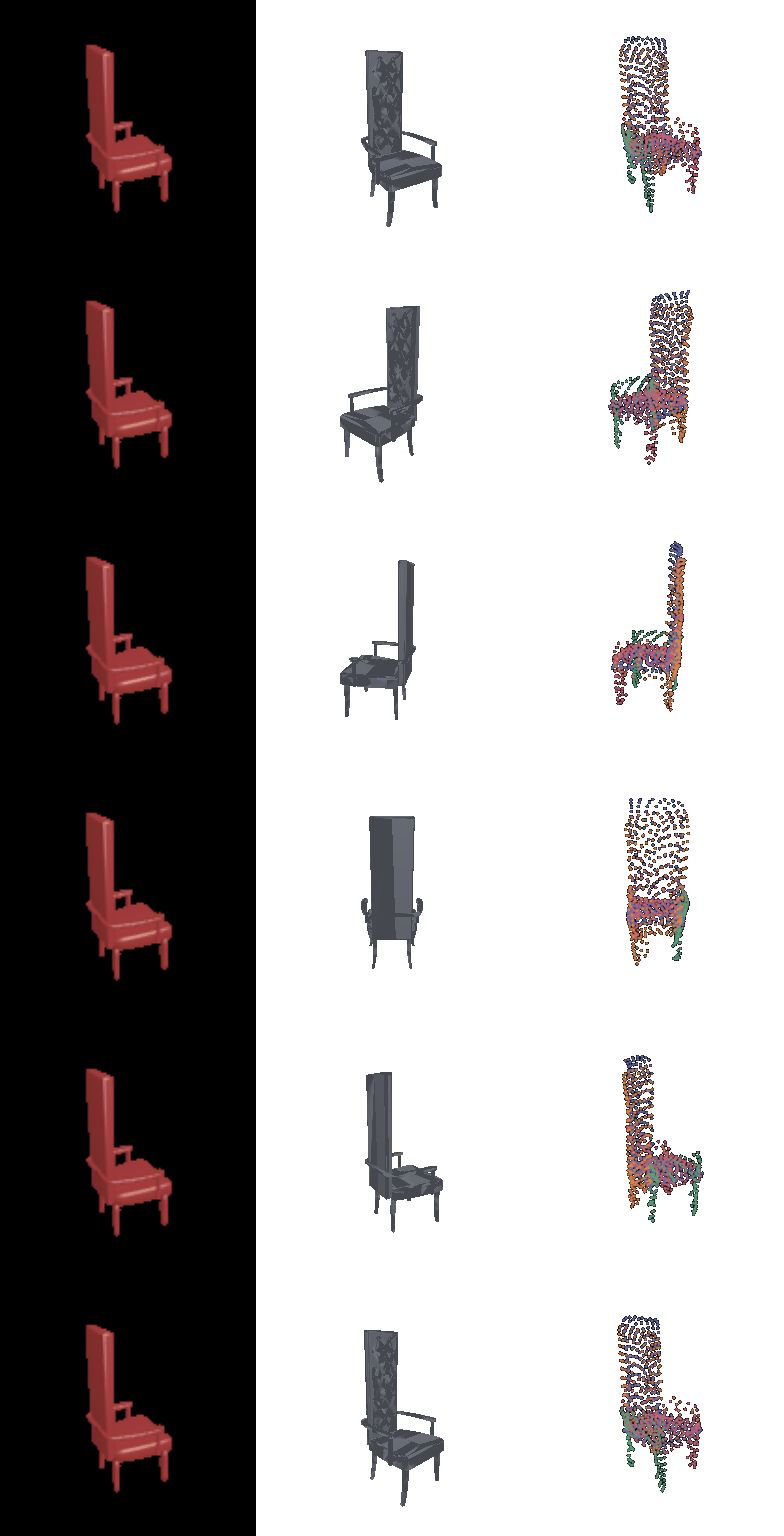
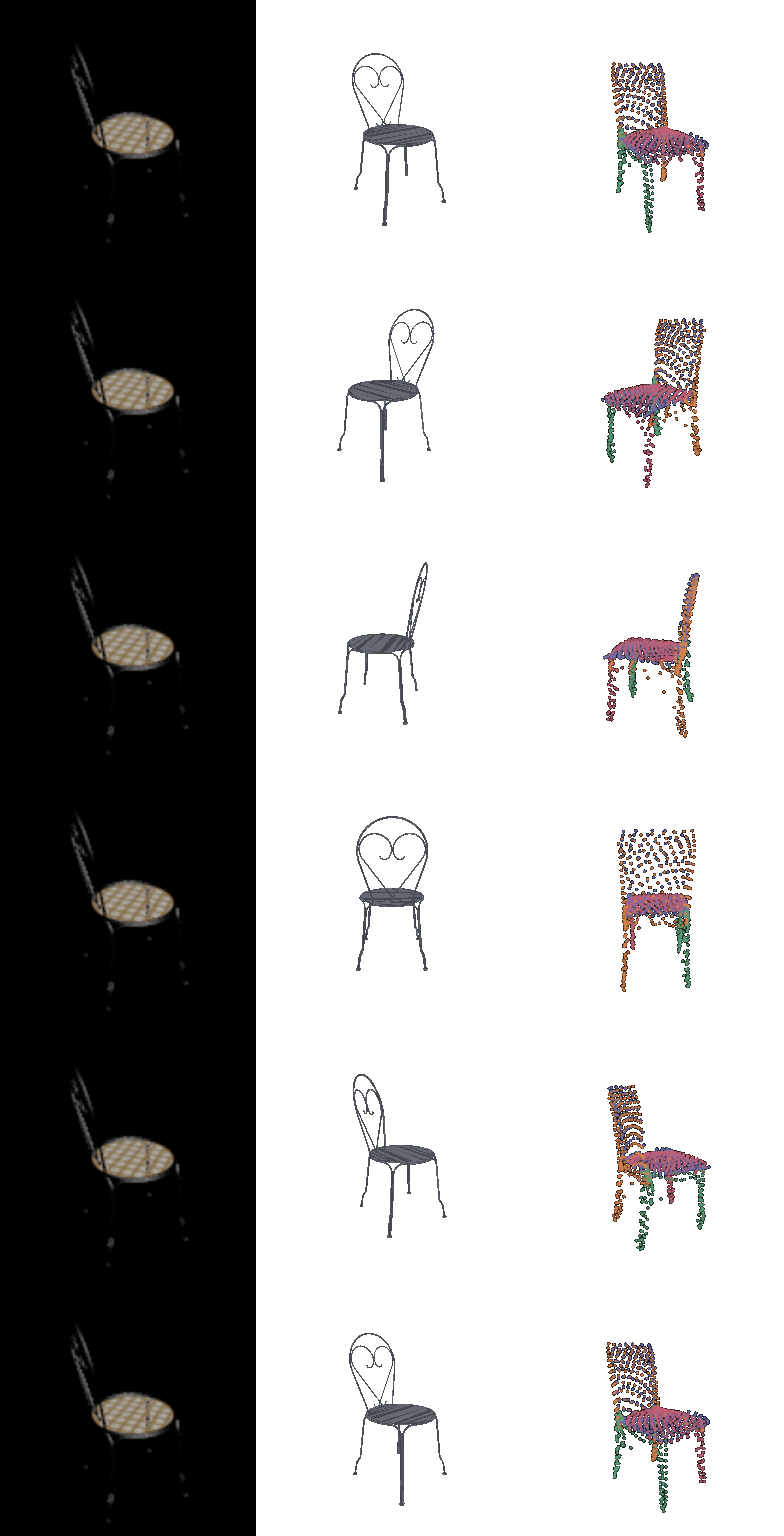
Each row: input RGB view · ground-truth mesh · prediction (360° turntable).
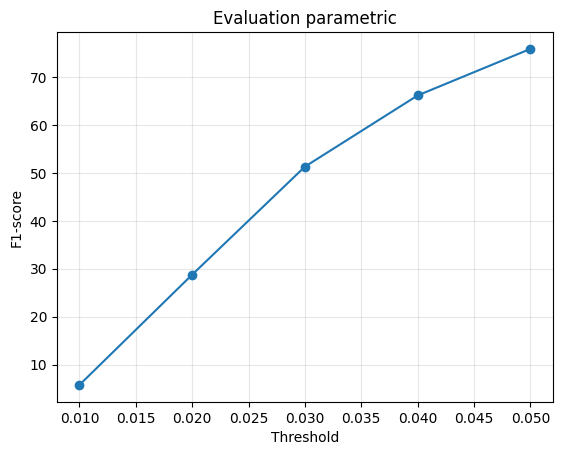
eval_parametric.png: F1 against the distance threshold.AtlasNet-style: 4 independent MLPs, each mapping (image feature, u, v) with (u, v) ∈ [0, 1]² to a 3D point, trained with chamfer against 1,024 surface samples. Colours in the renders mark the patch.
Effect compared with the point decoder (2.2)
F1@0.05 is 75.9 against 78.2; recall is the same (76.3 vs 76.5) and the gap is all precision (76.1 vs 82.0). Each patch is a continuous sheet, so it cannot break where the chair has a gap and some points bridge between parts, while the free point decoder can pile points onto the confidently known seat and back. The parametric model wins at strict thresholds (F1@0.02: 28.8 vs 25.4): its points spread evenly rather than clump, and the patches split the chair into parts without being told to.
Extended dataset: one class vs three
+10 ECThe voxel model of 2.1 retrained on chair + car + plane, with the same encoder, batch size, schedule and iterations. The 3-class chair test split is the 1-class one, so both models are scored on the same 678 test chairs from the same view.
| Test class | Samples | 1-class model | 3-class model | Perfect voxels |
|---|---|---|---|---|
| chair | 678 | 70.57 | 61.24 | 79.28 |
| car | 368 | 28.62 | 30.42 | 46.78 |
| plane | 405 | 18.60 | 85.69 | 90.53 |
F1@0.05 per test class. Perfect voxels: each object's own ground-truth 32³ grid through the same evaluation — the best any voxel model can score.


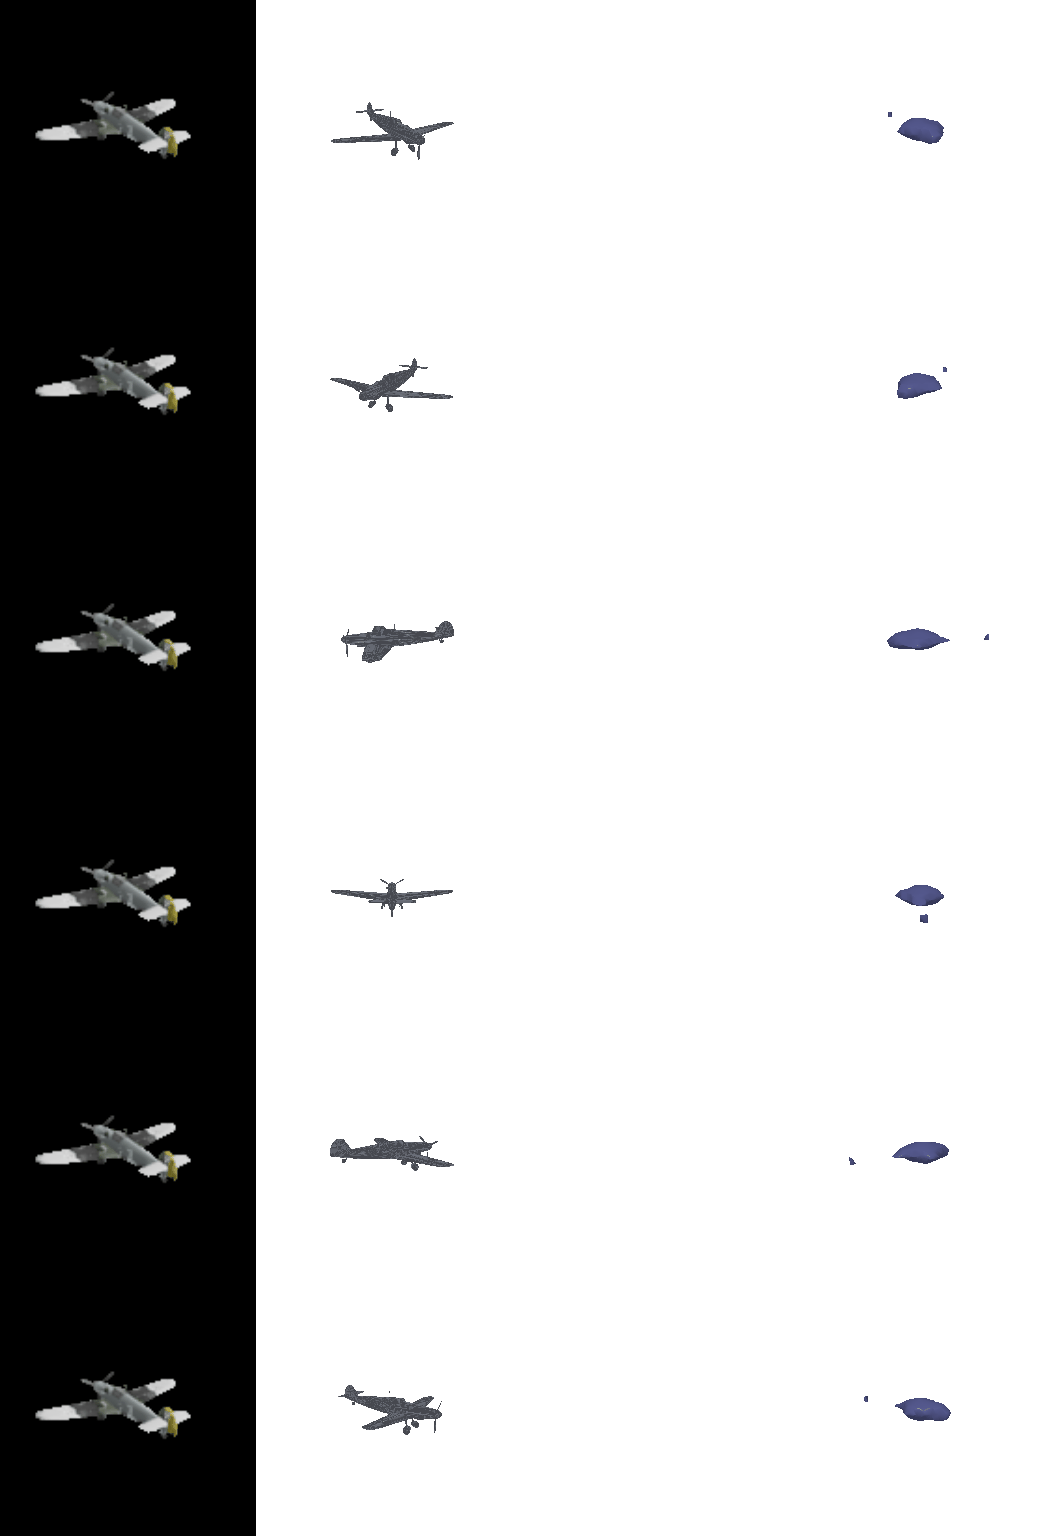
Left to right: input, ground truth, 1-class prediction, 3-class prediction. Three test chairs, then a car and a plane.
Same chairs: one class vs three
On the same 678 chairs the 3-class model scores 61.2 against 70.6 (-9.3), winning on only 34% of them. Precision barely moves (72.8 vs 71.4) while recall falls (71.2 → 58.7): it does not turn chairs into cars, it commits to less of the chair. Two causes — the same budget of batches now covers 12,886 objects instead of 6,100, so each chair is seen about half as often; and one decoder spanning three shape families produces lower occupancy probabilities on ambiguous chairs, pushing thin parts under the 0.5 isovalue.
Consistency and diversity
Mean IoU between every pair of predicted test chairs: 0.141 (1-class), 0.119 (3-class), 0.118 (ground truth). The 1-class outputs resemble each other more than real chairs do — it falls back on a typical complete chair when the image is ambiguous, giving consistent shapes with less variety than the data. The 3-class spread matches the ground truth, but the renders show this is not better variety: incomplete shapes simply overlap less.
What the extra classes bought
Planes go from 18.6 to 85.7, close to the 90.5 ceiling; for the plane shown, the 1-class model's 0.5 isosurface is empty. Cars go from 28.6 to 30.4, which needs the figure below to read.

The ground-truth car voxels are not a solid car but a comb of separate slices, while the chair grids match their meshes. Scored against the real car surface the car labels only reach 46.8, and the 3-class model learned to reproduce the slices, so its car score measures the labels more than the model. Training on three classes bought planes, could not buy cars with these labels, and cost 9.3 points of chair F1.