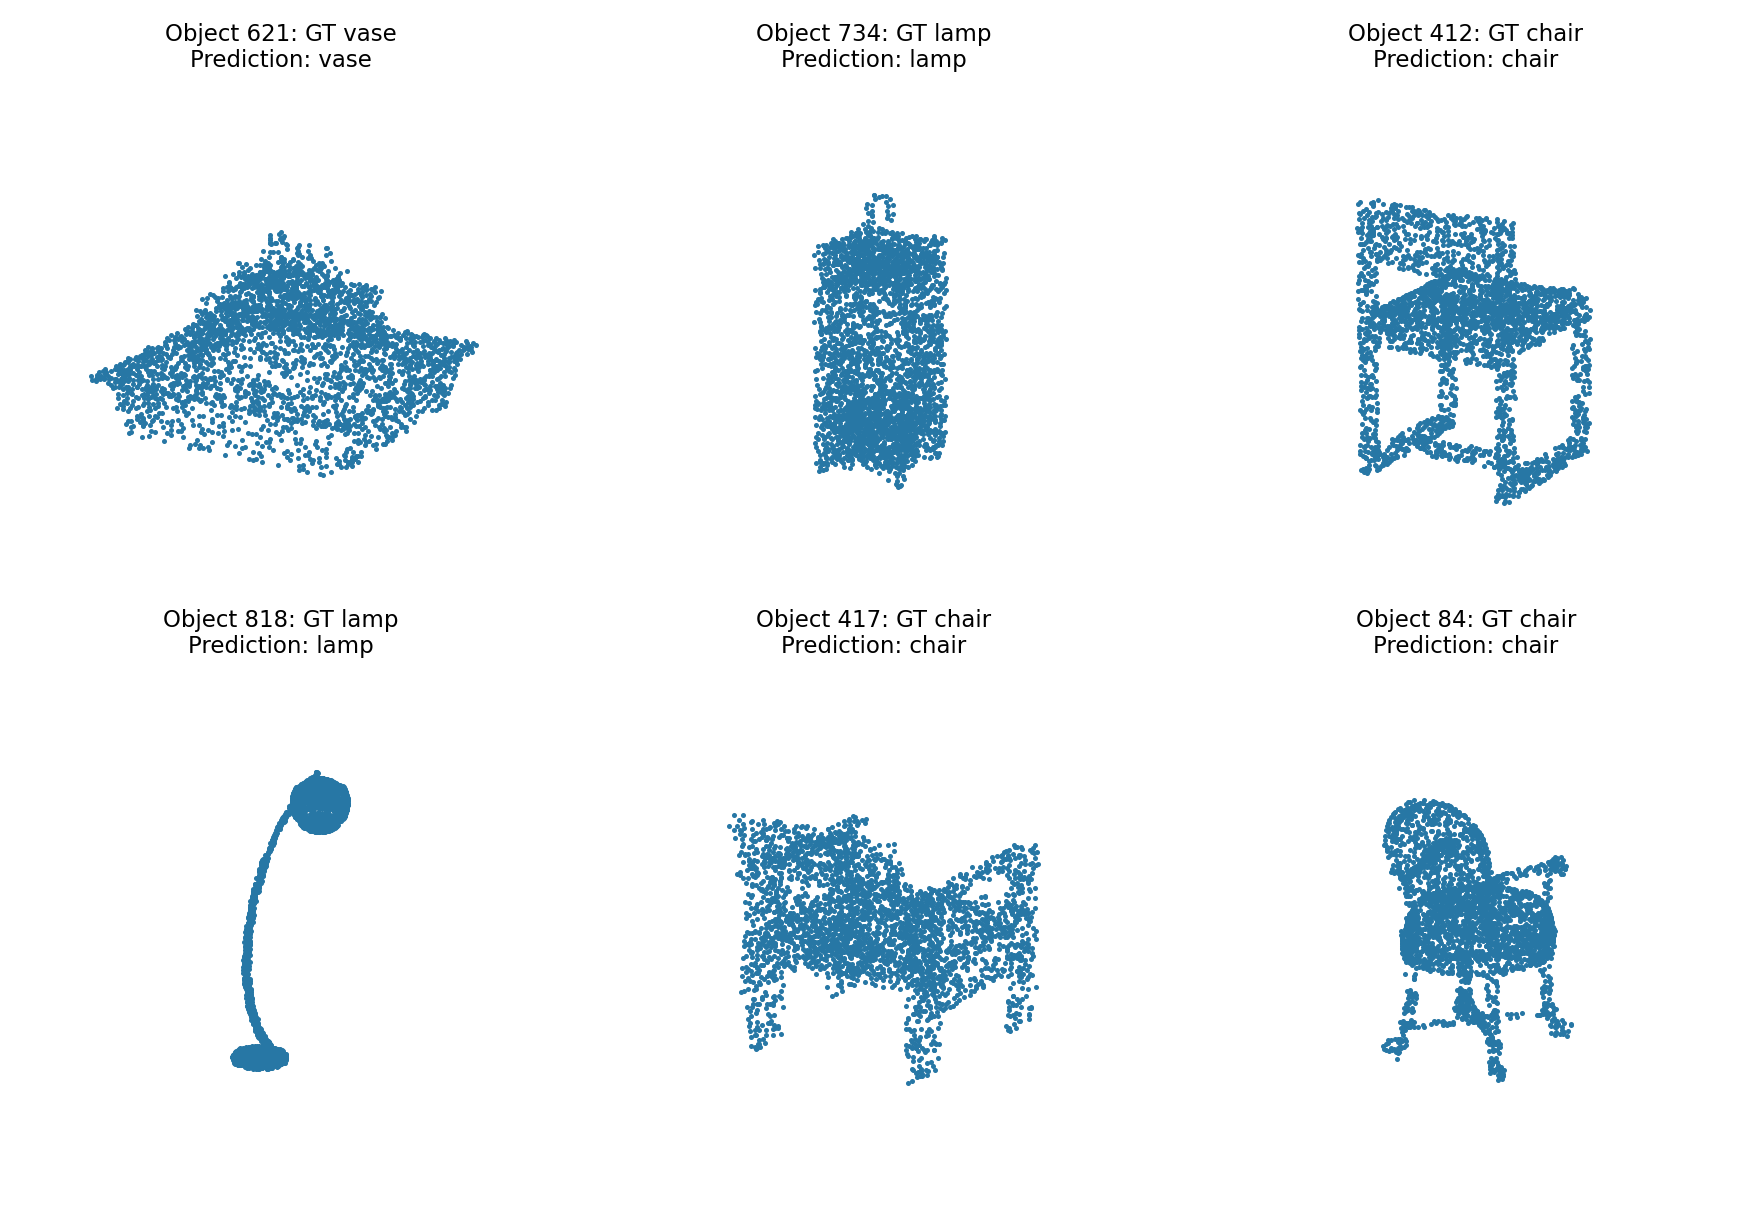
Test accuracy: 97.17% over all 953 test objects, using all 10,000 points per object. Static displays show up to 3,000 points for clarity.
Six random test objects, selected with seed 42. Each panel gives the ground-truth and predicted class.
One failure for each ground-truth class: chair, vase, and lamp.
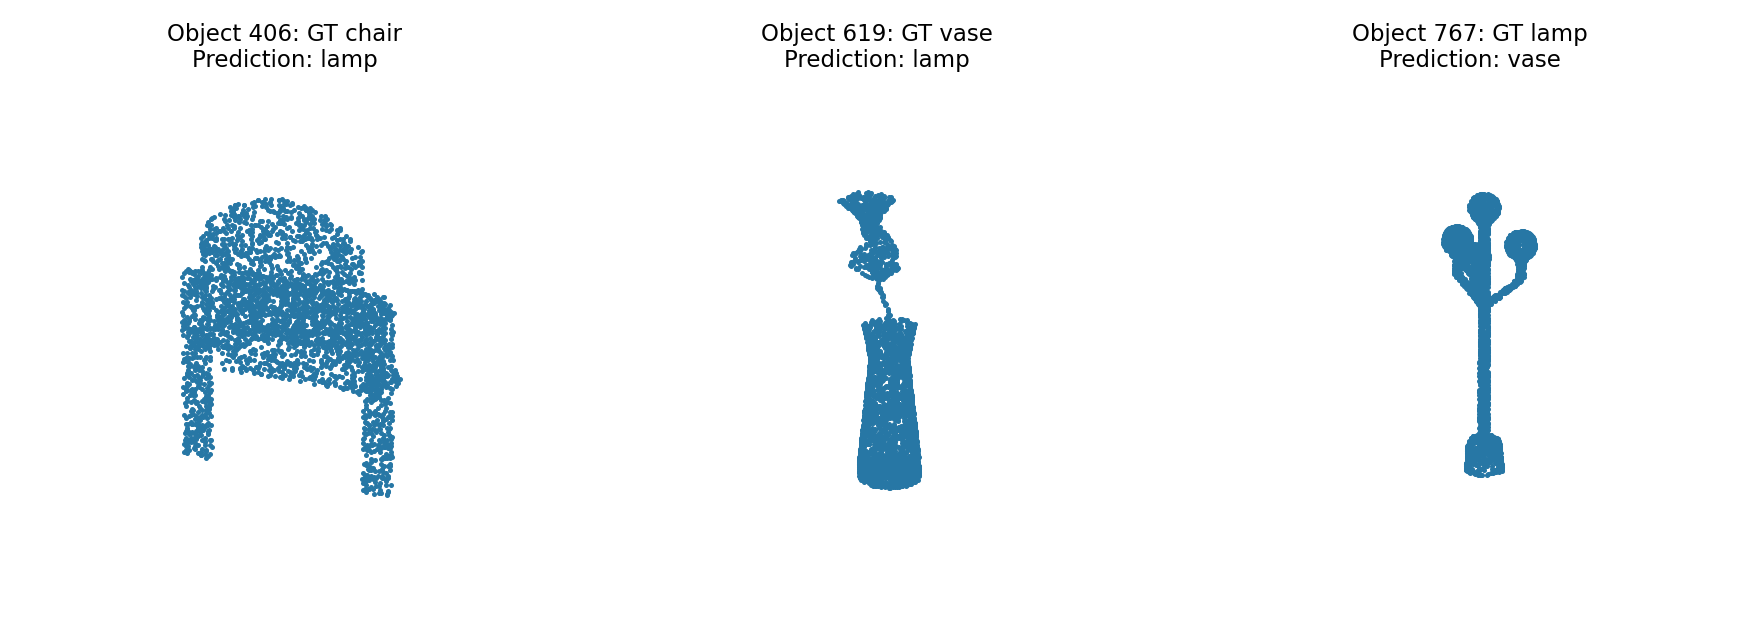
Chair 406 is predicted as a lamp despite its recognizable back, seat, and legs. Its rounded upper surface and thin supports may activate features shared with lamps; global max pooling does not explicitly preserve the arrangement of those parts. Vase 619 has a narrow stem and a broad base with an ornamental top, resembling a standing lamp. Lamp 767 has rounded tips and a branching stem rather than a conventional lampshade, which may resemble a decorative vase. These shape similarities are possible explanations for the failures.
Test point accuracy: 90.06% over all 617 chairs and 6,170,000 points. Accuracy is the fraction of correctly labeled points.
Five test chairs are shown below, including the two lowest-accuracy predictions. Colors identify the six part labels consistently between ground truth and prediction. The static figures display up to 3,000 points; all accuracies use all 10,000 points.
Best example: object 297, point accuracy 99.70%. Left: ground truth. Right: prediction.
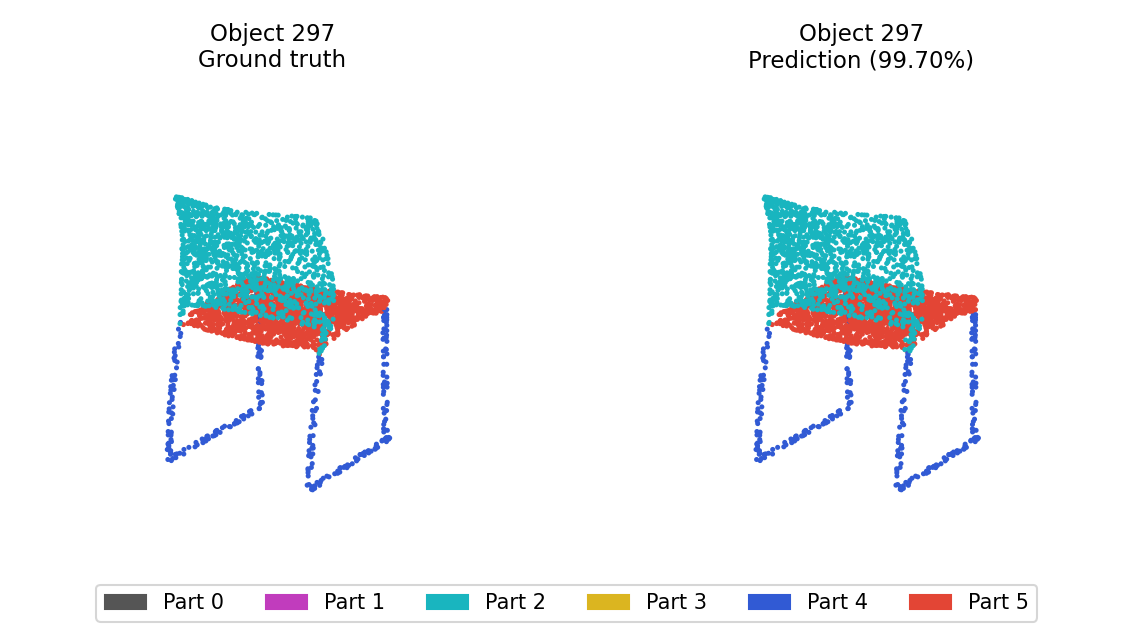
The back, seat, and thin leg frame are almost entirely correct. The simple separation between these parts fits the learned point features well.
Median example: object 123, point accuracy 92.92%. Left: ground truth. Right: prediction.
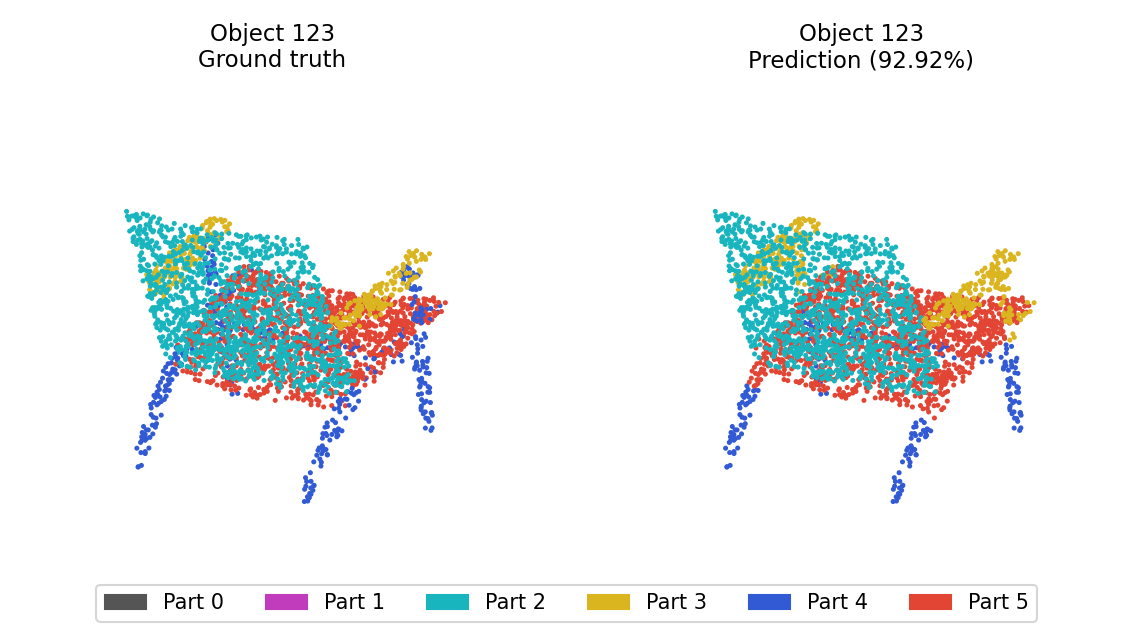
The model recovers the main back, seat, and legs of this armchair. Errors remain around the narrow arms and where their supports meet the seat, where adjacent parts are close together.
Lower-quartile example: object 72, point accuracy 86.65%. Left: ground truth. Right: prediction.
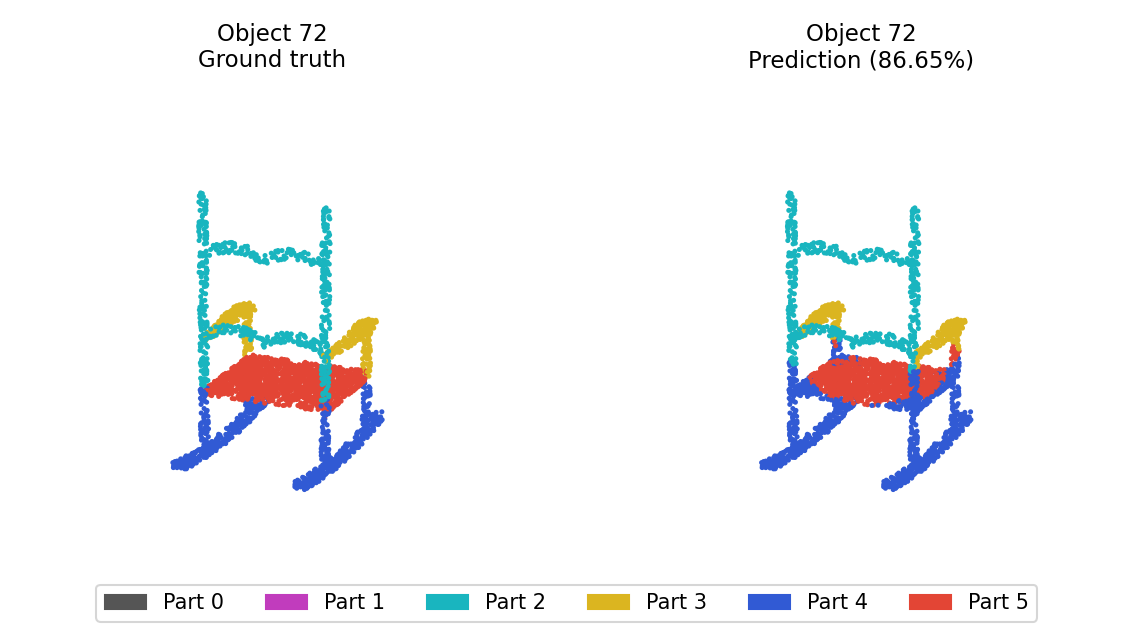
The curved blue rockers, red seat, and most of the cyan back are preserved. Some arm-support and seat-edge points become blue leg points, accounting for the lower accuracy despite a plausible overall shape.
Bad prediction 1: object 351, point accuracy 44.21%. Left: ground truth. Right: prediction.
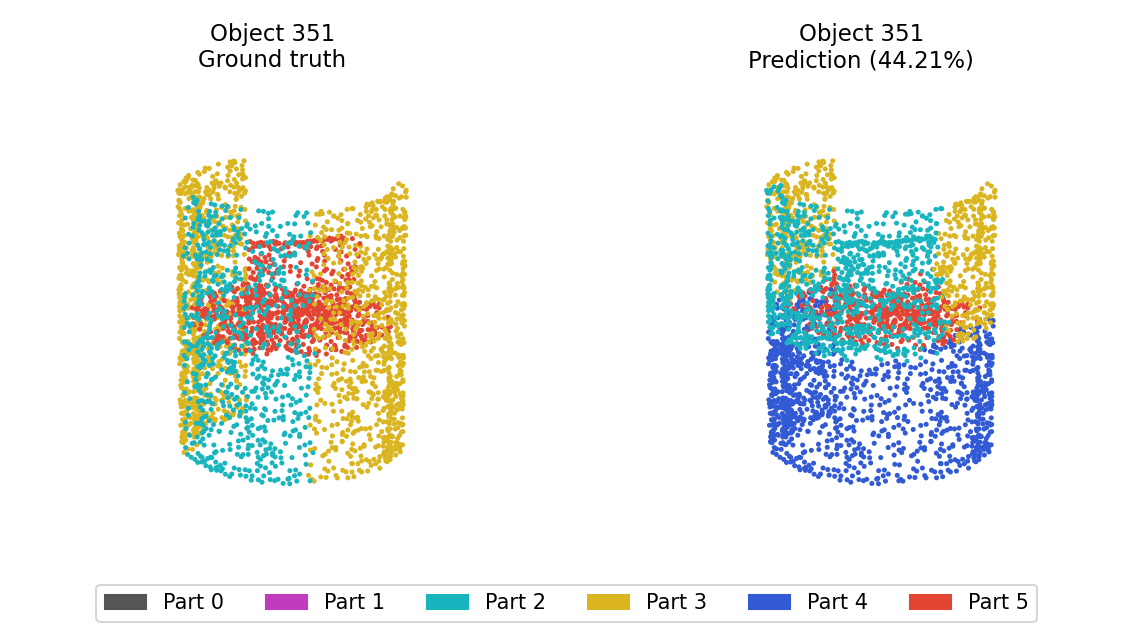
This chair has a continuous curved shell rather than ordinary separated legs. Much of the lower shell, labeled cyan or yellow in GT, is incorrectly assigned the blue leg label; the error covers whole regions rather than only boundaries.
Bad prediction 2: object 238, point accuracy 47.32%. Left: ground truth. Right: prediction.
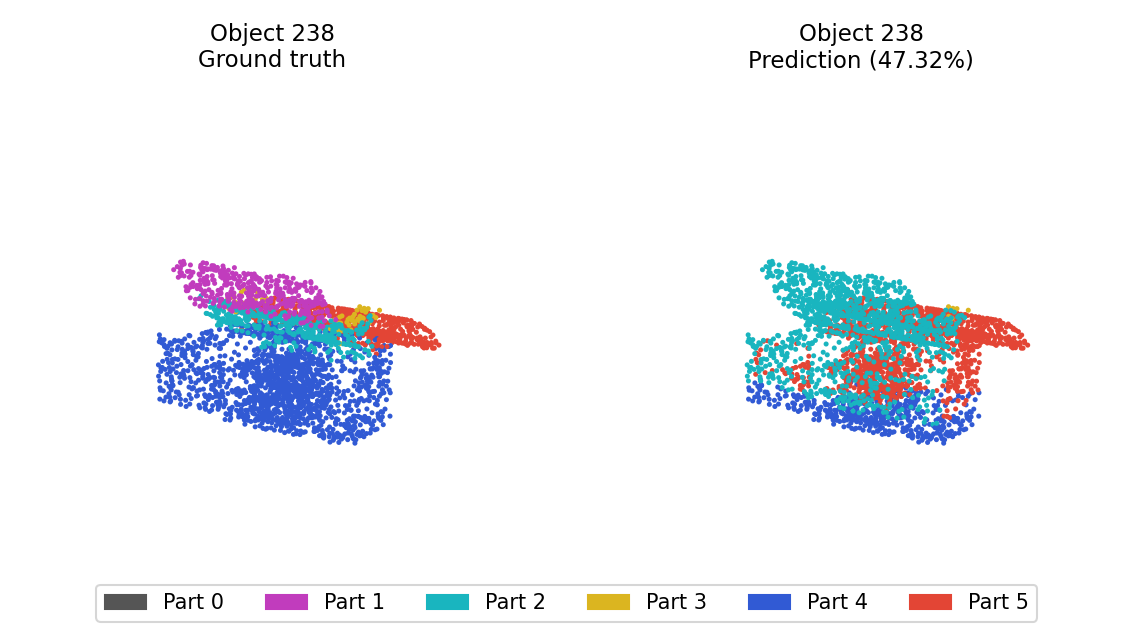
The reclined upper section has a purple GT label, but the model mostly replaces it with cyan. Large parts of the broad blue base also become red, showing confusion between the unusual support geometry and the seat.
Both experiments use the same saved classification and segmentation checkpoints as Q1 and Q2, without retraining. Each model trained for 100 epochs with batch size 32, Adam at learning rate 0.001 (halved every 30 epochs), and 2,048 randomly sampled points per object. Seed 42 was used; no rotation augmentation or transform blocks were used. The best checkpoint follows the starter trainer’s test-accuracy selection rule.
Rotate every test object about the dataset Z axis through its centered origin. Keep all 10,000 points and their labels, and evaluate every test object at each angle. This axis tilts the upright Y direction. The 0-degree row reproduces Q1 and Q2.
| Rotation (degrees) | Classification accuracy | Segmentation point accuracy |
|---|---|---|
| 0 | 97.17% | 90.06% |
| 15 | 92.44% | 81.10% |
| 30 | 79.85% | 66.10% |
| 60 | 27.81% | 55.51% |
| 90 | 22.56% | 47.22% |
| 180 | 51.63% | 37.83% |
The first three random Q1 examples after a 90-degree rotation, with ground-truth and predicted classes. Compare with their upright versions in Q1.
Two Q2 chairs after a 90-degree rotation. Columns: ground truth, original-model labels moved with the points, and predictions from the rotated input. The middle column preserves Q2 labels to make the rotation effect visible.
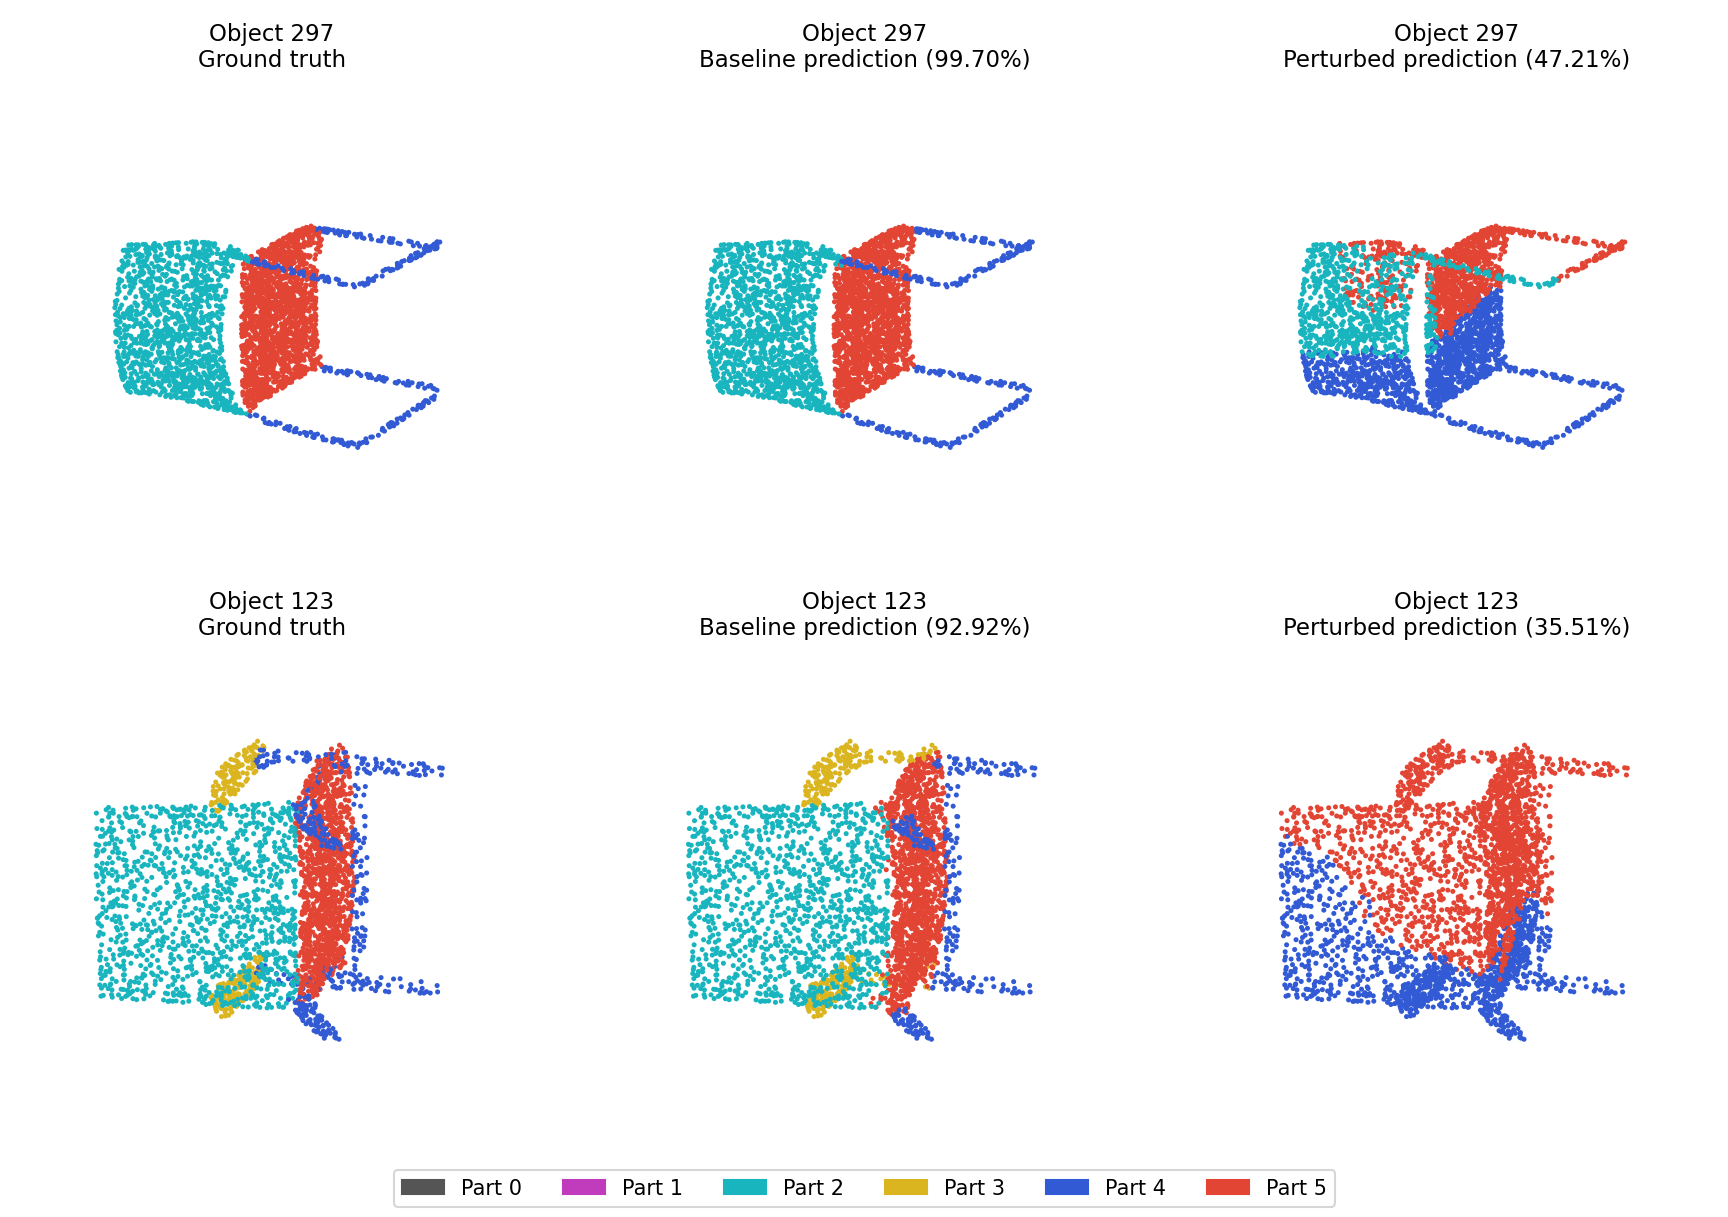
At 90 degrees, classification accuracy changes from 97.17% to 22.56%, and segmentation accuracy changes from 90.06% to 47.22%. Max pooling makes the models invariant to point order, but does not make coordinate features rotation invariant. Tilting moves the back, seat, and legs away from their familiar coordinate ranges. All three displayed classification examples change to incorrect classes. In chair 123, much of the back becomes seat or leg labels after rotation; training with rotations or adding transform blocks could address this weakness, but neither is used here.
Create one seed-42 permutation of the 10,000 point indices and use its first N entries for every test object. The subsets are nested across point counts; segmentation labels are sampled at the same indices as the coordinates. Evaluate all 953 classification objects and all 617 segmentation objects. Segmentation accuracy is measured over the retained points. The 10,000-point row is the Q1/Q2 baseline.
| Points per object | Classification accuracy | Segmentation point accuracy |
|---|---|---|
| 10000 | 97.17% | 90.06% |
| 2048 | 97.06% | 90.06% |
| 1024 | 97.06% | 89.85% |
| 256 | 95.59% | 87.10% |
| 64 | 94.33% | 78.00% |
| 16 | 74.82% | 61.40% |
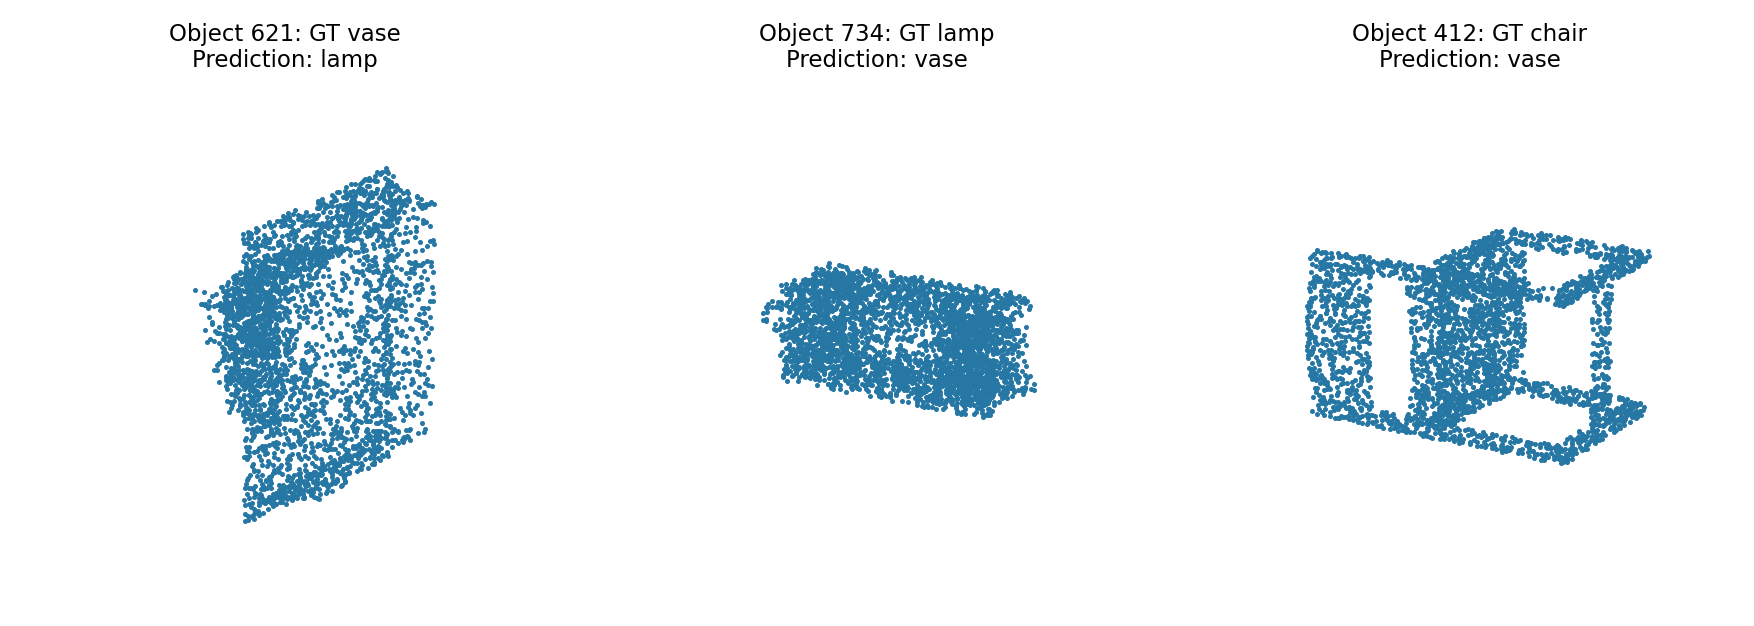
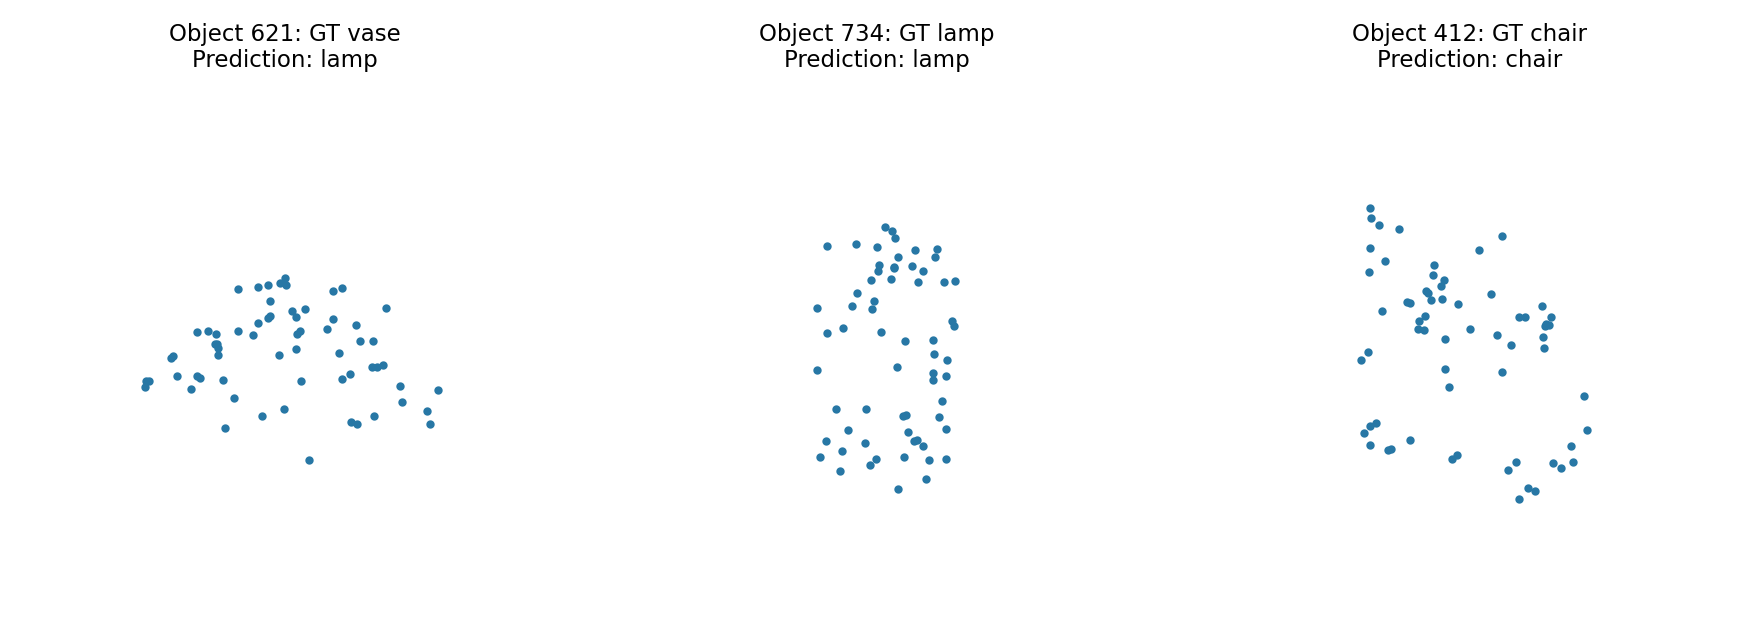
The same three classification examples with only 64 input points. Compare with the dense point clouds and predictions in Q1.
The same two Q2 chairs with 64 points. Columns: ground truth, predictions from the full input restricted to these points, and predictions using only these 64 points. Percentages compare labels on the same retained points.
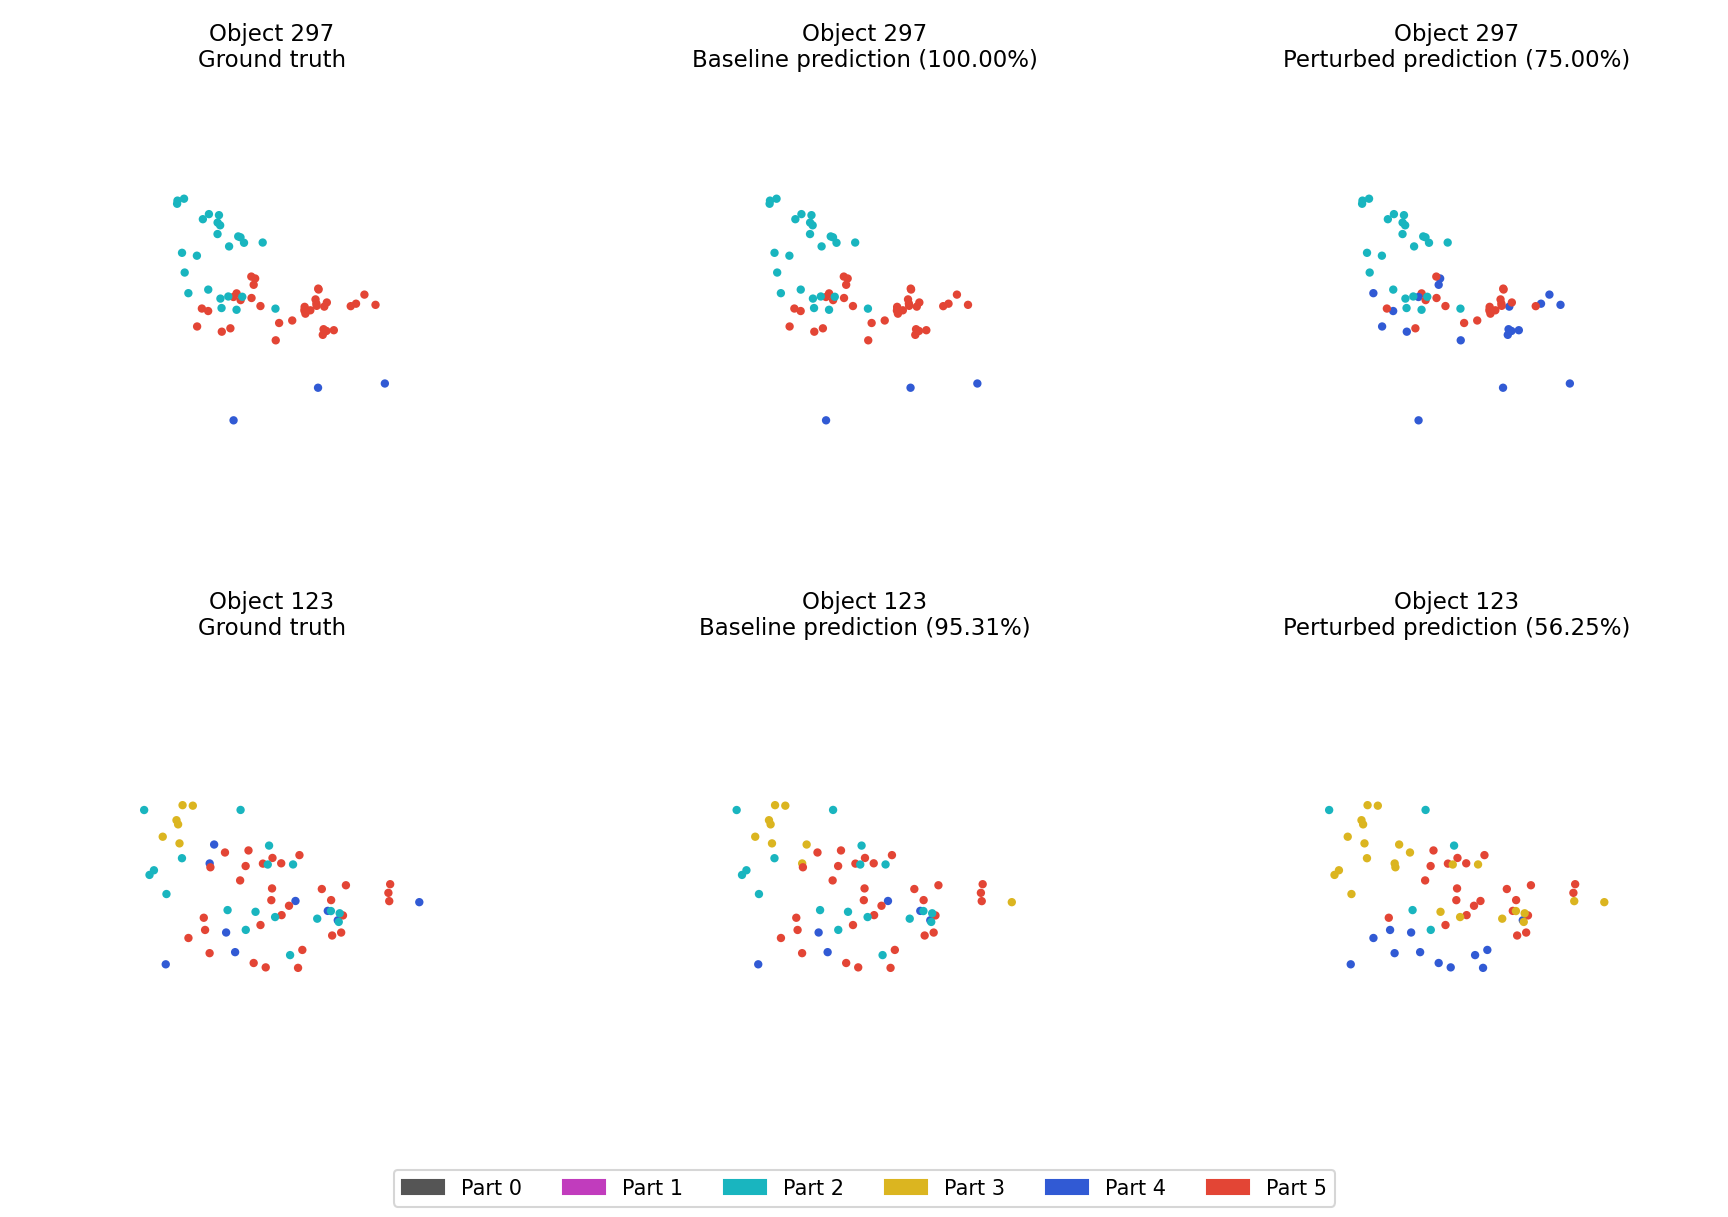
At 64 points, classification accuracy is 94.33% and segmentation accuracy is 78.00%; at 16 points they are 74.82% and 61.40%. Vase 621 changes to a lamp prediction at 64 points, while the displayed lamp and chair remain correct. Chair 297 loses seat points to the blue leg label, and chair 123 confuses several arm and back points. Sparse inputs can miss narrow supports and other distinguishing parts. They also change the max-pooled global feature, so predictions can change even at points that remain in the input. Random point sampling during training provides some density variation, but these extreme subsets are much sparser than the 2,048 training points. The segmentation score also changes its evaluated point set, so individual small fluctuations are not matched-point gains. Only one fixed sampling seed is tested.