Classification Model
1.1 Test Accuracy
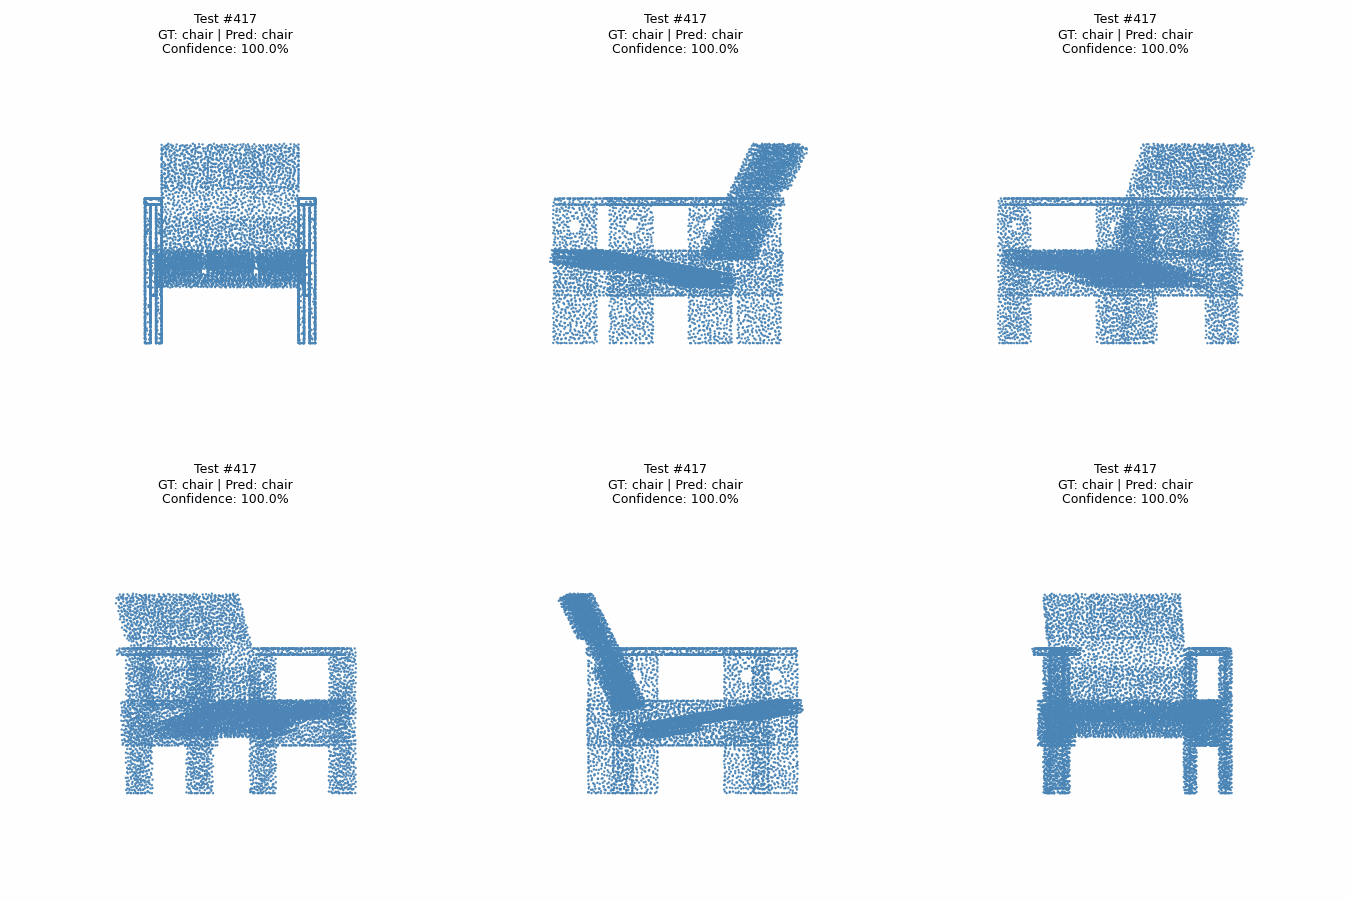
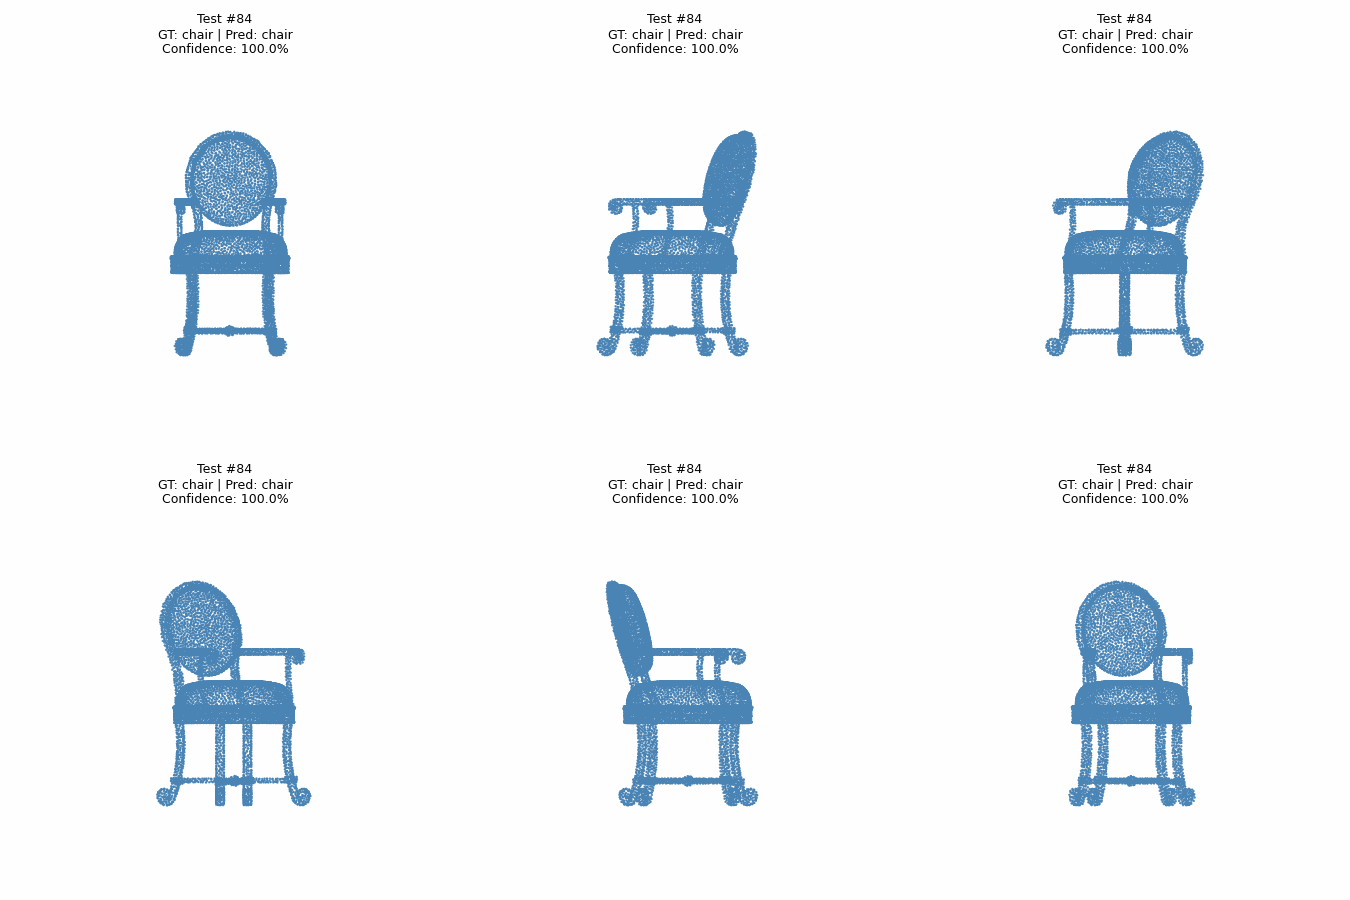
Test accuracy: 98.11% (935 / 953 objects), using 10,000 points per object and the best classification checkpoint.
1.2 Random Test Point Clouds
Six randomly selected test objects are shown below.
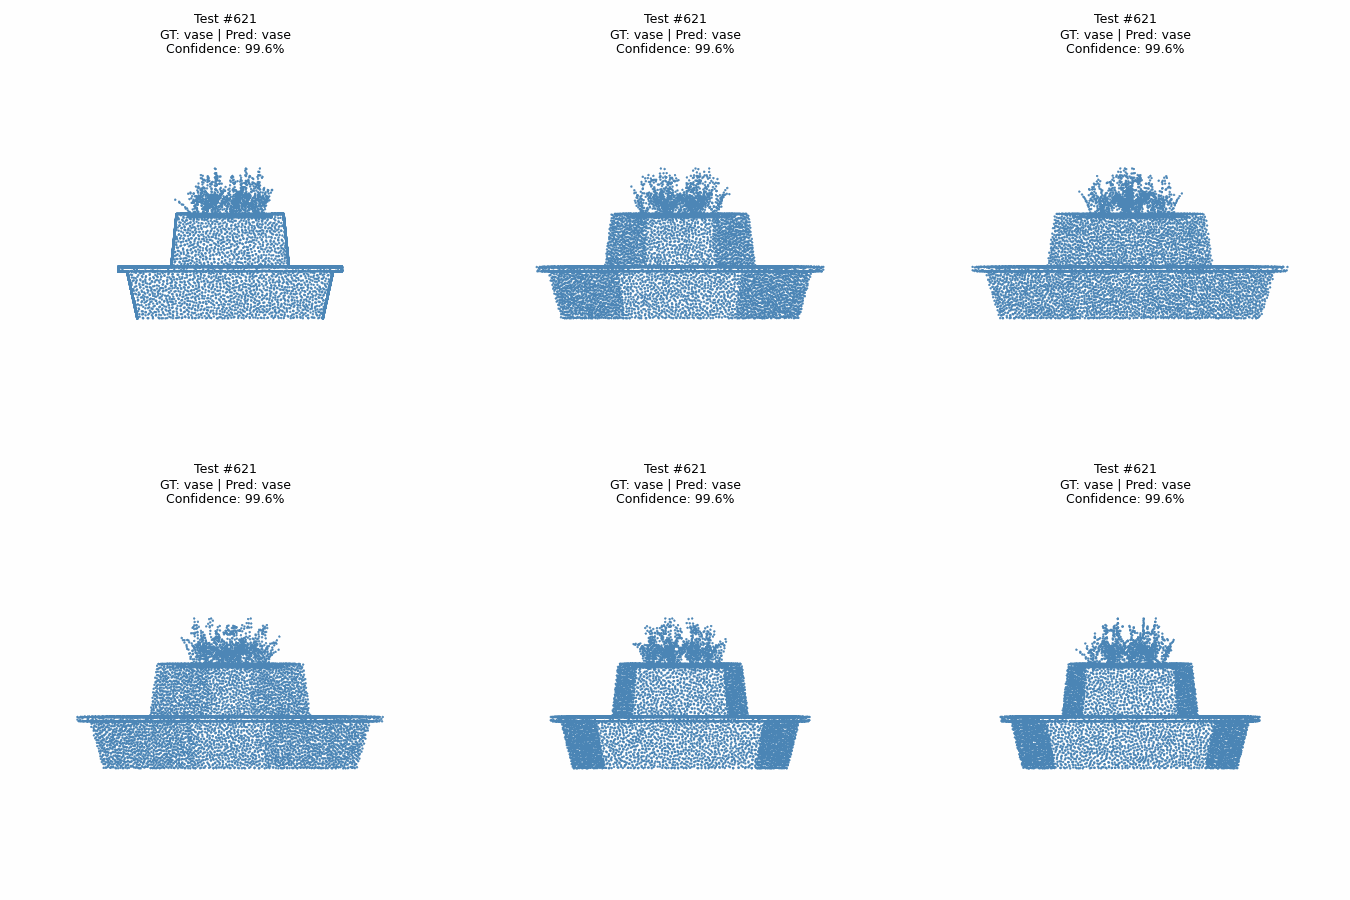
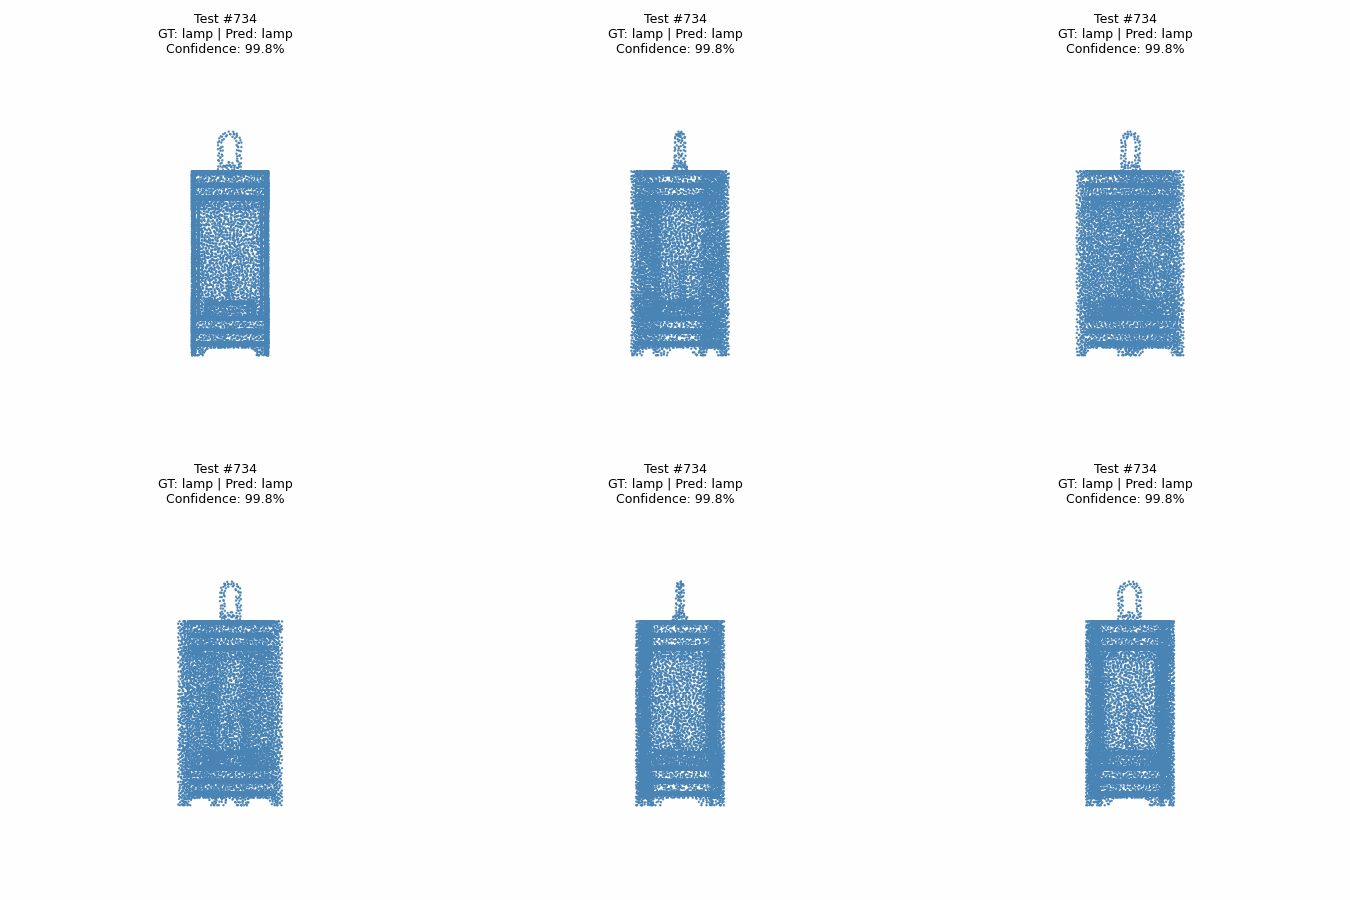
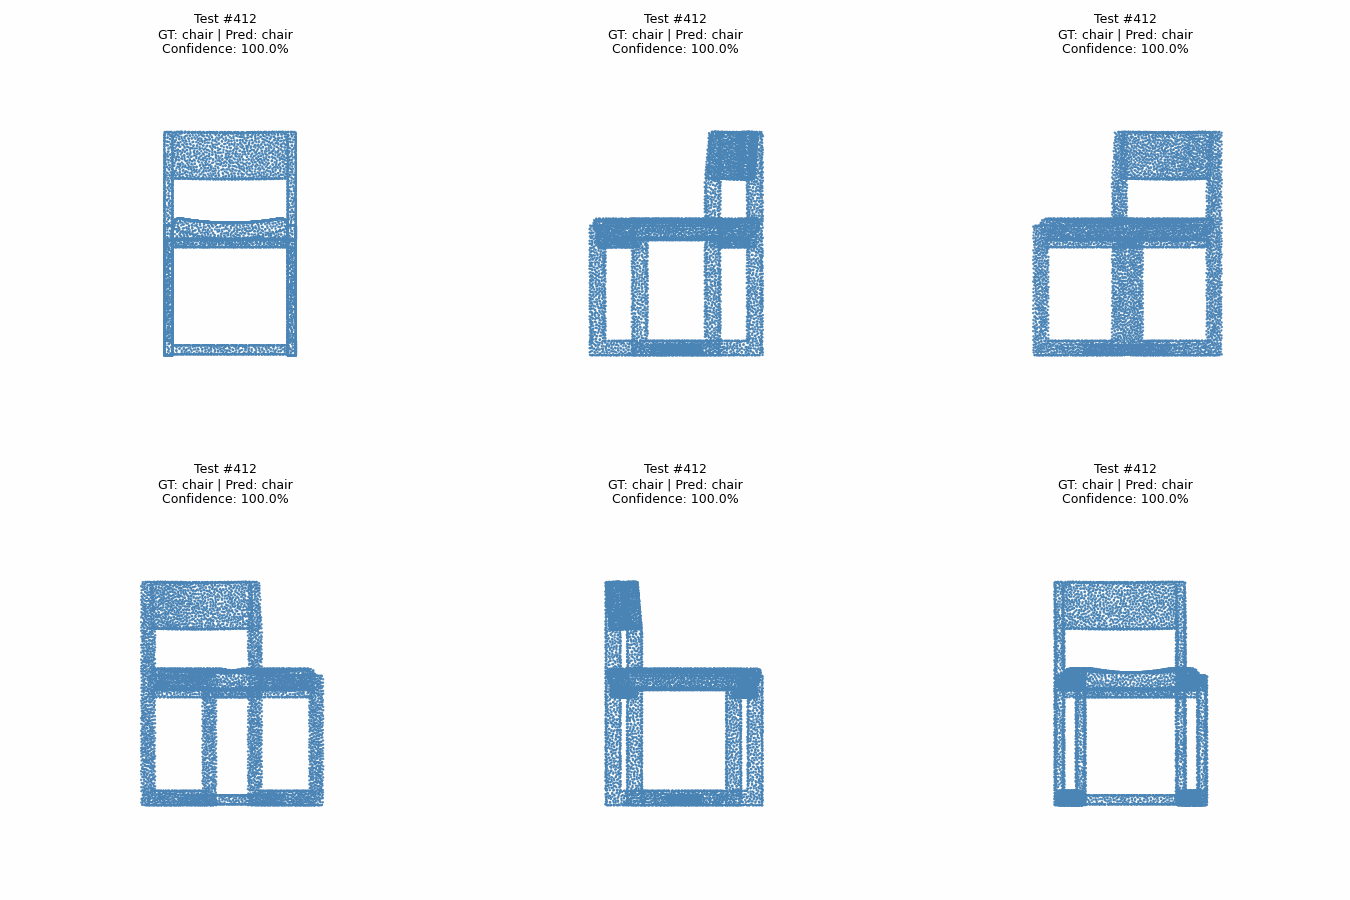
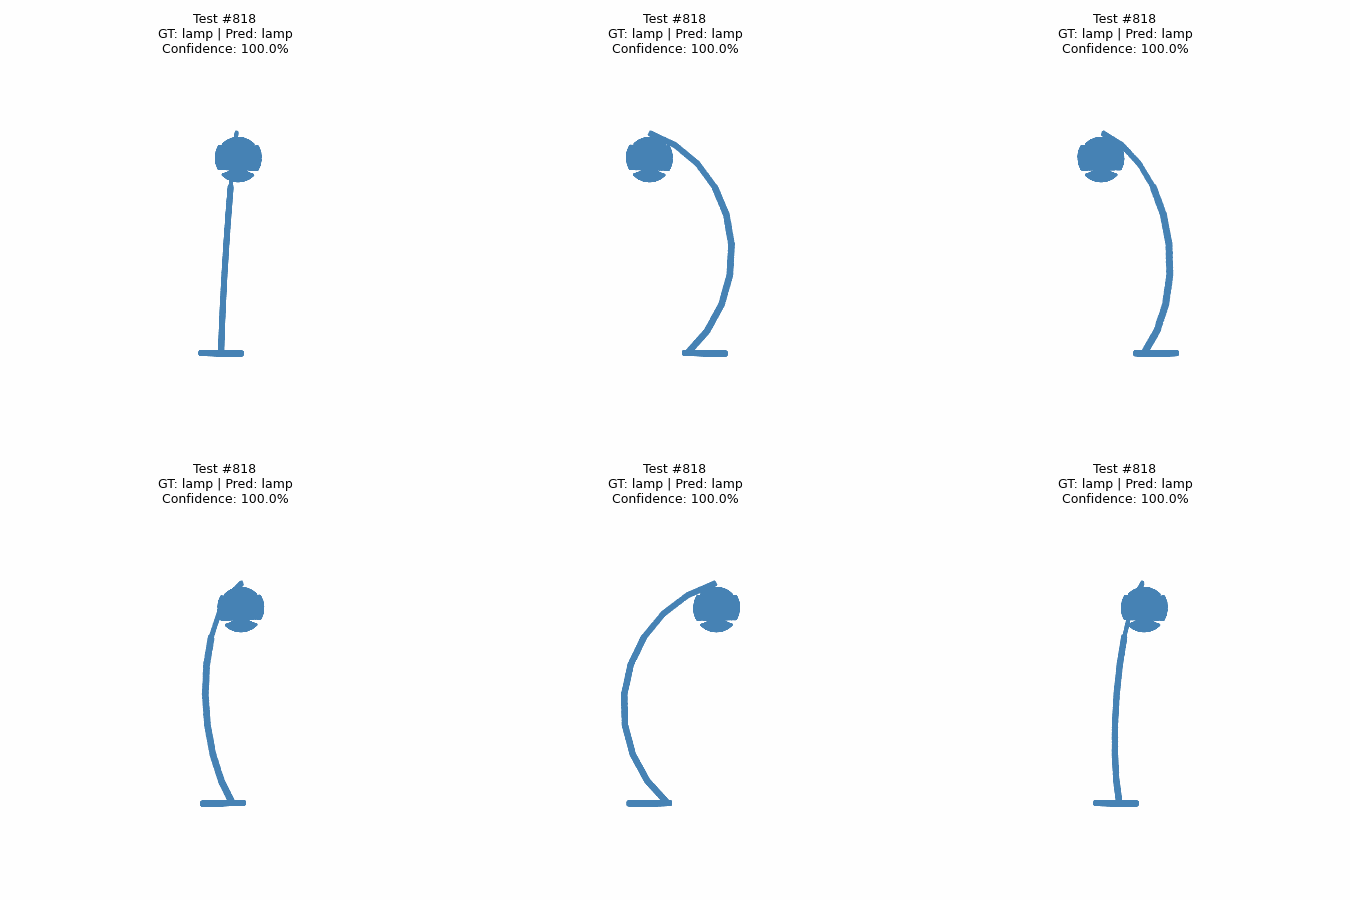
1.3 Failure Predictions
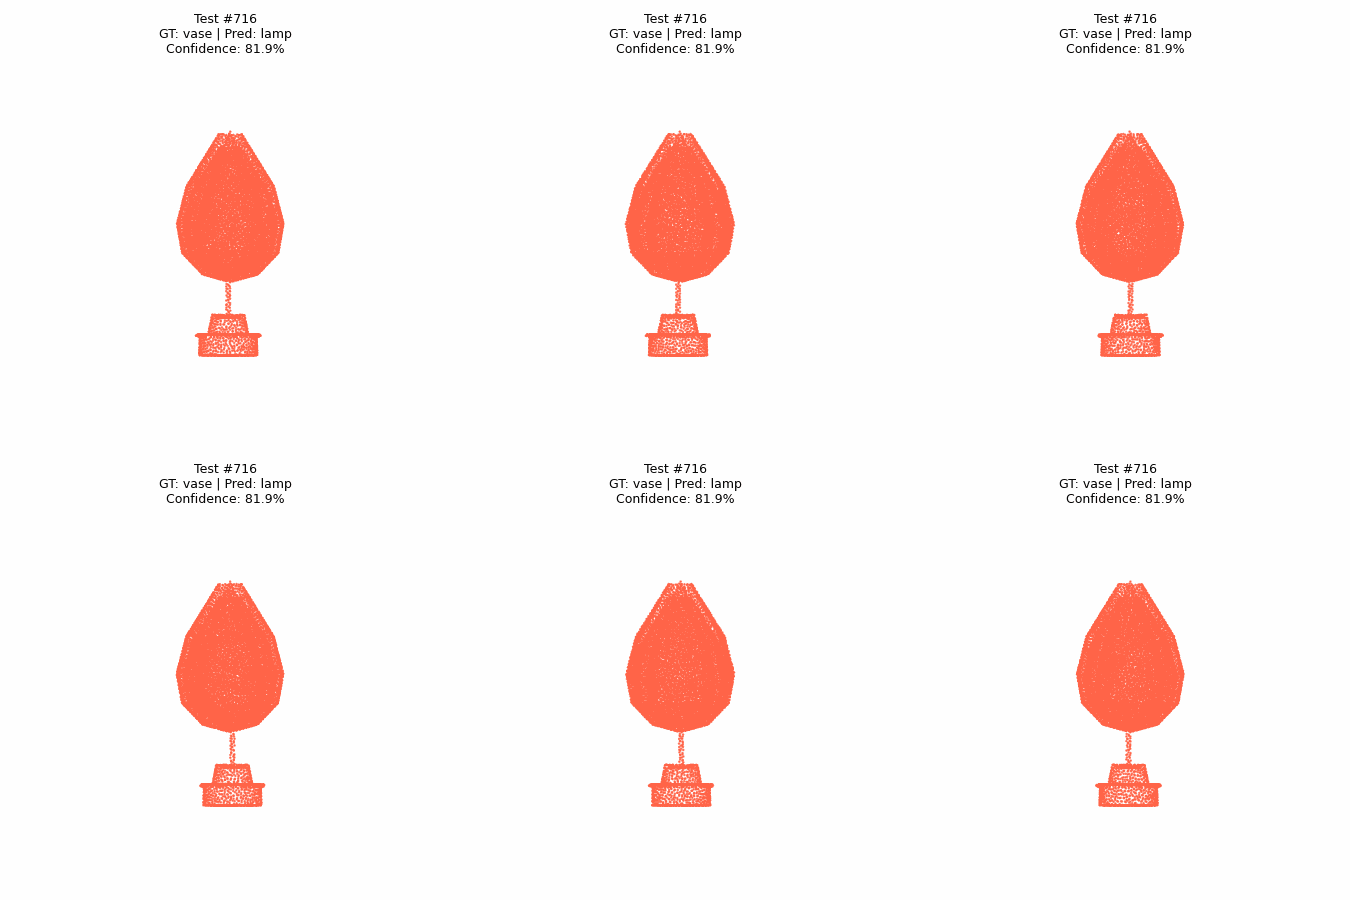
Vase → lamp, test #716: This vase has a large tapered body above a narrow stem and a stepped base, giving it a silhouette similar to a table lamp. The visible geometry provides no clear cue about whether the upper body is a container or a lampshade. This shape ambiguity may explain the incorrect lamp prediction.
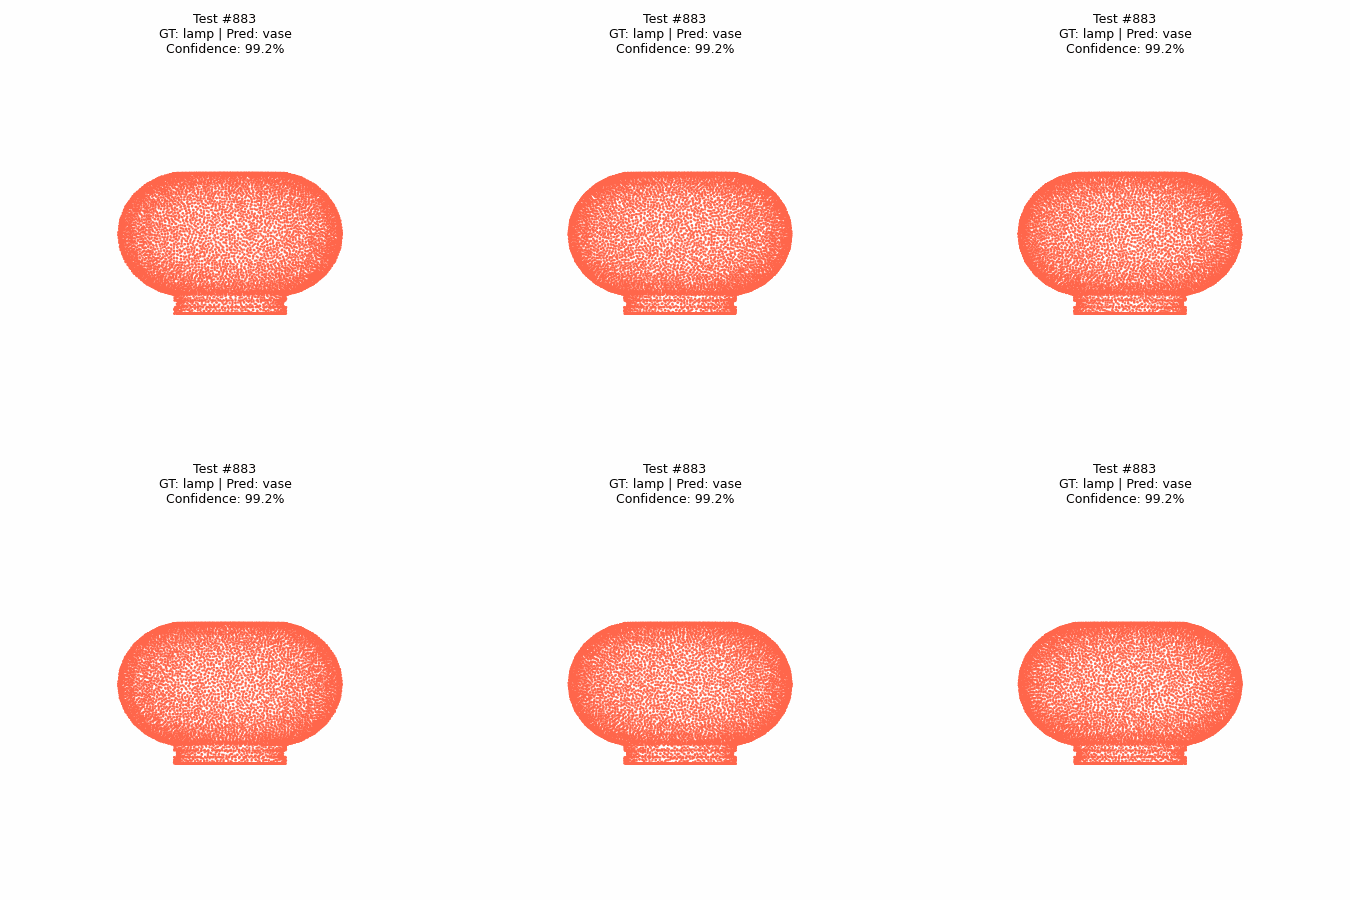
Lamp → vase, test #883: This lamp has a broad, rounded body on a short base, without an obvious long stem or separate shade. Its compact, vessel-like shape resembles a vase, which may explain the confusion. The model assigns 99.2% confidence to the wrong class, showing that high confidence does not guarantee a correct prediction on an ambiguous shape.
Chair: All 617 chair test objects are classified correctly, so the unmodified test set contains no chair failure to visualize.
Segmentation Model
2.1 Test Accuracy
Test point accuracy: 89.85%, evaluated on all 617 test chairs with 10,000 points per object.
2.2 Three Best Predictions
The three highest-accuracy objects are shown below. Ground truth is on the left and prediction on the right, using the same camera sequence and class-color mapping.
Test #471 — Accuracy: 99.71%


Test #562 — Accuracy: 99.40%


Test #569 — Accuracy: 99.37%


2.3 Two Worst Predictions
The two lowest-accuracy objects illustrate substantial segmentation failures. Their results are compared with the corresponding ground truth using the same views.
Test #255 — Accuracy: 39.36%


Test #351 — Accuracy: 44.55%


Interpretation: The successful cases (#471, #562, and #569) have clearly separated backs, seats, and legs, and their predicted labels closely match the ground truth, with accuracies above 99%. In contrast, the compact, box-like chair #255 and rounded chair #351 have continuous surfaces and less distinct part boundaries, leading to substantial confusion between semantic regions. For example, much of the lower blue region in #255 is predicted as red, while #351 is divided into broad upper and lower regions that do not match the ground truth. These results suggest that the model handles conventional chair structures well but struggles with unusual shapes whose parts blend together.
Robustness Analysis
3.1 Experiment 1: Input Rotation
Classification
Procedure: I rotate each test point cloud by 30°, 60°, or 90° about the Y axis through its own centroid, retaining all 10,000 points. I evaluate the same trained classification model on all 953 test objects without retraining. The unrotated input is the Q1 baseline. Each static image places the original input on the left and the actual rotated input on the right, with the same fixed front camera and scale. The right point cloud retains its 30°, 60°, or 90° input rotation.
0° — Q1 baseline:
Test accuracy: 98.11%
30° rotation:
Test accuracy: 74.19% (23.92 percentage points drop)
60° rotation:
Test accuracy: 61.91% (36.20 percentage points drop)
90° rotation:
Test accuracy: 63.27% (34.84 percentage points drop)
30° rotation


60° rotation


90° rotation


Interpretation: Accuracy falls from 98.11% to 74.19%, 61.91%, and 63.27% at 30°, 60°, and 90°, respectively. PointNet's shared pointwise features and max pooling provide invariance to point ordering, but do not inherently provide invariance to 3D rotation. These results show strong sensitivity to object orientation; the decrease is not strictly monotonic, since 90° performs slightly better than 60°.
Sample comparison: All nine displayed rotation comparisons are baseline-correct objects that become incorrect. Chair #0 changes from chair to vase at all three angles; the object retains its chair structure, while only its orientation changes. At the dataset level, chair accuracy falls from 100% to 46.35% at 60°, while vase and lamp accuracies remain 90.20% and 90.60%, respectively, so chairs account for much of the overall degradation. One possible reason is that a chair’s appearance changes substantially across viewing angles. In particular, side or rear views may obscure its characteristic features, leading to misclassification.
Segmentation
Procedure: I evaluate the Q2 segmentation checkpoint on all 617 test chairs after rotating each point cloud by 30°, 60°, or 90° about the Y axis through its centroid. For each angle, I choose three objects with baseline accuracy at least 90% that exhibit large accuracy drops.
0° — Q2 baseline:
Test point accuracy: 89.85%
30° rotation:
Test point accuracy: 76.31% (13.54 percentage points drop)
60° rotation:
Test point accuracy: 67.81% (22.05 percentage points drop)
90° rotation:
Test point accuracy: 62.47% (27.38 percentage points drop)
30° rotation — segmentation


60° rotation — segmentation


90° rotation — segmentation


Interpretation: Test point accuracy decreases from 89.85% to 76.31%, 67.81%, and 62.47% as the rotation angle increases. For these settings, both classification and segmentation are sensitive to orientation. Shared pointwise features and max pooling do not make PointNet inherently invariant to spatial rotation, so changing coordinates can alter the predicted part labels even though the object geometry is preserved.
Sample comparison: Test #224 drops from 95.16% to 51.49% at 30°, with large regions no longer matching the ground-truth colors. At 90°, Test #169 drops from 96.41% to 24.13%; much of its cyan back region is predicted as blue, despite the unchanged semantic structure. The errors extend beyond narrow part boundaries, indicating substantial part-label confusion.
3.2 Experiment 2: Number of Input Points
Classification
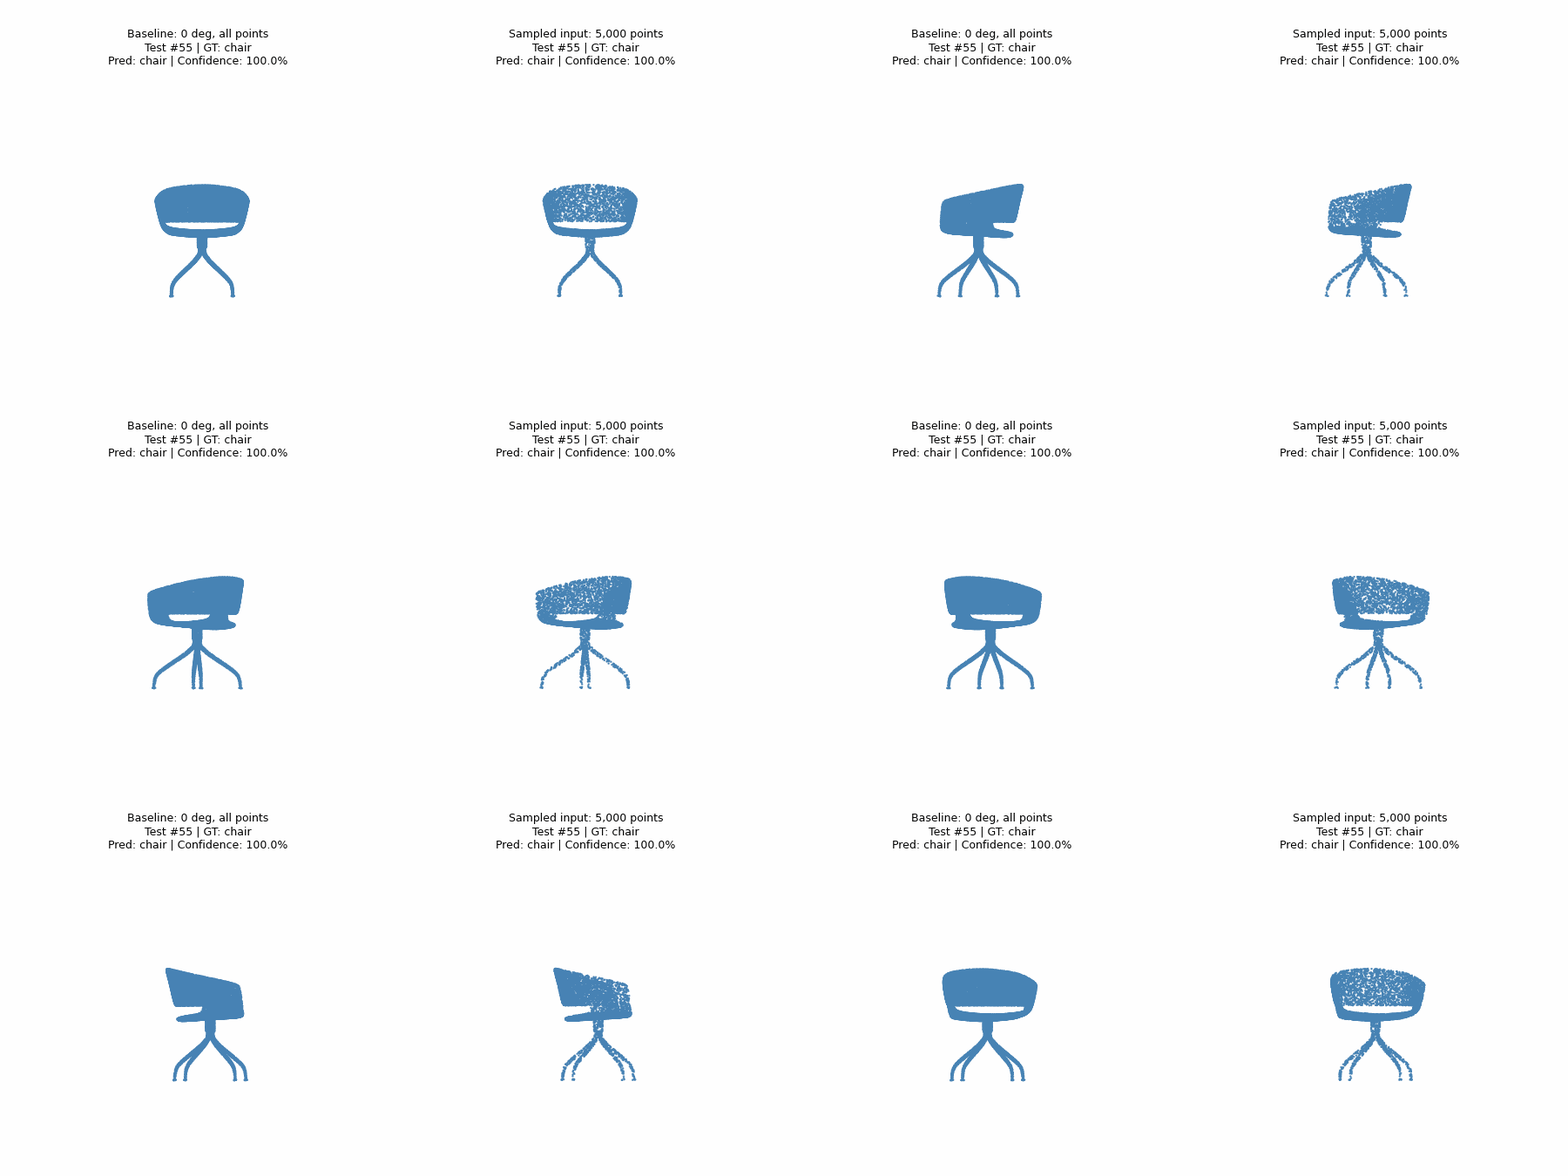
Procedure: I randomly sample 5,000, 1,000, or 500 points per test object without replacement, leaving the original orientation unchanged.
10,000 points — Q1 baseline:
Test accuracy: 98.11%
5,000 points:
Test accuracy: 98.01% (0.10 percentage points drop)
1,000 points:
Test accuracy: 97.80% (0.31 percentage points drop)
500 points:
Test accuracy: 97.27% (0.84 percentage points drop)
5,000 points


1,000 points


500 points


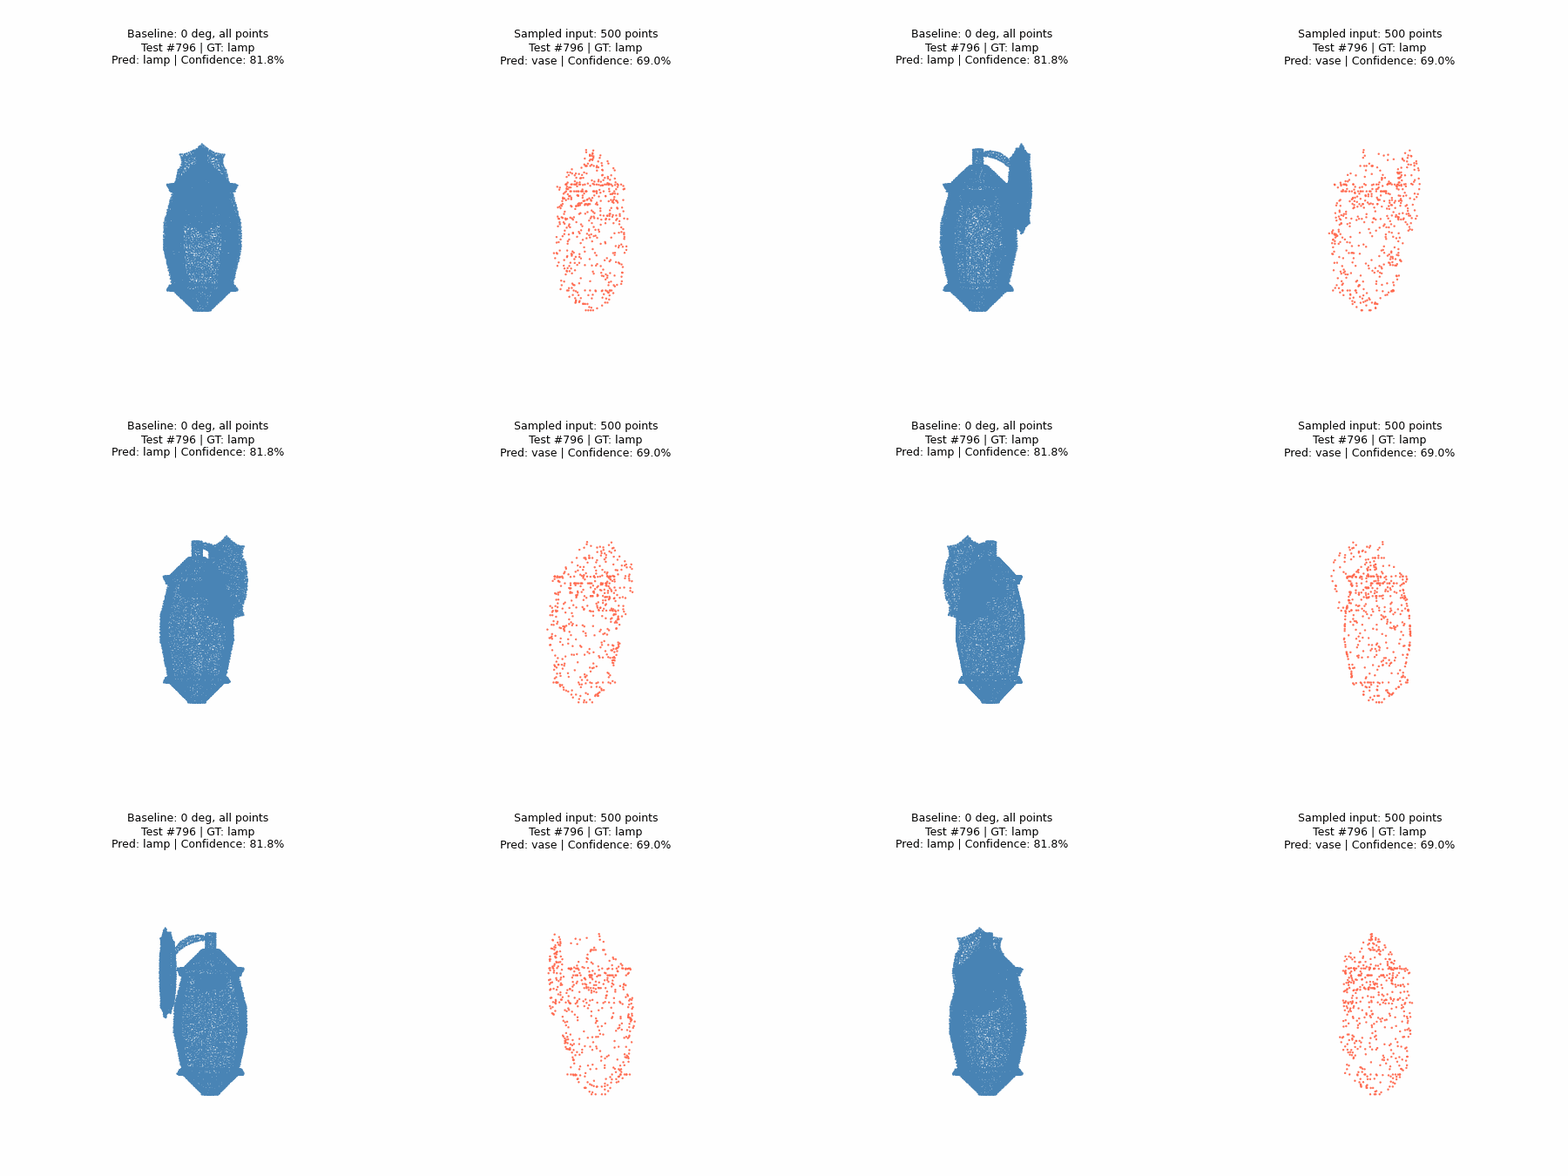
Interpretation: Accuracy is 98.01% with 5,000 points, 97.80% with 1,000 points, and 97.27% with 500 points. Even after removing 95% of the points, accuracy decreases by only 0.84 percentage points. For these tested settings, the classifier is much more robust to random point removal than to rotation. The remaining samples appear sufficient to preserve useful global shape evidence, although sparse sampling can miss small or distinctive structures.
Sample comparison: At 5,000 points, only one originally correct object becomes incorrect: vase #703 is predicted as a lamp. As the number of input points decreases, prediction accuracy declines slightly but remains high overall. This may be due to the model’s ability to extract global features: even with fewer points, it can still capture the object’s overall shape and maintain high classification accuracy. However, in examples such as Test #335 and Test #645, fine structures such as chair legs and flower stems become discontinuous or lose detail when the point cloud is sparse, which may impair classification performance.
Segmentation
Procedure: I evaluate the same Q2 model with 5,000, 1,000, or 500 randomly sampled points per chair.
Baseline on retained points: This measures the full-input model’s accuracy only on the points retained after subsampling.
10,000 points — Q2 baseline:
Test point accuracy: 89.85%
5,000 points:
Test point accuracy: 89.89% (0.04 percentage points improvement)
1,000 points:
Test point accuracy: 89.75% (0.10 percentage points drop)
500 points:
Test point accuracy: 89.02% (0.84 percentage points drop)
5,000 points — segmentation


1,000 points — segmentation


500 points — segmentation


Interpretation: Accuracy is 89.89%, 89.75%, and 89.02% at 5,000, 1,000, and 500 points, respectively. The small improvement at 5,000 points is only 0.04 percentage points, while removing 95% of the input points reduces overall accuracy by 0.84 percentage points. As the same in classification, the model is much more robust to random point removal than to the tested rotations.
Sample comparison: Individual objects can deteriorate much more than the dataset average suggests. For Test #576, baseline accuracy on the retained points is 94.30% at 1,000 points and 94.80% at 500 points, but sparse-input prediction reaches only 81.50% and 62.20%, respectively. Missing samples may weaken global context and evidence around small structures or part boundaries in certain cases.