Exploring Loss Functions
1.1 Fitting a Voxel Grid


1.2 Fitting a Point Cloud
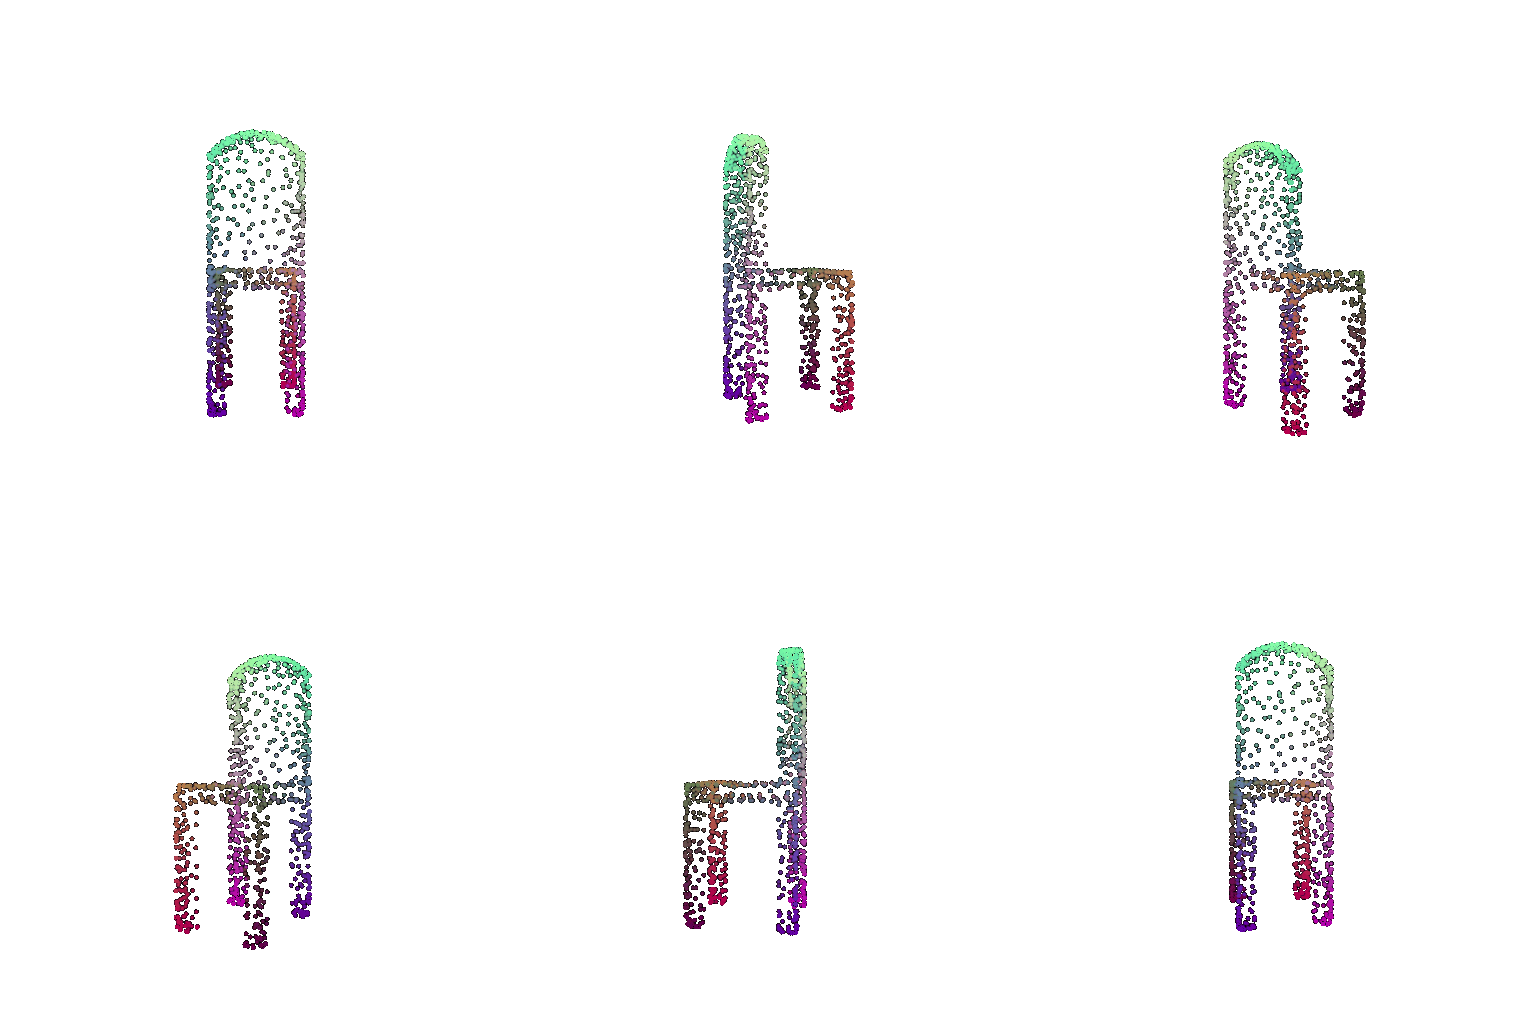

1.3 Fitting a Mesh


Reconstructing 3D from a Single View
2.1 Image to Voxel Grid


2.2 Image to Point Cloud (n_points=1000)


2.3 Image to Mesh


Analysis:
At a distance threshold of 0.05, point clouds achieve the highest average F1 score (78.714), followed by meshes (74.213) and voxel grids (71.435). Point clouds outperform meshes by 4.501 points and voxels by 7.279 points. Meshes score 2.778 points higher than voxels. The curves generally rise as the distance threshold increases because more predicted points are considered close enough to the ground truth.
Point clouds may perform best here because they represent surface points directly. Mesh quality can be affected by inaccurate geometry, while voxel grids have limited resolution and may lose thin structures or fine details.
2.4 Effects of Hyperparameters
I trained point cloud models with n_points set (default 1000) to 500 and 2000, and other hyperparameters kept constant:


Analysis:
I compared an easy and a difficult example using 500, 1000, and 2000 output points. The easy example scores nearly perfectly across all settings (99.900–100.000). For the difficult example, the low scores may be caused partly by spatial misalignment between the predicted cloud and ground-truth mesh: their overall structures look reasonable, but even a small offset can reduce F1 at the strict 0.05 threshold.
Visually, the 2000-point prediction appears more evenly distributed because denser points fill gaps and cover the shape more continuously. Its F1 is also highest on this example (46.141), though the results do not improve monotonically with n_points.
2.5 Interpreting the Model
Method:
I visualize the highest and lowest scoring test examples to examine when the model succeeds or fails. For each example, I show the input image, the prediction, and the ground-truth mesh, along with a 360° GIF overlaying the point cloud sampled from the prediction and point cloud sampled from the ground truth in different colors, which makes spatial misalignment and reconstruction errors clearer to see and easier to identify.
Best Voxel Examples:


Worst Voxel Examples:


Best Point Examples:


Worst Point Examples:


Best Mesh Examples:


Worst Mesh Examples:


Analysis:
The visualizations suggest that all three representations reconstruct canonical, simple chairs best when the input view clearly shows chair features. The overlap between top-performing examples across representations indicates that the input instance and viewpoint strongly affect success.
The overlays reveal whether a low score comes from shape errors or alignment errors. Different representations' failure modes differ: voxel and mesh models struggle with unusual cases, such as wheelchair-like chairs or multiple chairs in one image, suggesting a bias toward familiar chair shapes. Point-cloud predictions can have a plausible overall shape but be spatially misaligned with the ground truth, which sharply lowers F1 at the strict 0.05 threshold.
Exploring Datasets
3. Extended Dataset
I compared the chair reconstructions produced by models trained on the three-class (chair, car, plane) and chair-only datasets. Both models are trained for the same iterations. For each model, I select its highest- and lowest-scoring chair test examples, then show the input image, ground-truth mesh, and predicted point cloud with its F1@0.05 score.
Best Chair-only Model Example:


Best Three-class Model Example:


Worst Example of Both Models:


Analysis:
Both models learn a useful prior for chair shapes and produce plausible overall 3D predictions. However, the chair-only model appears more reliable in fine details. In the Best Chair-only Model Example, the three-class model predicts a sparser chair back with noisy outliers along its edges. In the Best Three-class Model Example, its chair legs are tilted, while the chair-only model produces a denser, smoother shape.
Both models also perform worst on the same example: even there, the chair-only prediction looks more coherent. Overall, training on three classes allows the model to represent a broader range of objects, but may dilute chair-specific detail, while training only on chairs favors more consistent chair reconstructions.

Analysis:
The two models perform very similarly across all distance thresholds, and their average F1 scores rise as the threshold becomes more permissive. The three-class model is slightly lower at thresholds 0.02–0.03, but slightly higher at 0.04–0.05; at the key 0.05 threshold, it scores 79.615 versus 78.112 for chair-only training.
Although the three-class model achieves a similar—and slightly higher—average F1 score at the 0.05 threshold (79.615 vs. 78.112), its predictions look slightly less refined than those of the chair-only model. This suggests that a small improvement in F1 with higher thresholds does not necessarily mean better visual quality, F1 score with lower thresholds can be more indicative of detailed accuracy: training across multiple classes may preserve overall shape accuracy while reducing the consistency of chair-specific details.