Assignment 2 — Single View to 3D
1. Exploring loss functions
1.1 Fitting a voxel grid
I implemented voxel_loss in losses.py and fitted the source voxel grid to the target voxel grid. The optimized voxel grid is visualized below:

1.2 Fitting a point cloud
I implemented chamfer_loss in losses.py and fitted the source point cloud to the target point cloud. The optimized point cloud is visualized below:
1.3 Fitting a mesh
I implemented smoothness_loss in losses.py and fitted the source mesh to the target mesh. The optimized mesh is visualized below:

2. Reconstructing 3D from single view
2.1 Image to voxel grid
I implemented a decoder and forward for voxel grid in model.py. I also added the visualization code for voxel grid in eval_model.py.
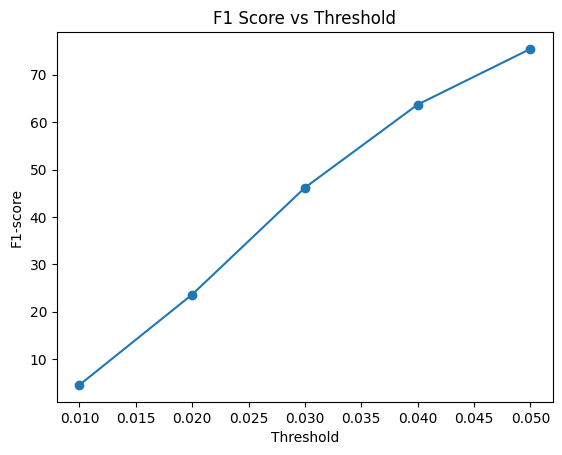
The F1@0.05 is 75.5. The visualizations of three example chairs in the test set and the F1 plot are as follows:

2.2 Image to point cloud
I implemented a decoder and forward for point cloud in model.py. I also added the visualization code for point cloud in eval_model.py.
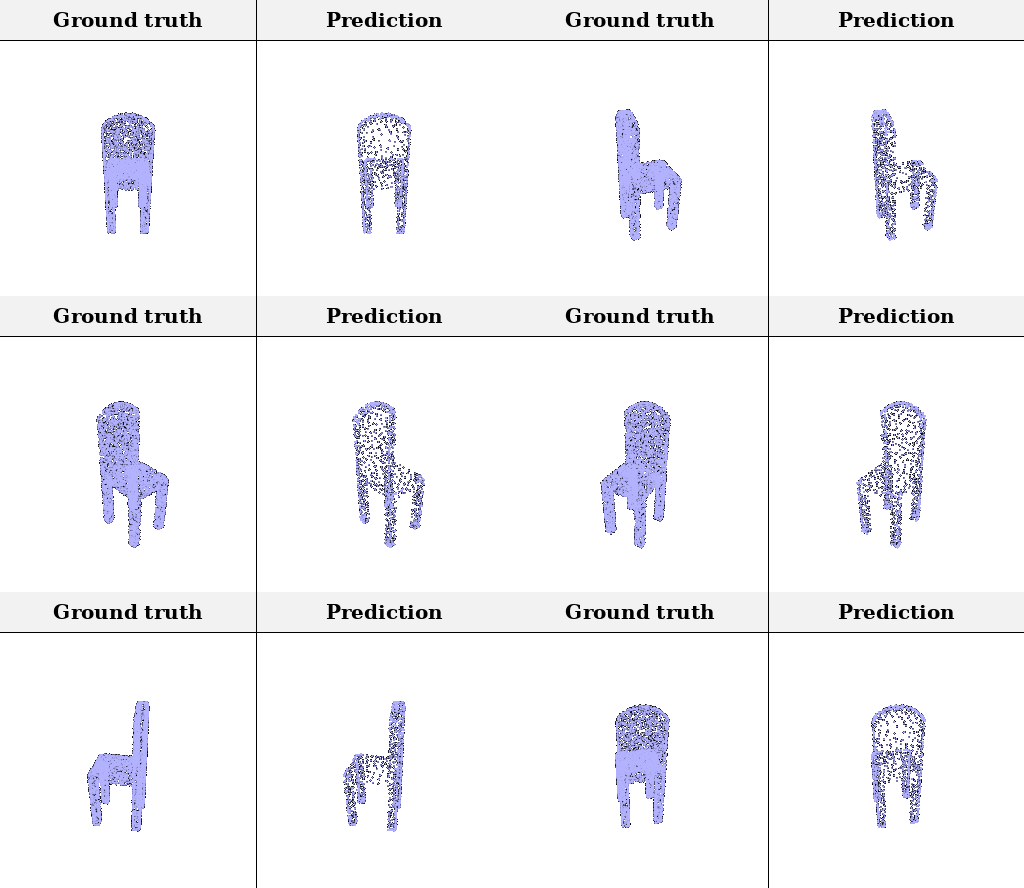
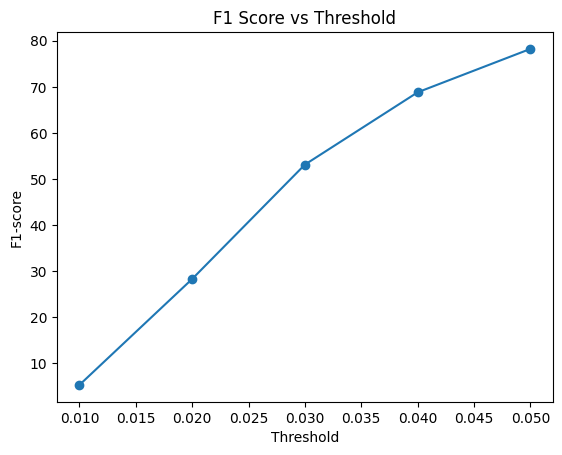
The F1@0.05 is 77.9. The visualizations of three example chairs in the test set and the F1 plot are as follows:

2.3 Image to mesh
I implemented a decoder and forward for mesh in model.py. I also added the visualization code for mesh in eval_model.py.
The F1@0.05 is 75.2. The visualizations of three example chairs in the test set and the F1 plot are as follows:

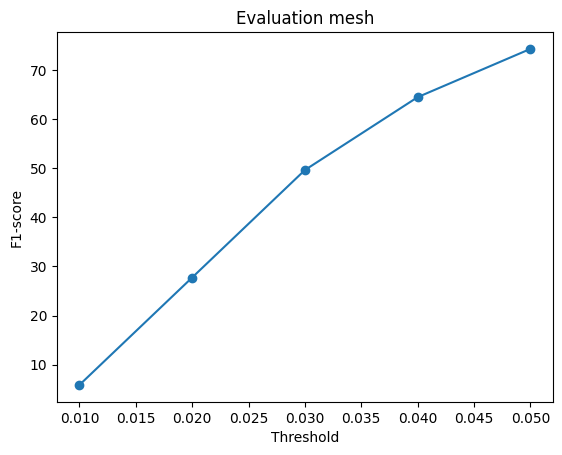
The F1@0.05 scores for voxel, point cloud and mesh models are 75.5, 77.9 and 75.2 respectively. The point cloud model performed the best because its points can move freely and are trained with the Chamfer loss, which directly matches the point-based F1. The mesh model is limited by deforming a single ico-sphere with smoothing, which stretches faces across thin parts, and the voxel model by its limited resolution, which loses thin structures such as legs.
2.4 Analyse effects of hyperparams variations
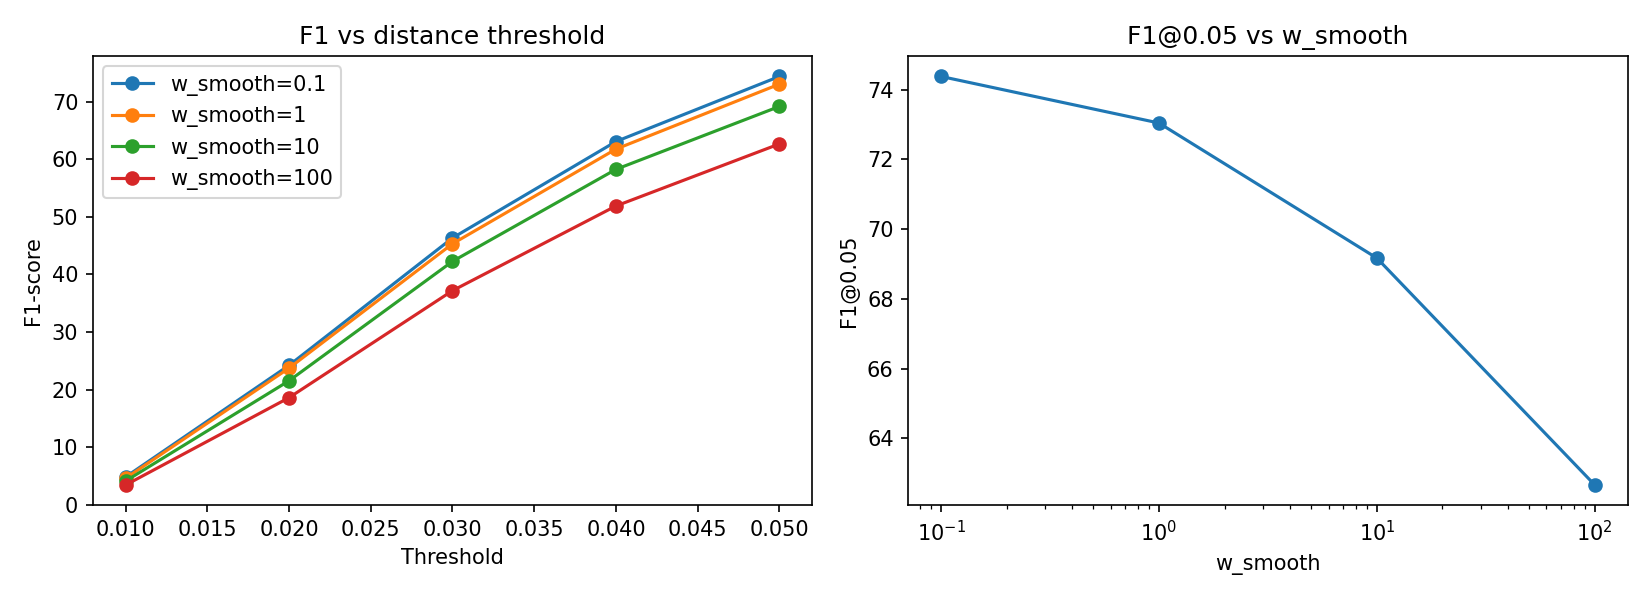
I varied w_smooth among 0.1, 1, 10, 100 and trained the mesh model with 5000 training steps. I qualitatively and quantitatively analyzed the effects of the variations.
The visualization below shows how the deformed meshes look with different w_smooth. The mesh with larger w_smooth is smoother but lacks details. The one with smaller w_smooth is more detailed but has more spiky artifacts.
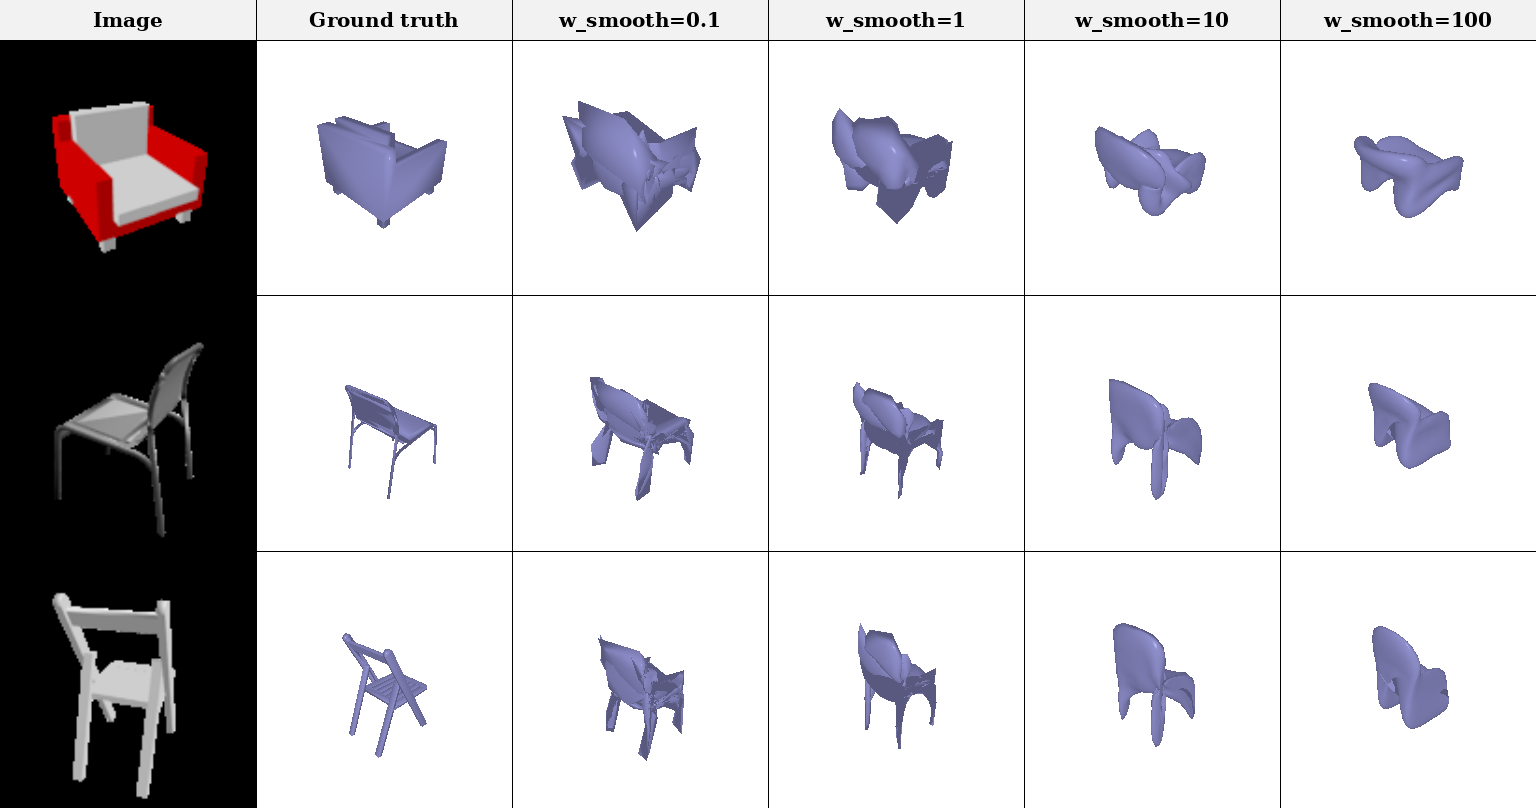
w_smooth.The figure below shows the F1 scores with different w_smooth. Specifically, F1@0.05 scores are 74.4, 73.0, 69.2 and 62.7 for w_smooth = 0.1, 1, 10 and 100 respectively. F1 doesn't penalize folds and spikes near the surface, so the best F1 (w_smooth = 0.1) looks worst, while w_smooth = 1, 10 gives cleaner meshes.
w_smooth.2.5 Interpret your model
I created the two visualizations below to understand what the learned model does.
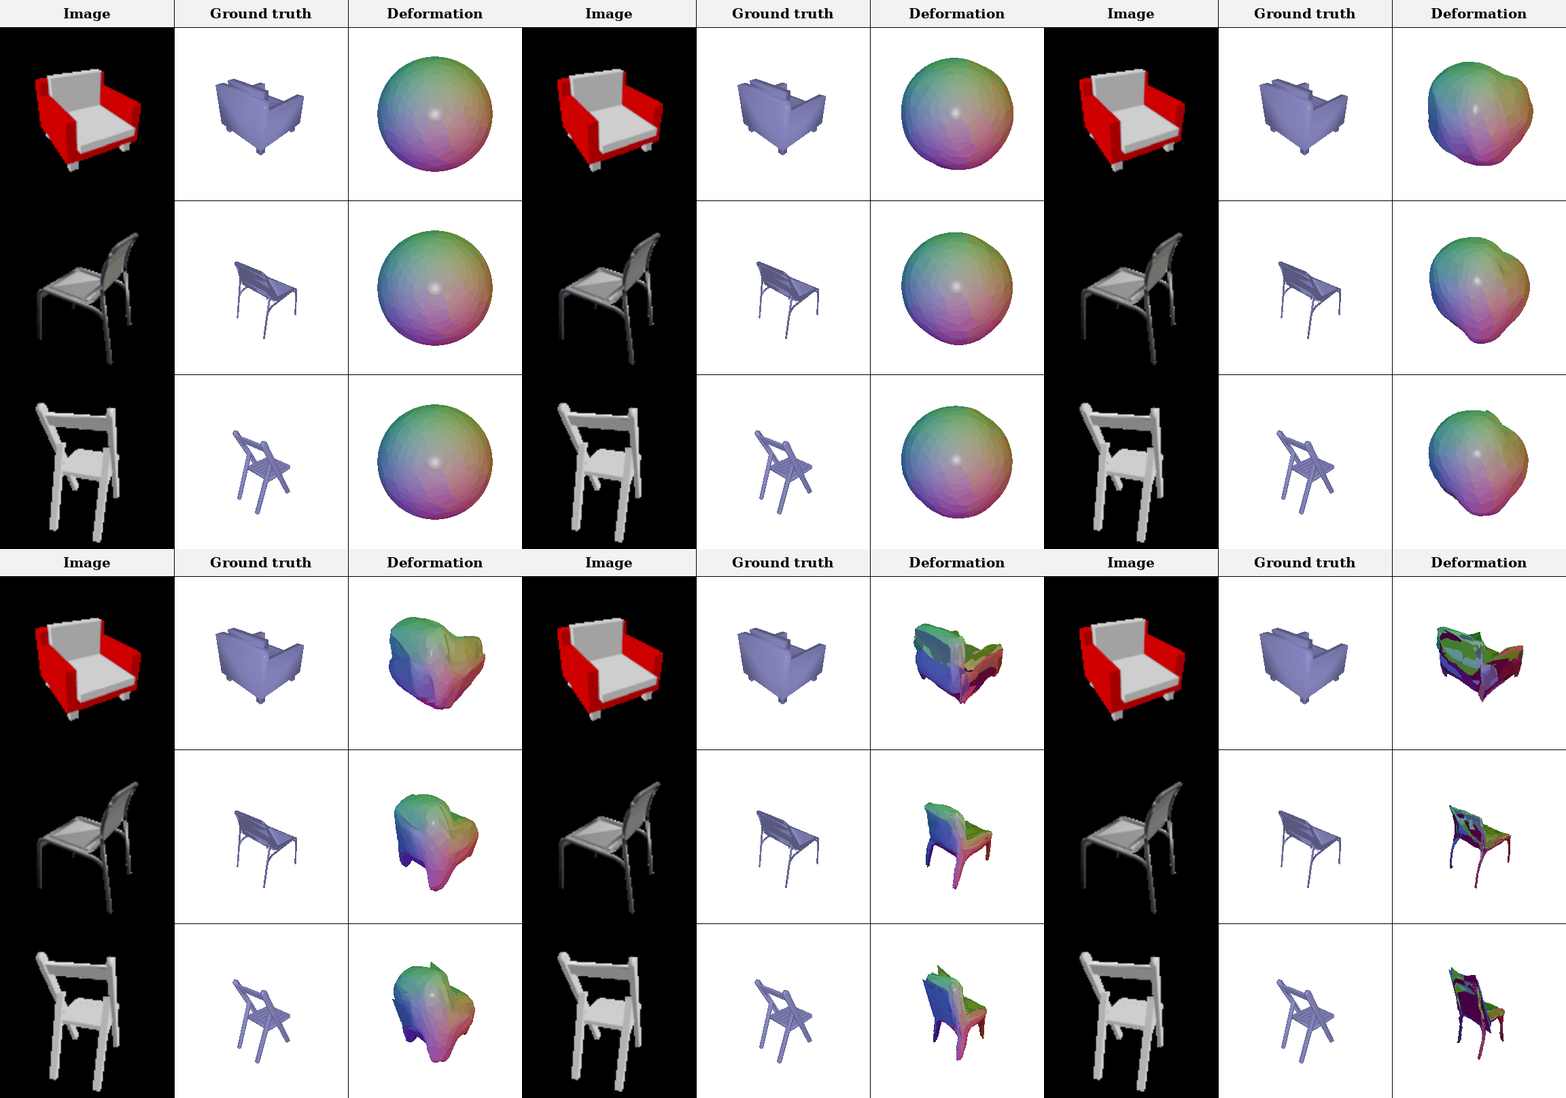
Visualization 1: How does the mesh model deform the sphere mesh?
I colored each ico-sphere vertex by its original position and visualized the deformation to the target chair shape by animation. The visualization demonstrates that the sphere's bottom part becomes the legs, and its top becomes the seat front and backrest. This shows how the mesh model deforms the source sphere mesh to the target shape and would be useful to identify appropriate parameters for the mesh model (e.g. w_chamfer and w_smooth).
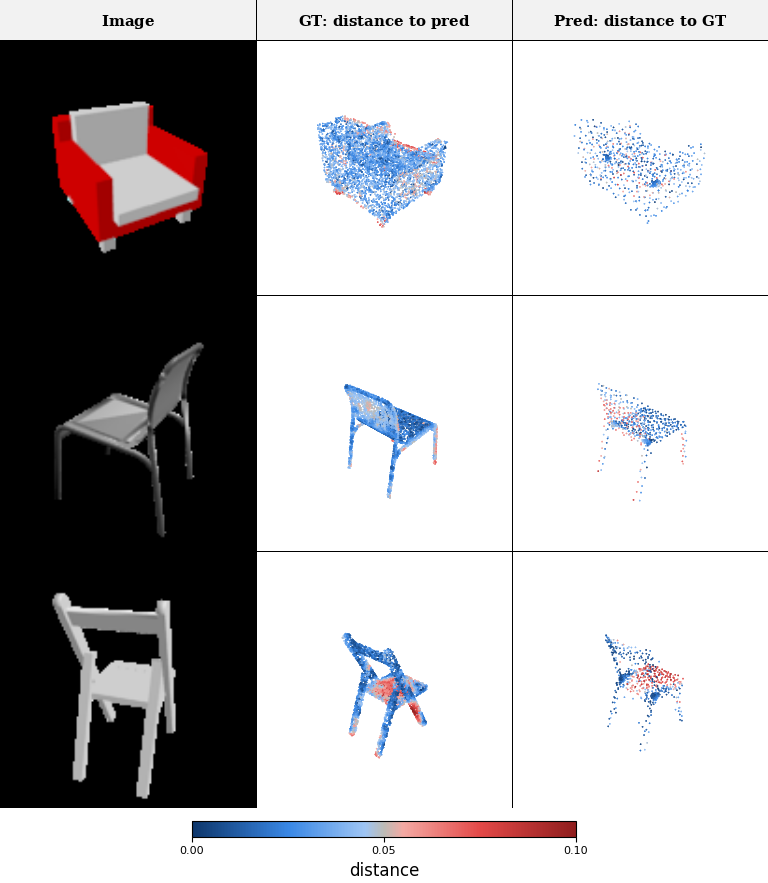
Visualization 2: Where are the errors in the point cloud model?
I colored ground-truth and predicted points by their distances to the closest predicted and ground-truth points respectively. The visualization demonstrates ground-truth points far from any prediction lie on thin structures such as legs and thin seats. This visualization shows where the errors exist in the prediction of the point cloud model and suggests how to tune hyperparameters.
3. Exploring other architectures / datasets
3.1 Implicit network
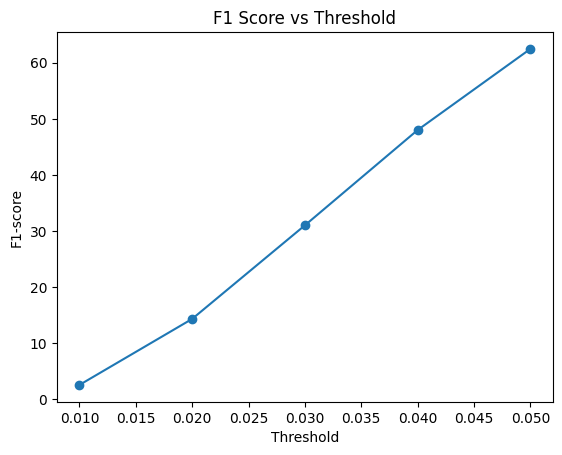
I implemented an implicit decoder in q3_1.py referring to Occupancy Networks [1] and its official implementation [2]. Given the ResNet18 image feature and a 3D query point, the decoder predicts the occupancy of the point. It is queried on a 32^3 grid in (-1, 1)^3 and rendered using MISE and Marching Cubes at test time.
The F1@0.05 score is 62.5. The predictions are smooth but lose fine detail such as thin legs and armrests.

3.2 Parametric network
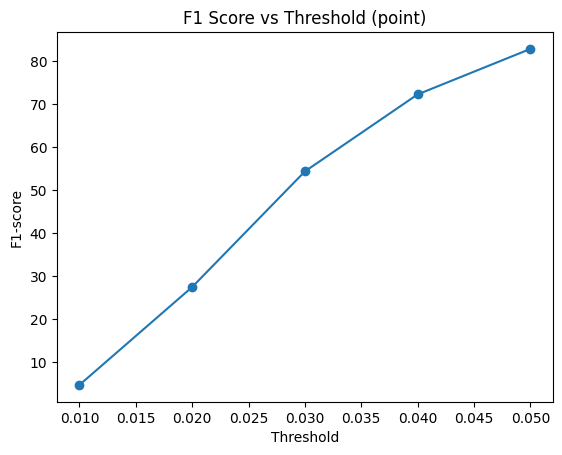
I implemented AtlasNet [3] in q3_2.py following its official implementation [4]. The surface is represented by 25 patches: each patch is an MLP that maps a 2D point sampled from the unit square to a 3D point. At test time a regular grid on each square is mapped and triangulated into a mesh.
The F1@0.05 is 82.8 for the 3D points. The overall shapes are captured well, but some thin parts such as legs are missing.

3.3 Extended dataset for training
I extended the dataset and included the three classes (chair, car, and plane) to train the model. I quantitatively and qualitatively compared the performance of both "training on one class" and "training on three classes" models.
The table below shows the F1 scores of both models for each class. The result shows that training on three classes slightly (+1.7) improved the F1 score of the chair class even though each chair was less frequent in the training set. This indicates that the planes and cars added useful variety for learning overall shape.
| F1@0.05 | Training on chair | Training on 3 classes |
|---|---|---|
| Chair | 77.9 | 79.6 |
| Planes | 69.6 | 96.4 |
| Cars | 65.8 | 93.7 |
| All | 72.8 | 88.0 |
The chair-only model can't reconstruct planes or cars. The figure below shows the qualitative results of both models: the chair-only model outputs a chair-like shape for them. On the other hand, the three-class model can output a wing and body for plane and a car-shaped body for car while maintaining the chair shape.

References
[1] Mescheder et al., "Occupancy Networks: Learning 3D Reconstruction in Function Space", CVPR 2019
[2] GitHub: autonomousvision/occupancy_networks https://github.com/autonomousvision/occupancy_networks [Accessed Sep 2026]
[3] Groueix et al., "AtlasNet: A Papier-Mâché Approach to Learning 3D Surface Generation", CVPR 2018
[4] GitHub: ThibaultGROUEIX/AtlasNet https://github.com/ThibaultGROUEIX/AtlasNet [Accessed Sep 2026]