
2.3 Image to mesh


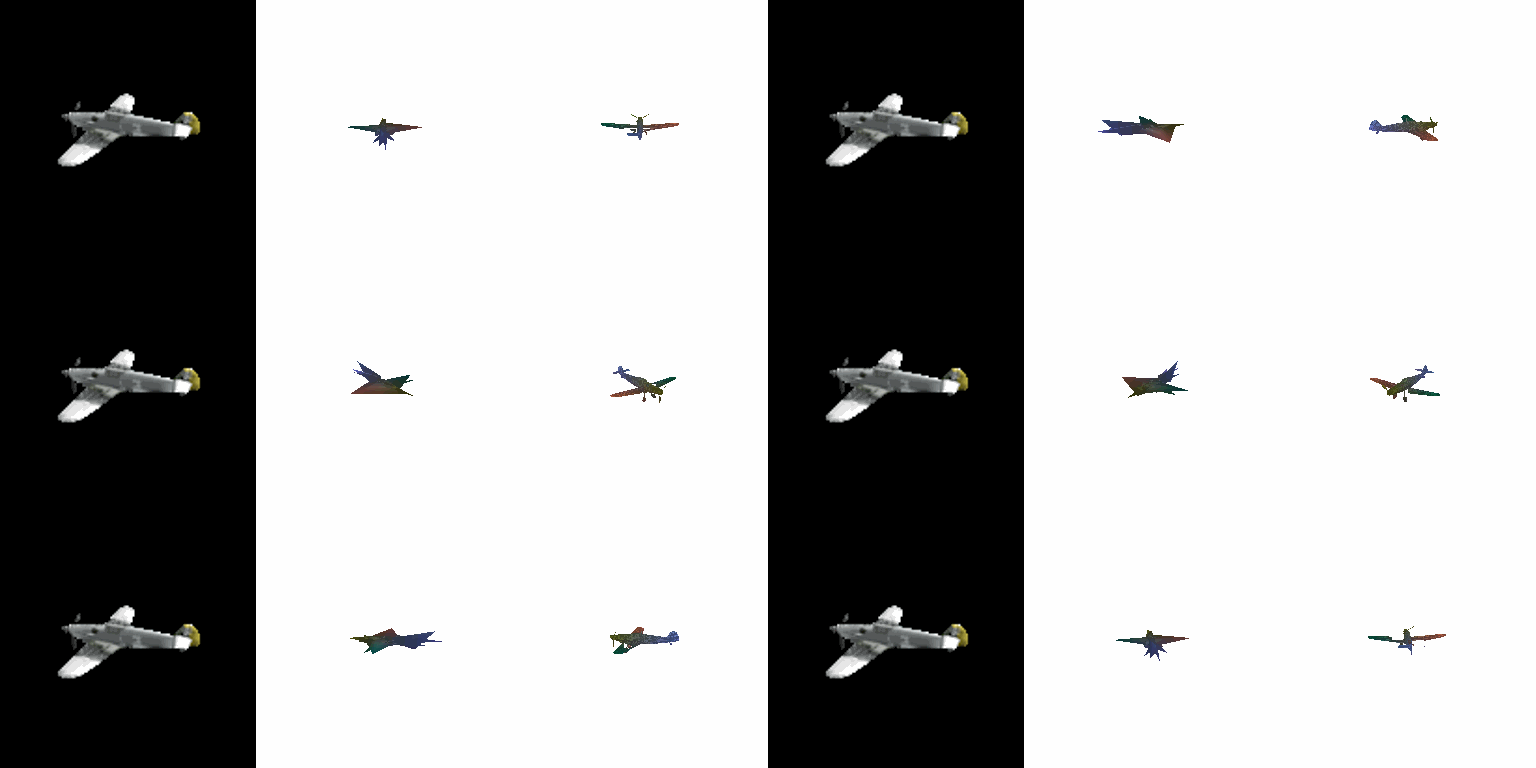
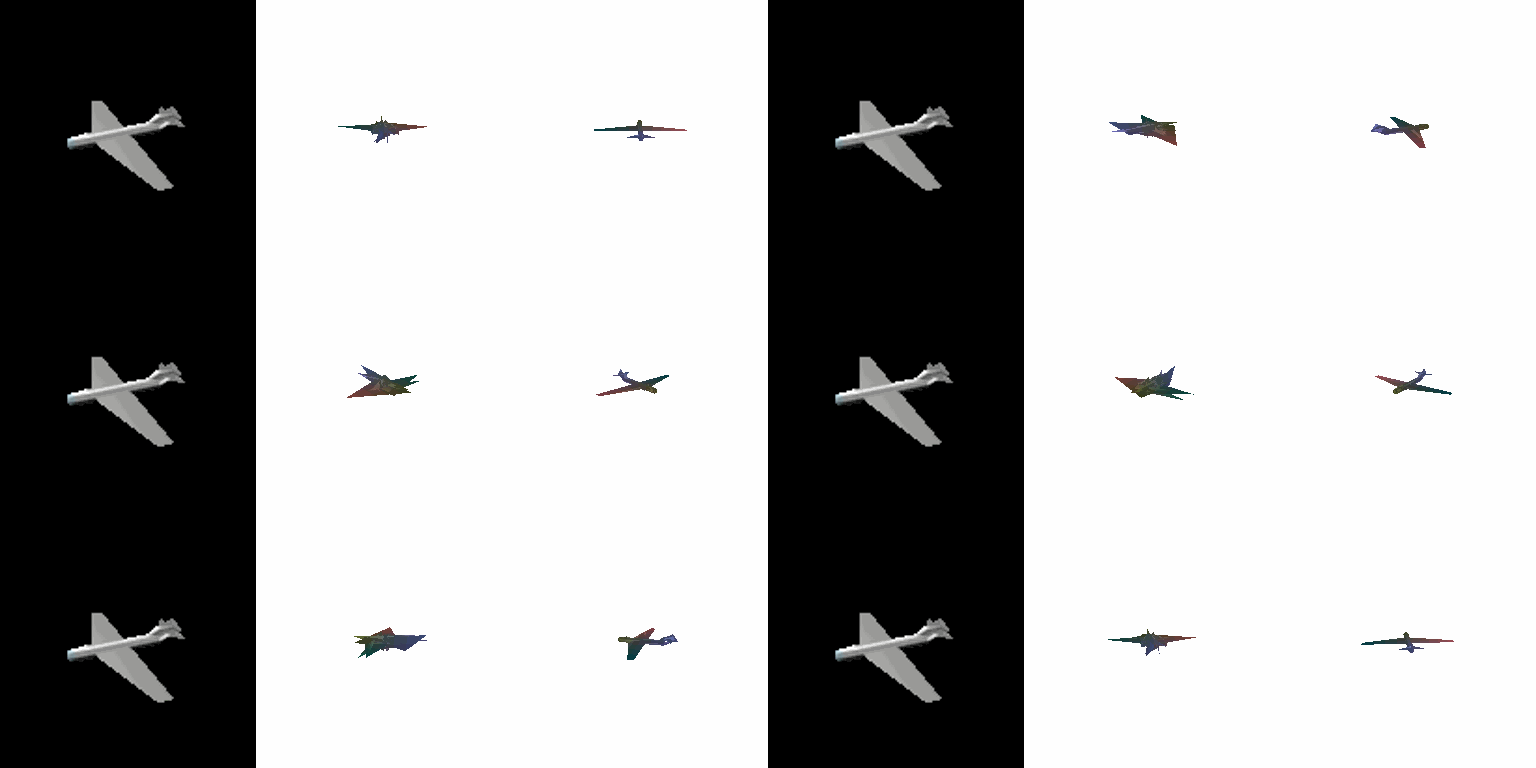
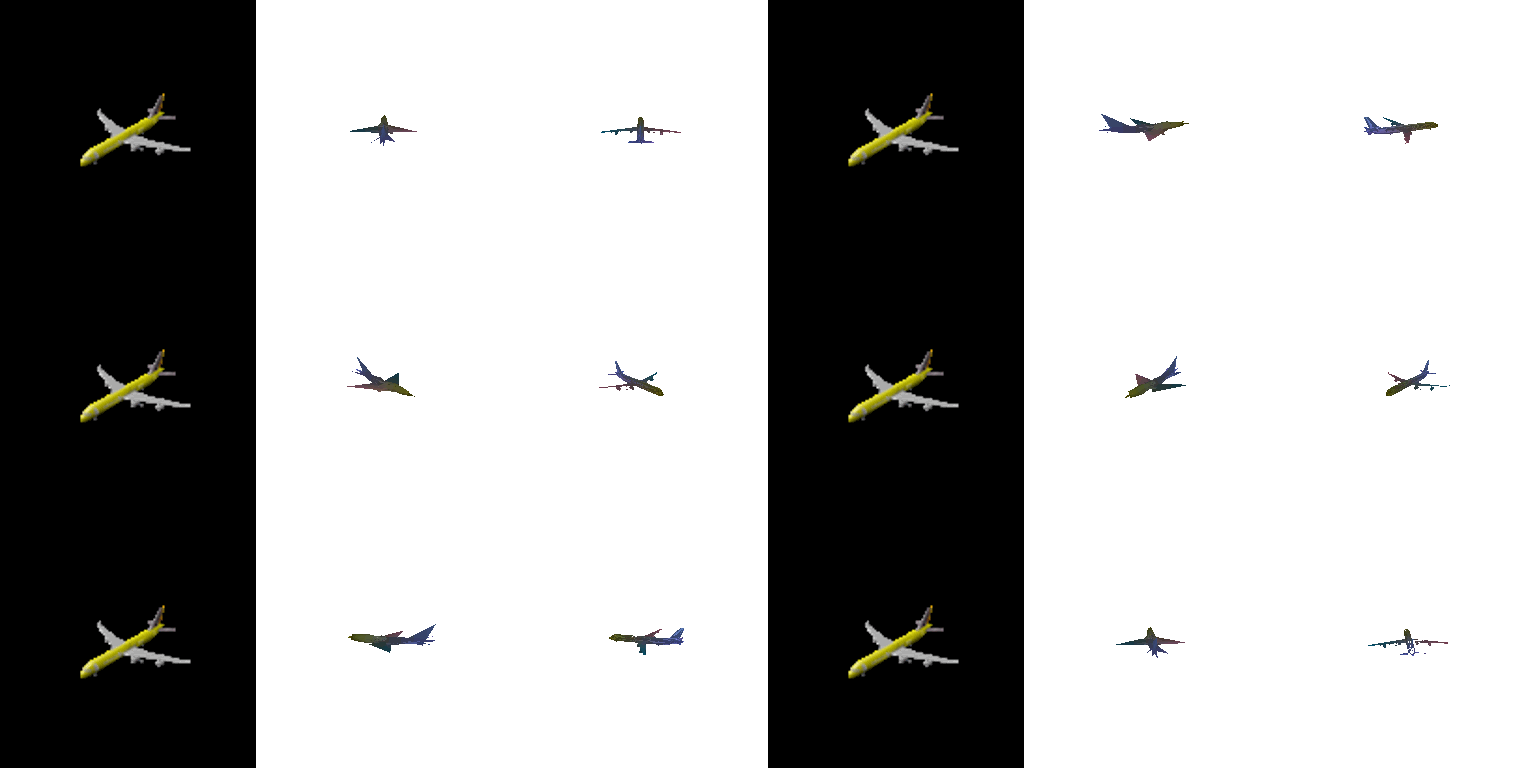
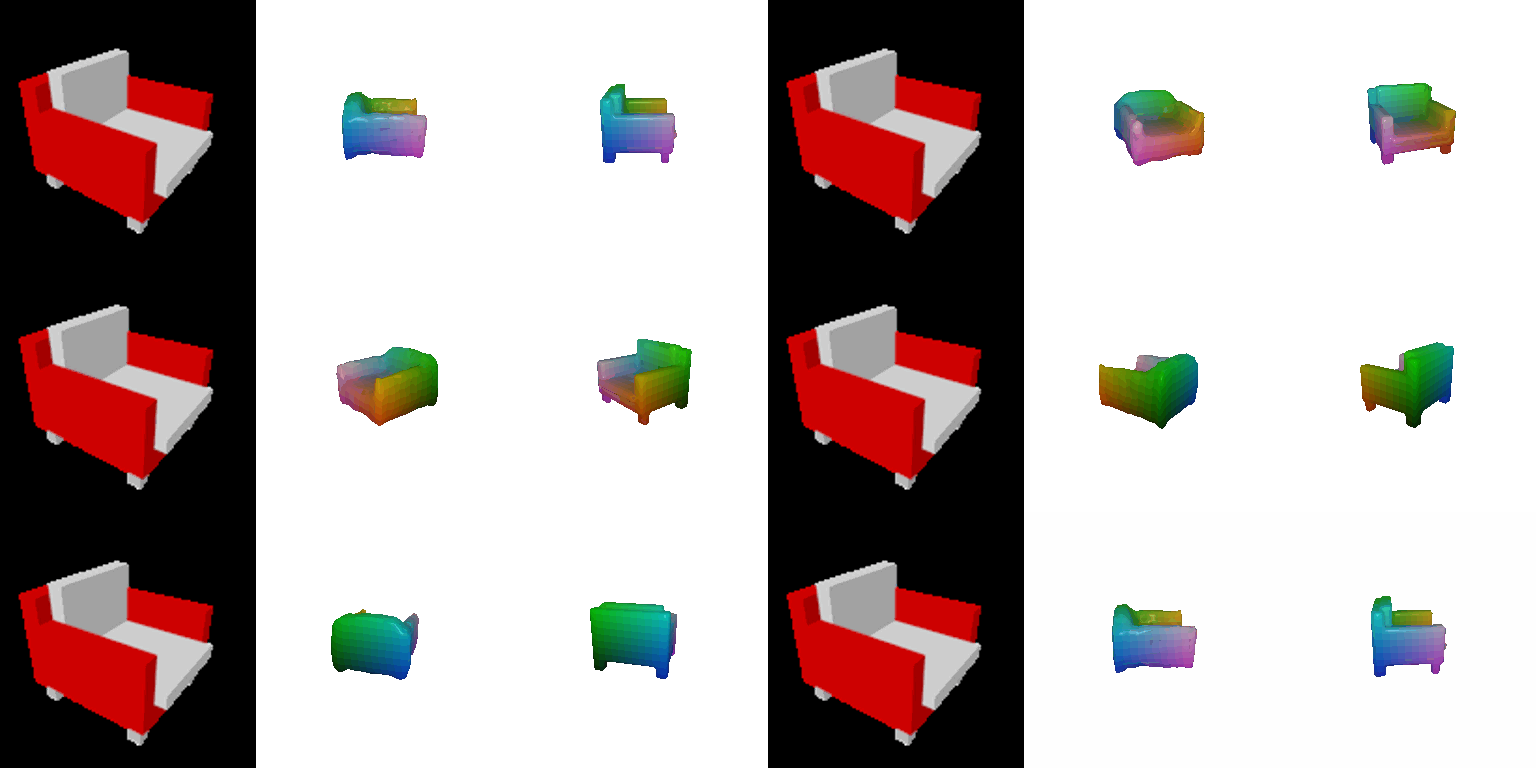
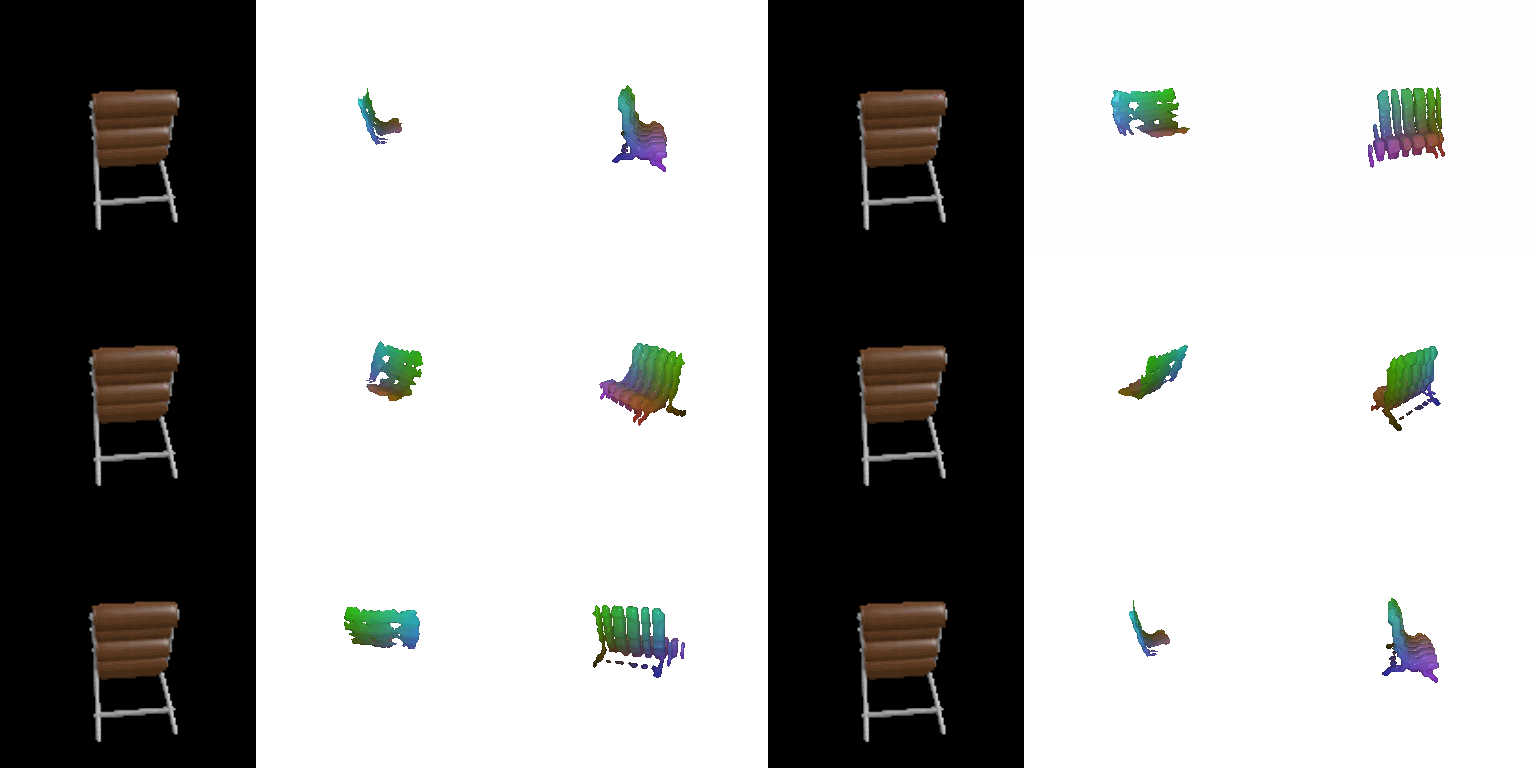
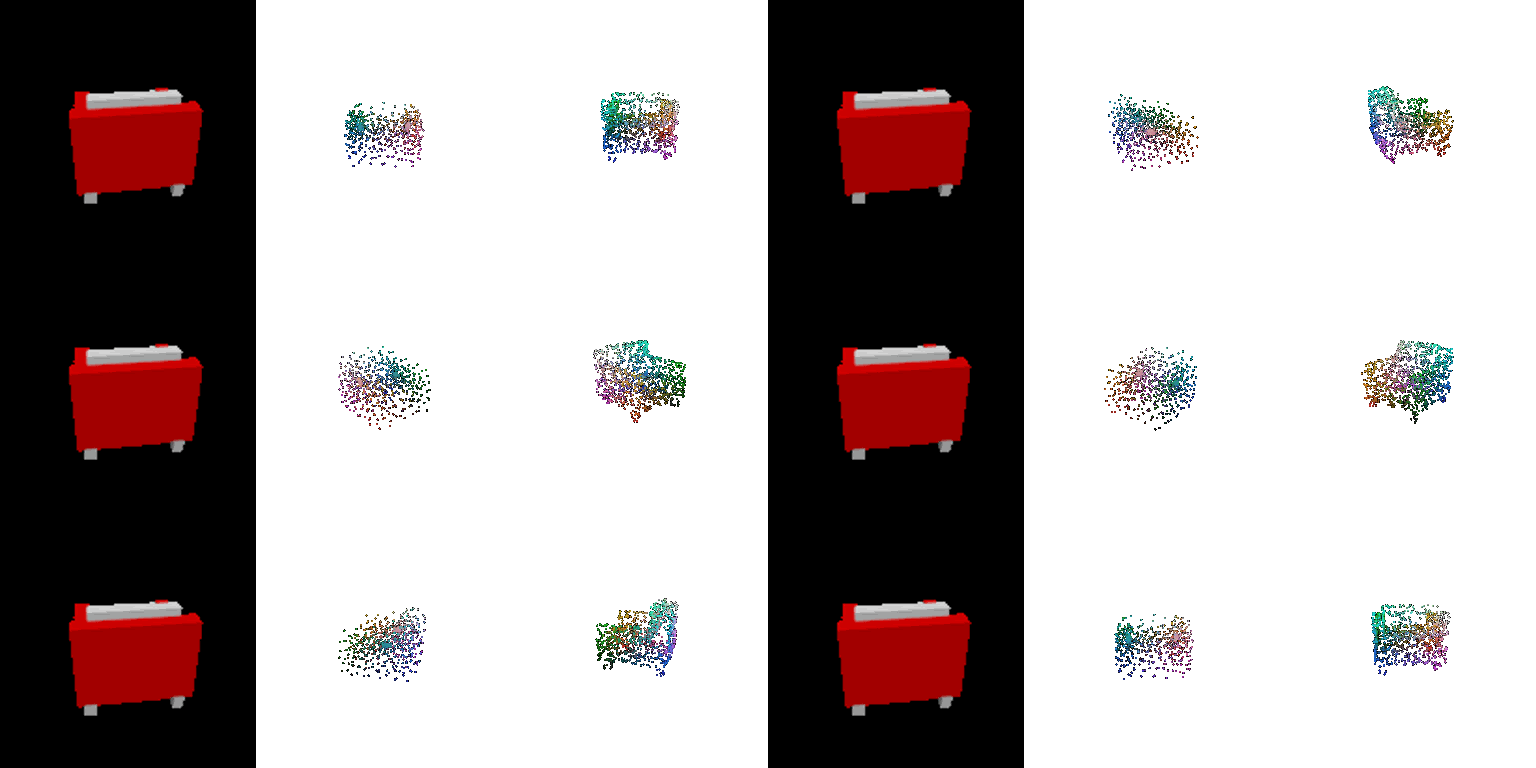
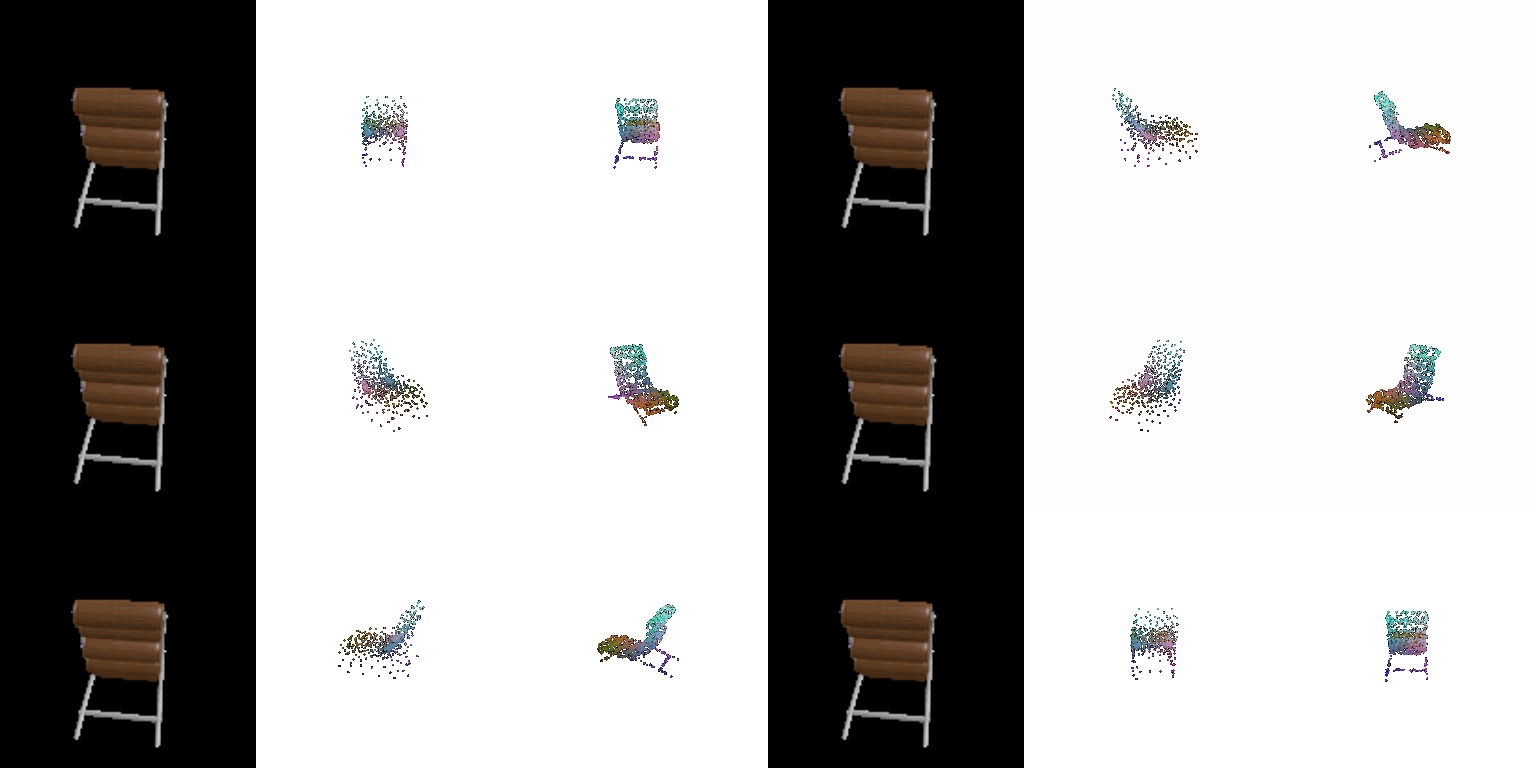
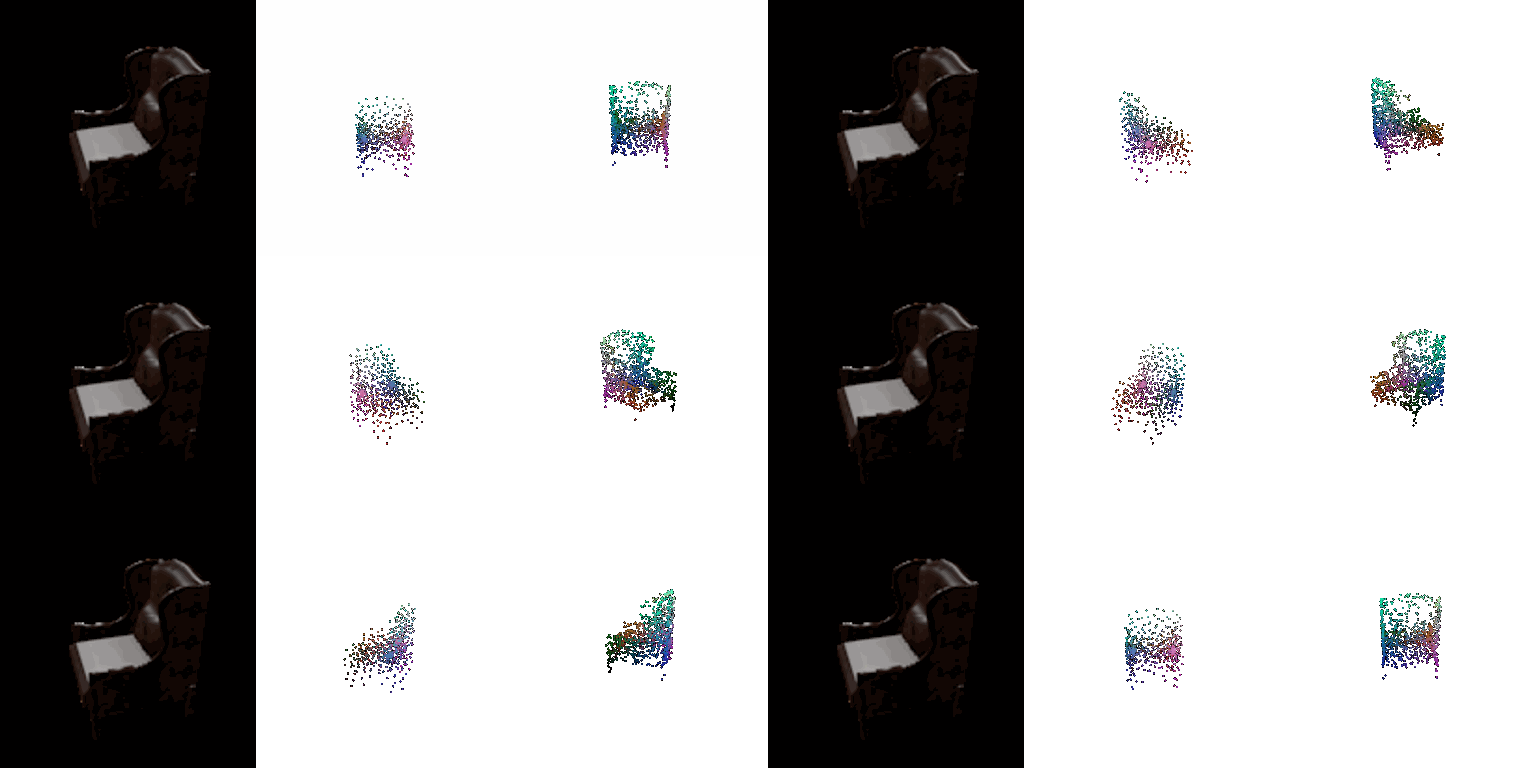
(Left: input RGB, Middle: prediction, Right: ground truth)
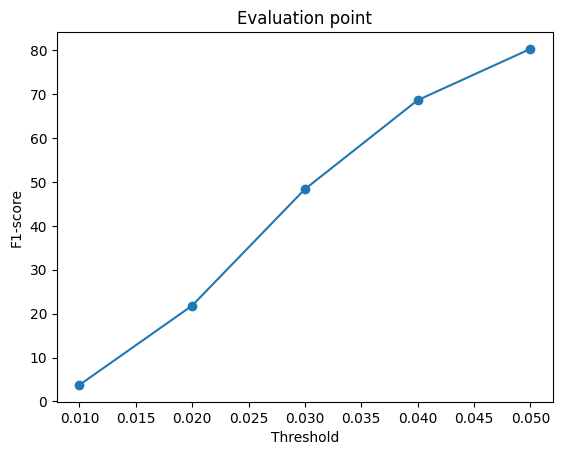
F1@0.05: 73.72
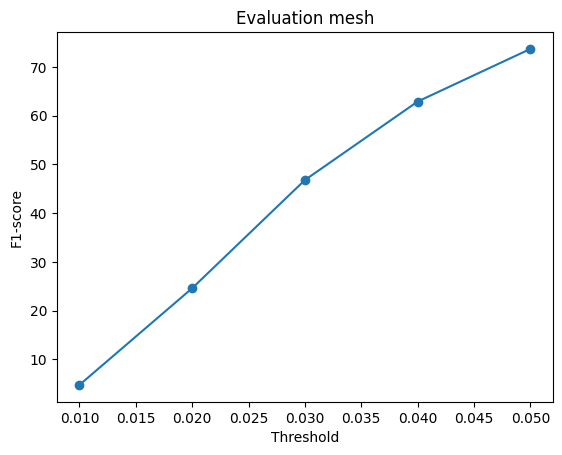
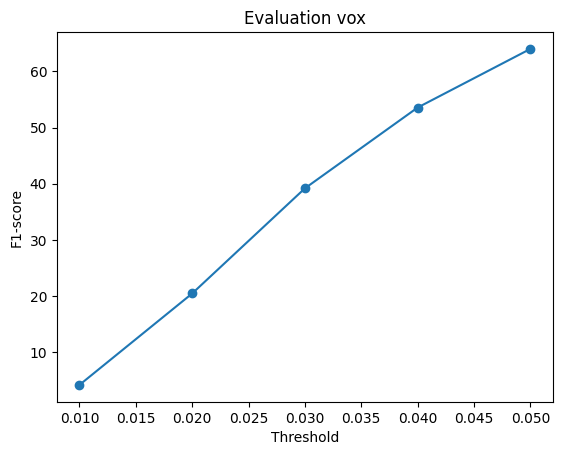
Compare F1 score of 3D reconstruction for meshes vs pointcloud vs voxel grids
Note: this may not be a completely fair comparison as voxel grid was trained for more iterations. Regardless, it performed the worst under the F1 scoring metric.
| Representation | F1@0.05 |
|---|---|
| Voxel grid | 64.02 |
| Point cloud | 80.32 |
| Mesh | 73.72 |
Overall, if only in terms of the F1 score, Point clouds score the best because they are the most likely to score high based on the metric used (F1's computation is similar in logic to the CD loss used to train the model with), also it does not have structural constraints like mesh or voxel for its points, giving them lots of freedom in their positioning in the 3D space.
With PCD scoring the highest, then it is mesh, and voxel grid performed the worst. Meshes not performing as well as PCDs possibly due to the constraint of continuity, it could not form holes because it cannot change topology from a sphere, making the generationg of edgy structure like chair legs particularly difficult.
Voxel grids performed the worst since they were based on a occupany loss which was pretty crude, plus the resolution is voxel size dependent, so with finer structure, it my not be the best performing model.
2.4 Effects of hyperparameter variations
I tried to implement sweep for two hyperparameter, one for PCD and one for mesh, I could not have implemented more due to time constraint.
n_points (point cloud)
| n_points | F1@0.05 |
|---|---|
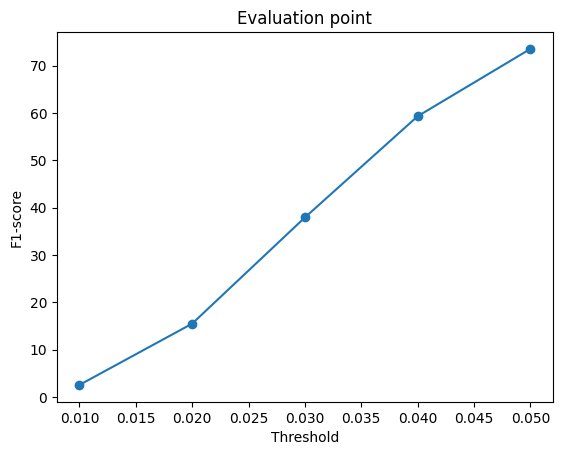
| 500 | 73.56 |
| 1000 (2.2) | 80.32 |
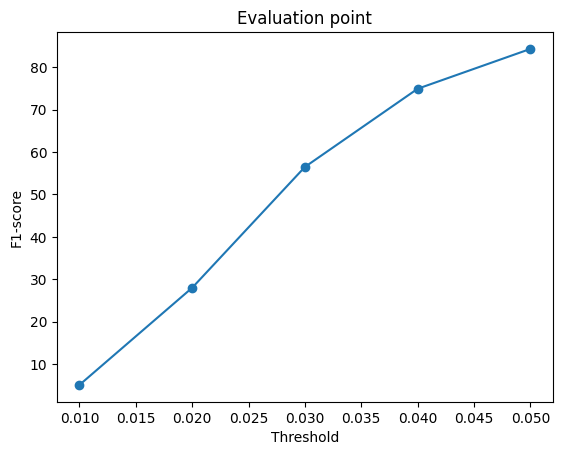
| 2000 | 84.30 |
| 5000 | 87.92 |
n_points = 500


n_points = 2000


n_points = 5000


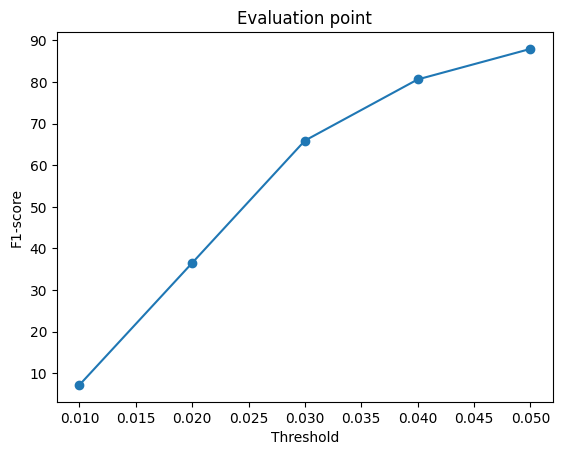
Overall, the more points used, the highest F1 score achieved with testing. Likely due to the fact that with more coverage from more points, the distance between points in predicted PCD and target PCD would likely be shorter since the points are more dense.
This may not the the best option to keep growing the n_points though, as the return did start to diminish and with more points, the cost of the model grows.
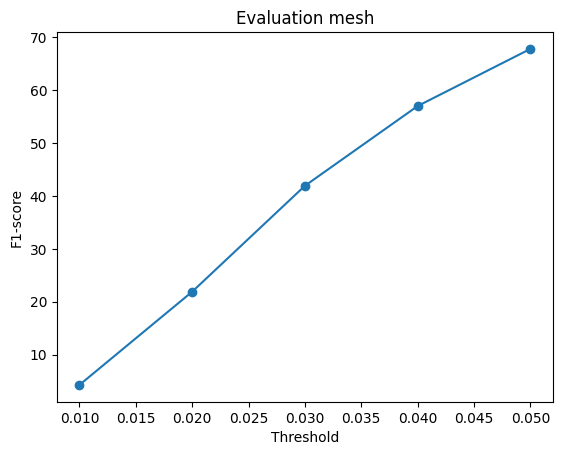
ico_level (mesh initialization)
| ico_level | F1@0.05 |
|---|---|
| 2 | 67.76 |
| 4 (2.3) | 73.72 |
| 5 | 73.51 |
ico_level = 2


ico_level = 5


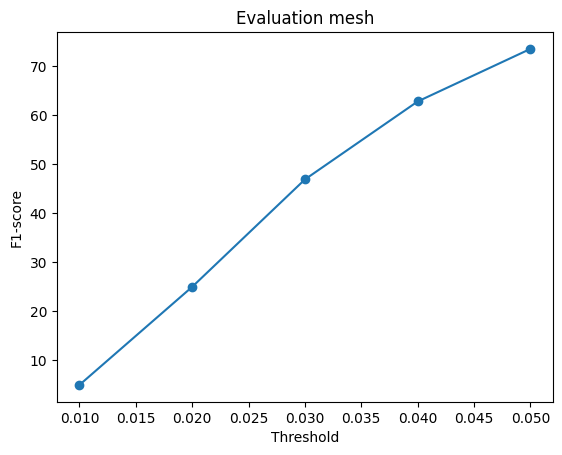
The conclusion can be drawn here that ico_level of 2 may be too coarse for the mesh to be able to represent fine structures like chair legs. But once beyond level more, more vertices weren't necessarily helping, as the F1-score actually dropped. So more vertices is not necessarily better.
2.5 Interpret your model
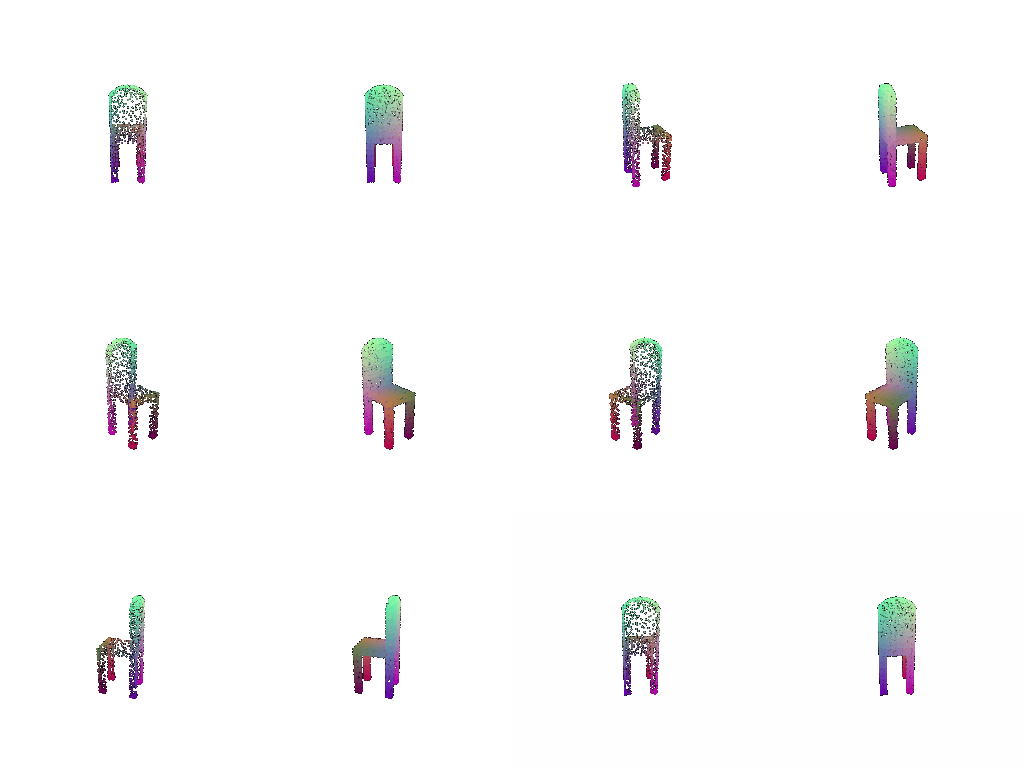
To visualize why an example scores the F1 it does, I split F1@0.05 into its two halves and show where each one is lost which shows directly what are the hallucinated geometry (Precision) and what geometry is missed (Recall).
The gallery comes from the 2.3 mesh model, showing the split visualizations for some of the worst/ median/ best test examples based on their F1-scores.
The red dots represent the predicted points that has no ground truth point within 0.05 (Prediction) and the ground truth points with no predicted point within 0.05 (Recall)
Worst / median / best examples
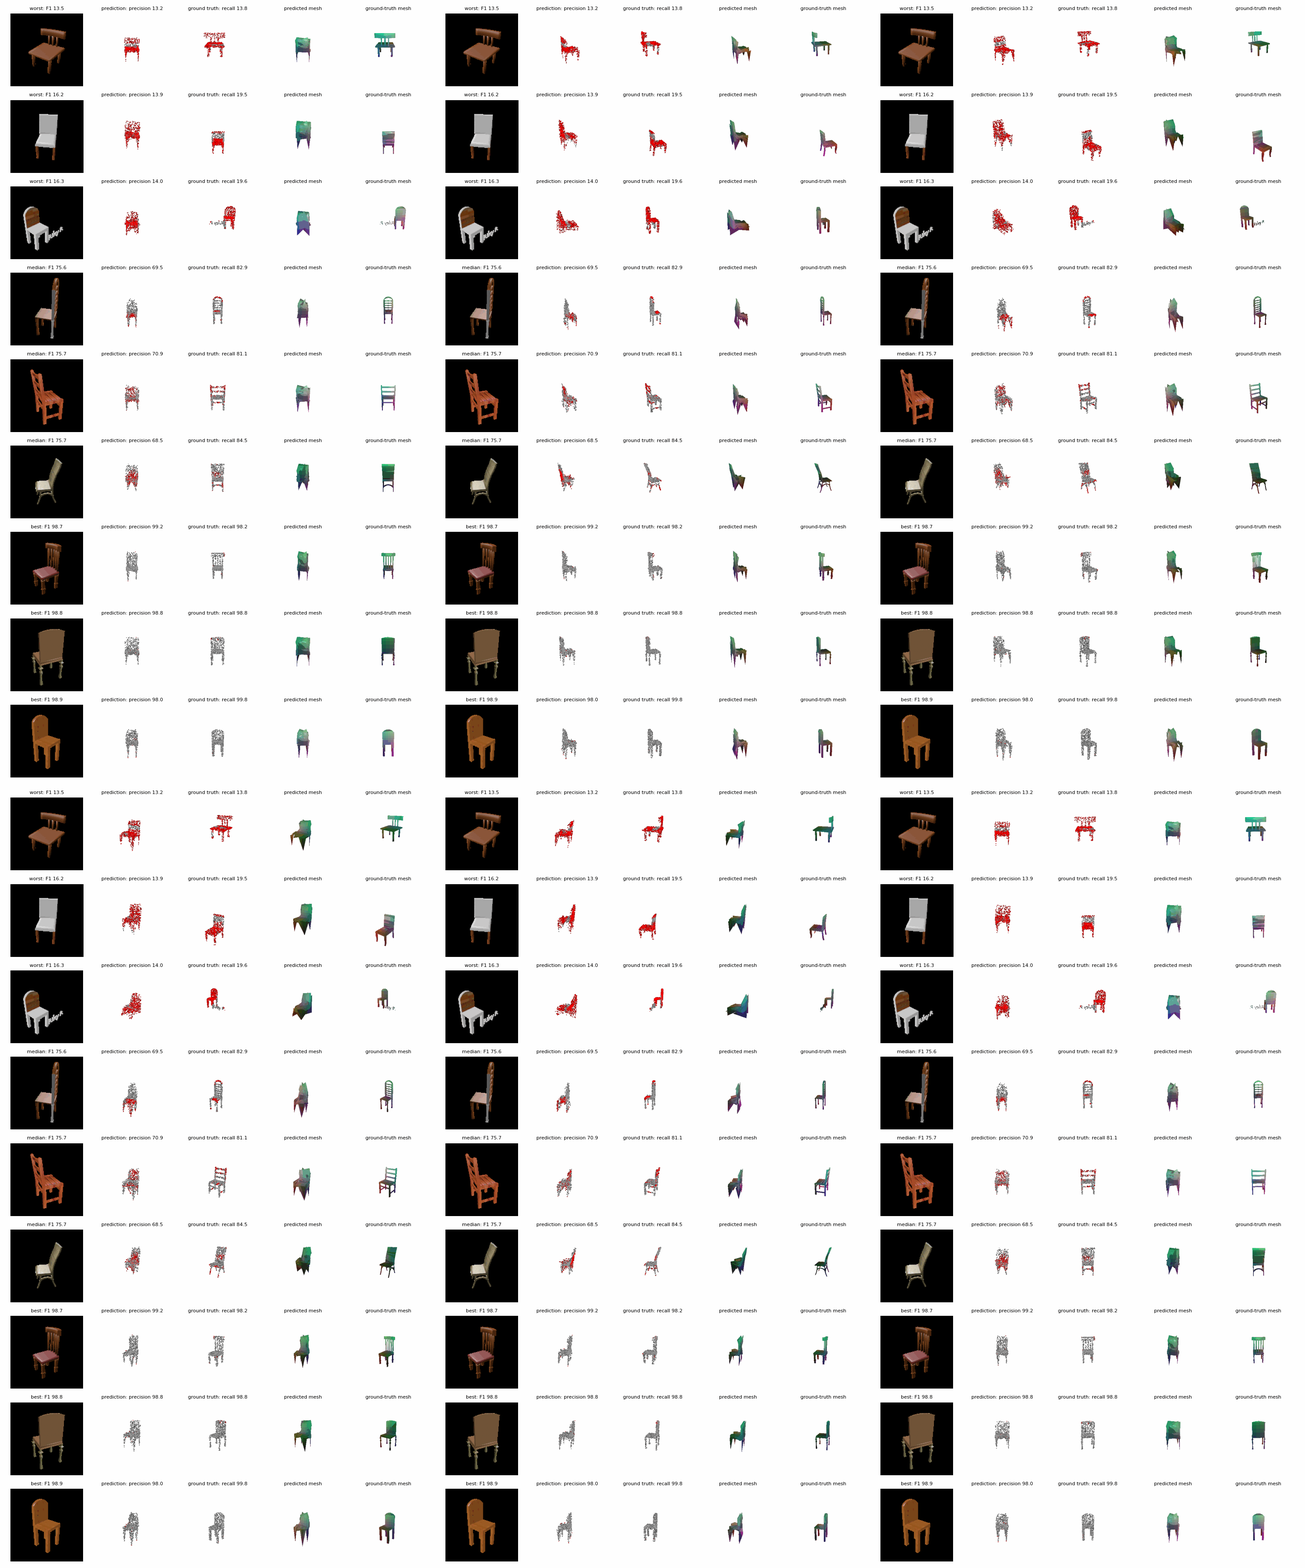
Test examples sorted by F1@0.05: the 3 lowest (worst), the 3 around the median (median) and the 3 highest (best), one per row. Columns, left to right:
- Input image, titled with the example's F1@0.05.
- Prediction as points (the points the F1 score is computed on). Red: more than 0.05 from any ground-truth point; these lower precision. Grey: within 0.05.
- Ground truth as points. Red: more than 0.05 from any predicted point, i.e. parts the model missed; these lower recall. Grey: within 0.05.
- Predicted mesh.
- Ground-truth mesh.
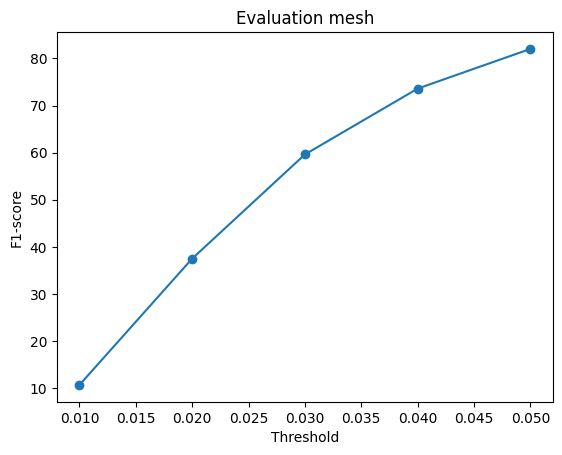
3.3 Extended dataset for training (mesh)
| Trained on | Tested on | F1@0.05 |
|---|---|---|
| chair (2.3) | chair | 73.72 |
| 3 classes | chair | 71.89 |
| 3 classes | 3 classes | 82.01 |
Tested on 3 classes:
Tested on chairs only:


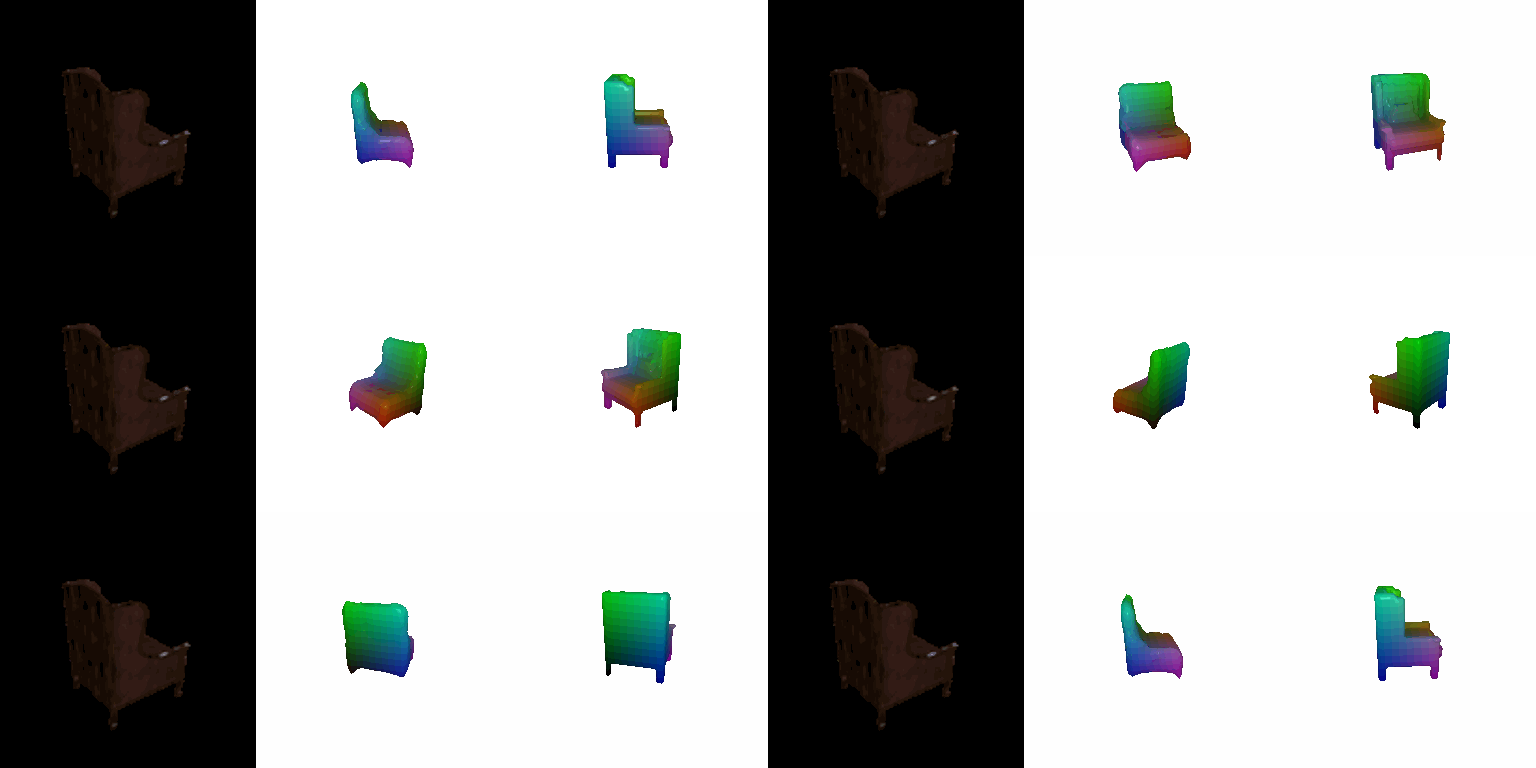
(Left: input RGB, Middle: prediction, Right: ground truth)
From the F1 score and the visualizations, training on one class did decrease the F1-score of the "chair" class as compared to only training on one class slightly (from 73.7 to 71.9). But this is totally expected, within the 10,000 steps of training, now only a portion of the time is trained on the chairs as compared to all. Also the space of the decoder is shared with the other two classes, making it likely less able to produce chair details.
The overall F1-score is quite high, likely because the other two classes - cars and planes are more compact and easier to train. One thing that was noticably well done here, which is also evident from the later visualizations, is that although the mesh may look less like ground truth for a bit, it was still clear to see that it well-sits in the target class.
MORE Visualizations
Planes: