


Model architecture: A PointNet encoder with shared MLPs and global max pooling, followed by a fully connected classifier for three object classes.
| Metric | Accuracy | Epoch (0-indexed) |
|---|---|---|
| Best | 97.80% | 87, 140 |
| Final | 97.27% | 249 |
All six examples are correctly classified.
| Chair | Vase | Lamp |
|---|---|---|
|
|
|
| Sample 189 · GT: Chair · Pred: Chair | Sample 678 · GT: Vase · Pred: Vase | Sample 783 · GT: Lamp · Pred: Lamp |
|
|
|
| Sample 521 · GT: Chair · Pred: Chair | Sample 708 · GT: Vase · Pred: Vase | Sample 847 · GT: Lamp · Pred: Lamp |
| Sample 406 | Sample 618 | Sample 916 |
|---|---|---|
 |
 |
 |
| GT: Chair · Pred: Lamp | GT: Vase · Pred: Lamp | GT: Lamp · Pred: Vase |
Chair → Lamp (406): The chair appears to have a folding seat in the raised position, leaving a flat shape without a clearly protruding sitting surface. This removes a useful cue for recognizing a chair, making the silhouette resemble a light fixture or decorative object.
Vase → Lamp (618): The vase has a straight cylindrical body with wide rims at the top and bottom, resembling a cylindrical lampshade. Its shape lacks the narrow neck or rounded body seen in many vases, which may explain the confusion.
Lamp → Vase (916): The lamp has a broad upper section and a circular pedestal, giving it a silhouette similar to a vase on a stand. The model may confuse this arrangement with a decorative vessel, since the point cloud provides no material or lighting cues.
Model architecture: A PointNet model that combines per-point and global features, followed by shared MLPs to predict six part labels for each point.
| Metric | Point accuracy | Epoch (0-indexed) |
|---|---|---|
| Best | 90.29% | 204 |
| Final | 88.77% | 249 |
| Sample ID | Prediction | Ground Truth | Point Accuracy |
|---|---|---|---|
| 297 | 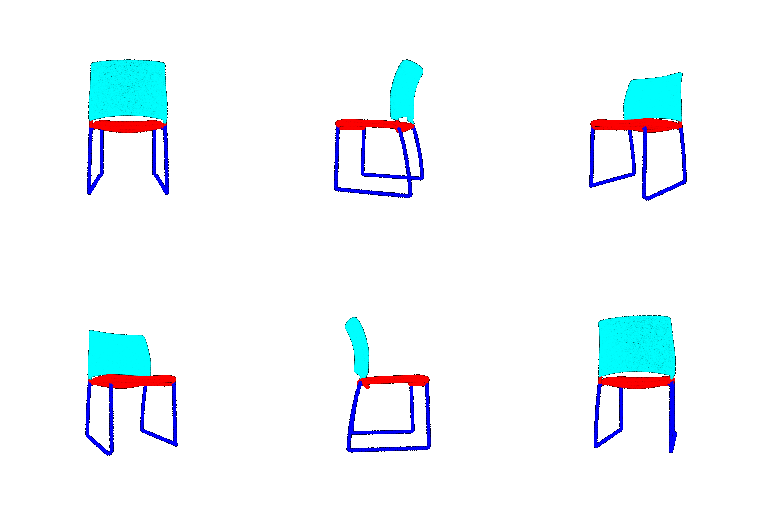 |
 |
99.51% |
| 471 | 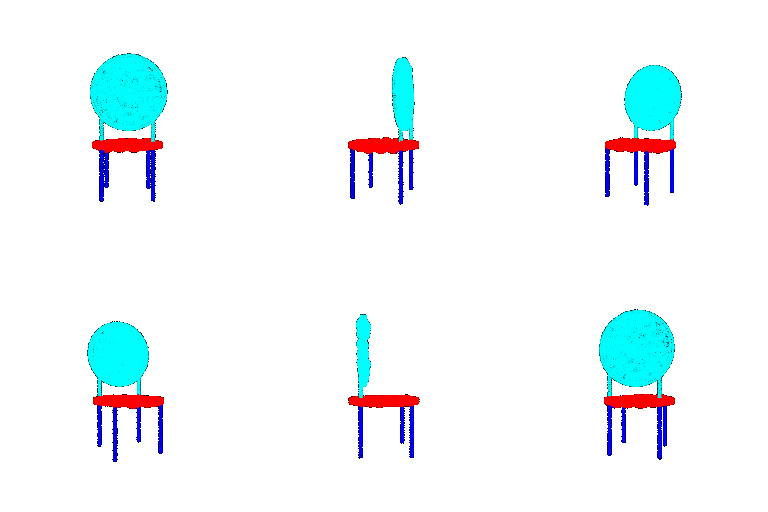 |
 |
99.79% |
| 505 | 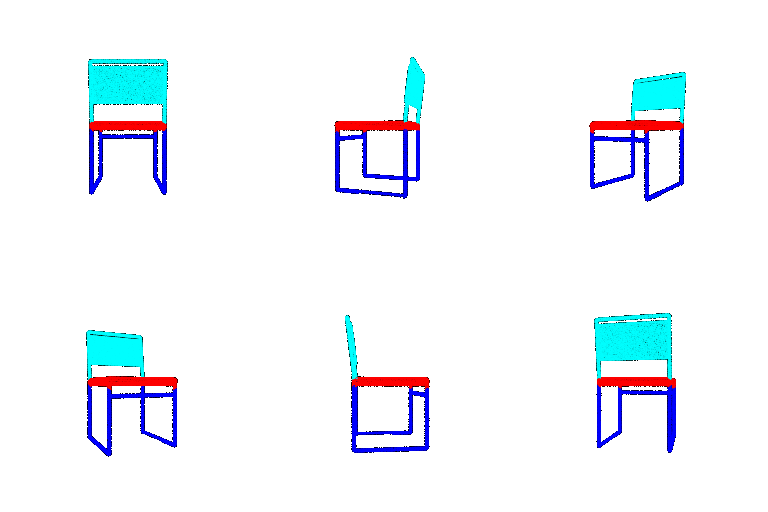 |
 |
99.31% |
| 562 | 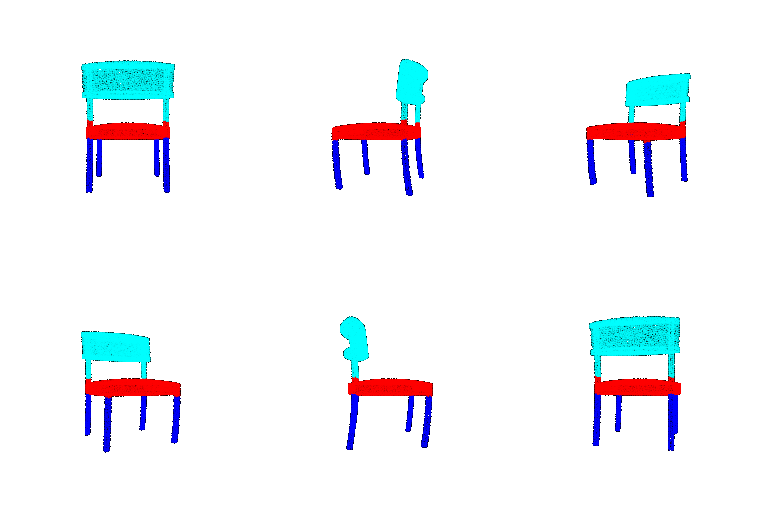 |
 |
99.41% |
| 351 (bad) |  |
 |
50.86% |
| 26 (bad) |  |
 |
47.15% |
| 235 (bad) |  |
 |
49.87% |
The four accurate examples have clearly separated backs, seats, and thin legs. The distinct shapes of these components help the model identify each part; therefore, the prediction accuracy is relatively high.
The three bad examples all contain bulky, closely connected parts with very few gaps between them. Their connected surfaces make the boundaries harder to identify solely from point positions.
Sample 351: The curved chair back and sides form a continuous outer shell. The model labels much of the lower shell as legs (blue), but the ground truth assigns these points to other labels. The model seems to rely too strongly on vertical point positions when the usual thin legs are absent.
Sample 26: The sofa-like chair has thick rectangular parts joined closely together. The prediction merges the distinct top into the back and extends the seat label across surrounding surfaces. This shows that there's difficulty for the model in separating adjacent blocks with similar geometry.
Sample 235: The seat, arms, and base form a box-like shape. The model assigns the seat label across a large region and confuses the boundaries between neighboring parts.
The independent variable is the rotation angle about the Y axis. The dependent variables are classification accuracy (the proportion of correctly classified objects) and segmentation point accuracy (the proportion of correctly labeled points averaged across the test set). I change the input orientation and measure how prediction accuracy changes.
I rotate the test point clouds about the Y axis in 45° steps over a full turn, evaluating 0°, 45°, ..., 315°. The 360° case is identical to 0° and is omitted. Both tasks use the saved best models and the same input size of 10,000 points per object.

Interpretation: At 135°, classification and segmentation accuracy fall from 97.80% and 90.29% to 30.75% and 52.25%. Both recover as the rotation approaches 360°, suggesting a dependence on the dataset's standard object alignment.
The same sample chair (index: 393) is shown at every tested angle. The images show a fixed camera view to illustrate the actual input orientation.
| Angle | Input point cloud | Ground-truth class | Predicted class |
|---|---|---|---|
| 0° |  |
Chair | Chair |
| 45° |  |
Chair | Chair |
| 90° |  |
Chair | Chair |
| 135° |  |
Chair | Lamp |
| 180° |  |
Chair | Lamp |
| 225° |  |
Chair | Vase |
| 270° |  |
Chair | Vase |
| 315° |  |
Chair | Chair |
Interpretation: Classification becomes less reliable as objects turn away from their original orientation and improves again near 360°. For example, chair 393 is classified as a lamp at 180°. This reversed orientation may be uncommon in the training data, and its broad back and narrow supports may be confused with a lamp’s shade and stand.
| Angle | Sample ID | Input point cloud | Ground Truth | Prediction | Object point prediction accuracy |
|---|---|---|---|---|---|
| 0° | 471 |  |
 |
 |
99.79% |
| 45° | 290 |  |
 |
 |
96.92% |
| 90° | 390 |  |
 |
 |
9.76% |
| 135° | 577 |  |
 |
 |
10.72% |
| 180° | 577 |  |
 |
 |
5.96% |
| 225° | 292 |  |
 |
 |
13.11% |
| 270° | 390 |  |
 |
 |
14.34% |
| 315° | 577 |  |
 |
 |
26.00% |
Interpretation: Rotation also disrupts part segmentation, with large regions receiving incorrect labels at unfamiliar orientations. For example, sample 577 has only 5.96% point accuracy at 180°, with much of its base labeled as legs. Its thick, connected surfaces offer few clear boundaries, making the model more likely to rely on familiar part positions.
The independent variable is the number of input points per object. The dependent variables are classification accuracy and segmentation point accuracy. I reduce the number of points from 10,000 to 50 and record how prediction accuracy changes.
I randomly sample 7,500, 5,000, 2,500, 1,000, 500, 100, and 50 points per object without replacement (using a fixed seed of 0). The segmentation point labels are also selected with the same point indices. Both tasks use the saved best PointNet models without retraining. The original 10,000-point results from Q1 and Q2 are used as the baseline.
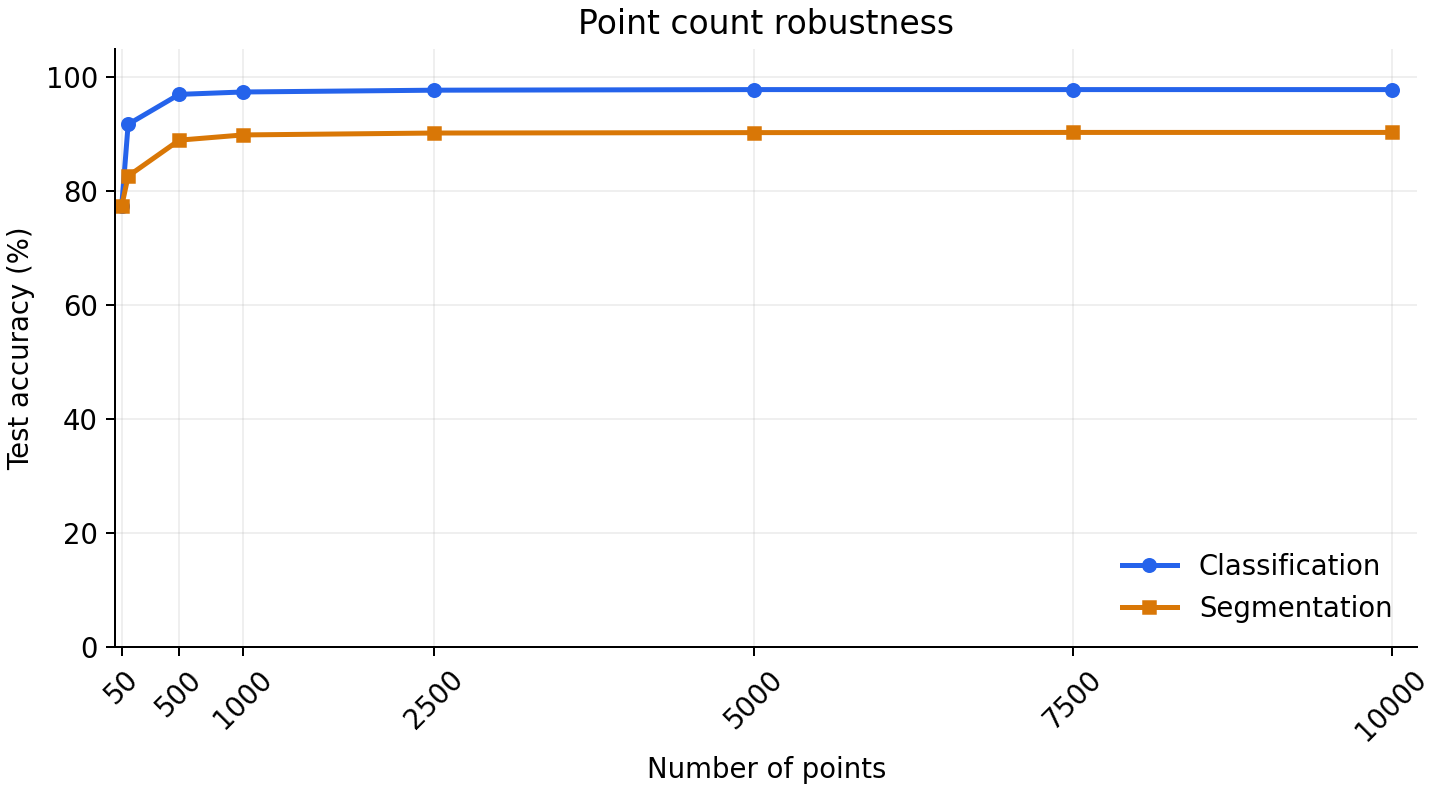
Interpretation: Reducing the input from 10,000 to 1,000 points has little effect on accuracy in either task. The points are randomly sampled without replacement, so the remaining points usually still describe the object's overall shape. When only a few points remain, details such as thin legs and armrests may be lost. This makes both classification and part segmentation more difficult. With 50 points, accuracy drops to about 77.4% for both tasks.
Sample 391 (Chair)
| Number of input points | Input point cloud | Ground-truth class | Predicted class |
|---|---|---|---|
| 10,000 |  |
Chair | Chair ✅ |
| 5,000 | 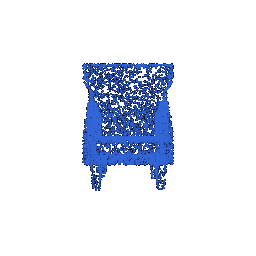 |
Chair | Chair ✅ |
| 1,000 |  |
Chair | Chair ✅ |
| 500 |  |
Chair | Chair ✅ |
| 100 |  |
Chair | Lamp ❌ |
| 50 |  |
Chair | Lamp ❌ |
Interpretation: The chair is still classified correctly at 1,000 and 500 points, but is predicted as a lamp at 100 and 50 points. Sparse sampling leaves fewer points describing the seat, supports, and their connections, so the remaining points may resemble a lamp more than a chair.
Sample 678 (Vase)
| Number of input points | Input point cloud | Ground-truth class | Predicted class |
|---|---|---|---|
| 10,000 |  |
Vase | Vase ✅ |
| 5,000 | 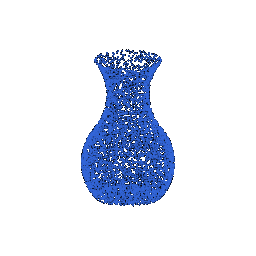 |
Vase | Vase ✅ |
| 1,000 |  |
Vase | Vase ✅ |
| 500 |  |
Vase | Vase ✅ |
| 100 |  |
Vase | Lamp ❌ |
| 50 |  |
Vase | Lamp ❌ |
Interpretation: The vase is recognized correctly down to 500 points, then predicted as a lamp at 100 and 50 points. With very few points, the fine details like the curve and the narrow neck become harder to distinguish from the outline of a lampshade.
Sample 42 (Chair)
| Number of input points | Input point cloud | Ground Truth | Prediction | Object accuracy |
|---|---|---|---|---|
| 10,000 |  |
 |
 |
99.12% |
| 5,000 | 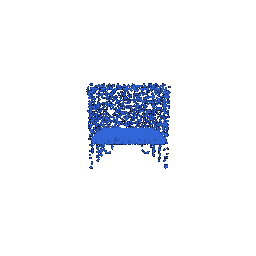 |
 |
 |
99.10% |
| 1,000 |  |
 |
 |
97.20% |
| 500 |  |
 |
 |
88.40% |
| 100 |  |
 |
 |
27.00% |
| 50 |  |
 |
 |
26.00% |
Interpretation: Point accuracy remains high at 1,000 points (97.20%), but drops to 27.00% at 100 points and 26.00% at 50 points. Many points on the lower region are incorrectly assigned to the seat part. This shows that sparse input provides less information about the connection of different regions.
Sample 471
| Number of input points | Input point cloud | Ground Truth | Prediction | Object accuracy |
|---|---|---|---|---|
| 10,000 |  |
 |
 |
99.79% |
| 5,000 |  |
 |
 |
99.68% |
| 1,000 |  |
 |
 |
99.60% |
| 500 |  |
 |
 |
95.80% |
| 100 |  |
 |
 |
89.00% |
| 50 |  |
 |
 |
66.00% |
Interpretation: The back, seat, and legs are segmented well at 1,000 points (99.60%), but the accuracy falls to 66.00% at 50 points. In particular, several seat points (red in the ground truth) are labeled as legs (blue). With so few points outlining the seat and the legs, the model has less context to separate these parts.
I use a single-scale PointNet++ model with Set Abstraction for downsampling and Feature Propagation for restoring per-point features.
Set Abstraction: This layer first uses farthest point sampling to select a smaller set of center points. It then collects nearby points within a given radius of each center. Each neighbor's coordinates are expressed relative to the center. These relative coordinates are then concatenated with any existing point features. Each group is processed by a small PointNet. Max pooling then produces one feature vector for each center. The next layer repeats these steps on the centers and their features. The final layer pools all remaining points into one global feature.
Feature Propagation: For segmentation, the model needs a feature for every original point. The layer finds the three nearest coarse points for each target point and takes a distance-weighted average of their features. The result is concatenated with the target point's feature saved during encoding. The concatenated features are passed through a shared MLP to produce an updated feature for each target point. If only one global feature is available, it is copied to every target point. The model repeats these steps until every input point has a feature. The point coordinates are kept unchanged.
Classification model: Three Set Abstraction layers produce a global feature, followed by a fully connected classifier.
| Layer | Output points (centers) | Radius | Max neighbors | MLP / FC channels |
|---|---|---|---|---|
| Set Abstraction 1 | 512 | 0.2 | 32 | 3 → 64 → 64 → 128 |
| Set Abstraction 2 | 128 | 0.4 | 64 | 131 → 128 → 128 → 256 |
| Set Abstraction 3 | 1 (global) | — | All | 259 → 256 → 512 → 1024 |
| Classifier | — | — | — | 1024 → 512 → 256 → 3 |
Segmentation model: The same encoder is followed by three Feature Propagation layers and a pointwise classifier for six part labels.
| Layer | Output points | Radius | Max neighbors | MLP channels |
|---|---|---|---|---|
| Set Abstraction 1 | 512 | 0.2 | 64 | 3 → 64 → 64 → 128 |
| Set Abstraction 2 | 128 | 0.4 | 64 | 131 → 128 → 128 → 256 |
| Set Abstraction 3 | 1 (global) | — | All | 259 → 256 → 512 → 1024 |
| Feature Propagation 3 | 128 | — | — | (256 + 1024) → 256 → 256 |
| Feature Propagation 2 | 512 | — | — | (128 + 256) → 256 → 128 |
| Feature Propagation 1 | 10,000 | — | — | (3 + 128) → 128 → 128 → 128 |
| Pointwise classifier | 10,000 | — | — | 128 → 128 → 6 |
Layer parameters follow the author's implementations. I omitted the Dropout layer in my model.
| Model | Classification accuracy | Segmentation point accuracy |
|---|---|---|
| PointNet (Q1/Q2) | 97.80% | 90.29% |
| PointNet++ | 97.90% | 89.60% |
PointNet++ slightly improves classification accuracy but has lower segmentation point accuracy in this evaluation.
Classification
| Sample ID | Ground-truth class | PointNet | PointNet prediction | PointNet++ | PointNet++ prediction |
|---|---|---|---|---|---|
| 618 | Vase |  |
Lamp ❌ | 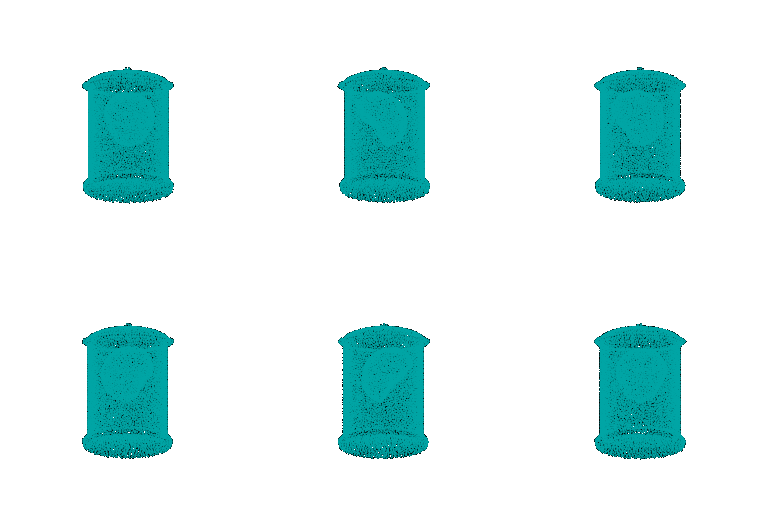 |
Vase ✅ |
| 916 | Lamp |  |
Vase ❌ |  |
Lamp ✅ |
| 189 | Chair |  |
Chair ✅ |  |
Chair ✅ |
PointNet++ corrects some failure cases observed in Q1: vase 618 and lamp 916. Local neighborhoods may help distinguish the vase's rim and body, and the lamp's stand, beyond their similar overall 3D shapes. Both models correctly classify chair 189, whose back, seat, and legs are clearly defined.
Segmentation
| Sample ID | Ground Truth | PointNet | Point accuracy | PointNet++ | Point accuracy |
|---|---|---|---|---|---|
| 351 |  |
 |
50.86% |  |
57.49% |
| 297 |  |
 |
99.51% |  |
99.21% |
For the difficult chair 351 from Q2, PointNet++ improves point accuracy by 6.63 percentage points, but many points are still mislabeled. Local features help to some degree on this example, although they do not resolve the ambiguity of its closely connected parts.
Both models segment chair 297 well. Its back, seat, and legs have distinct boundaries, so both models can separate these parts accurately.