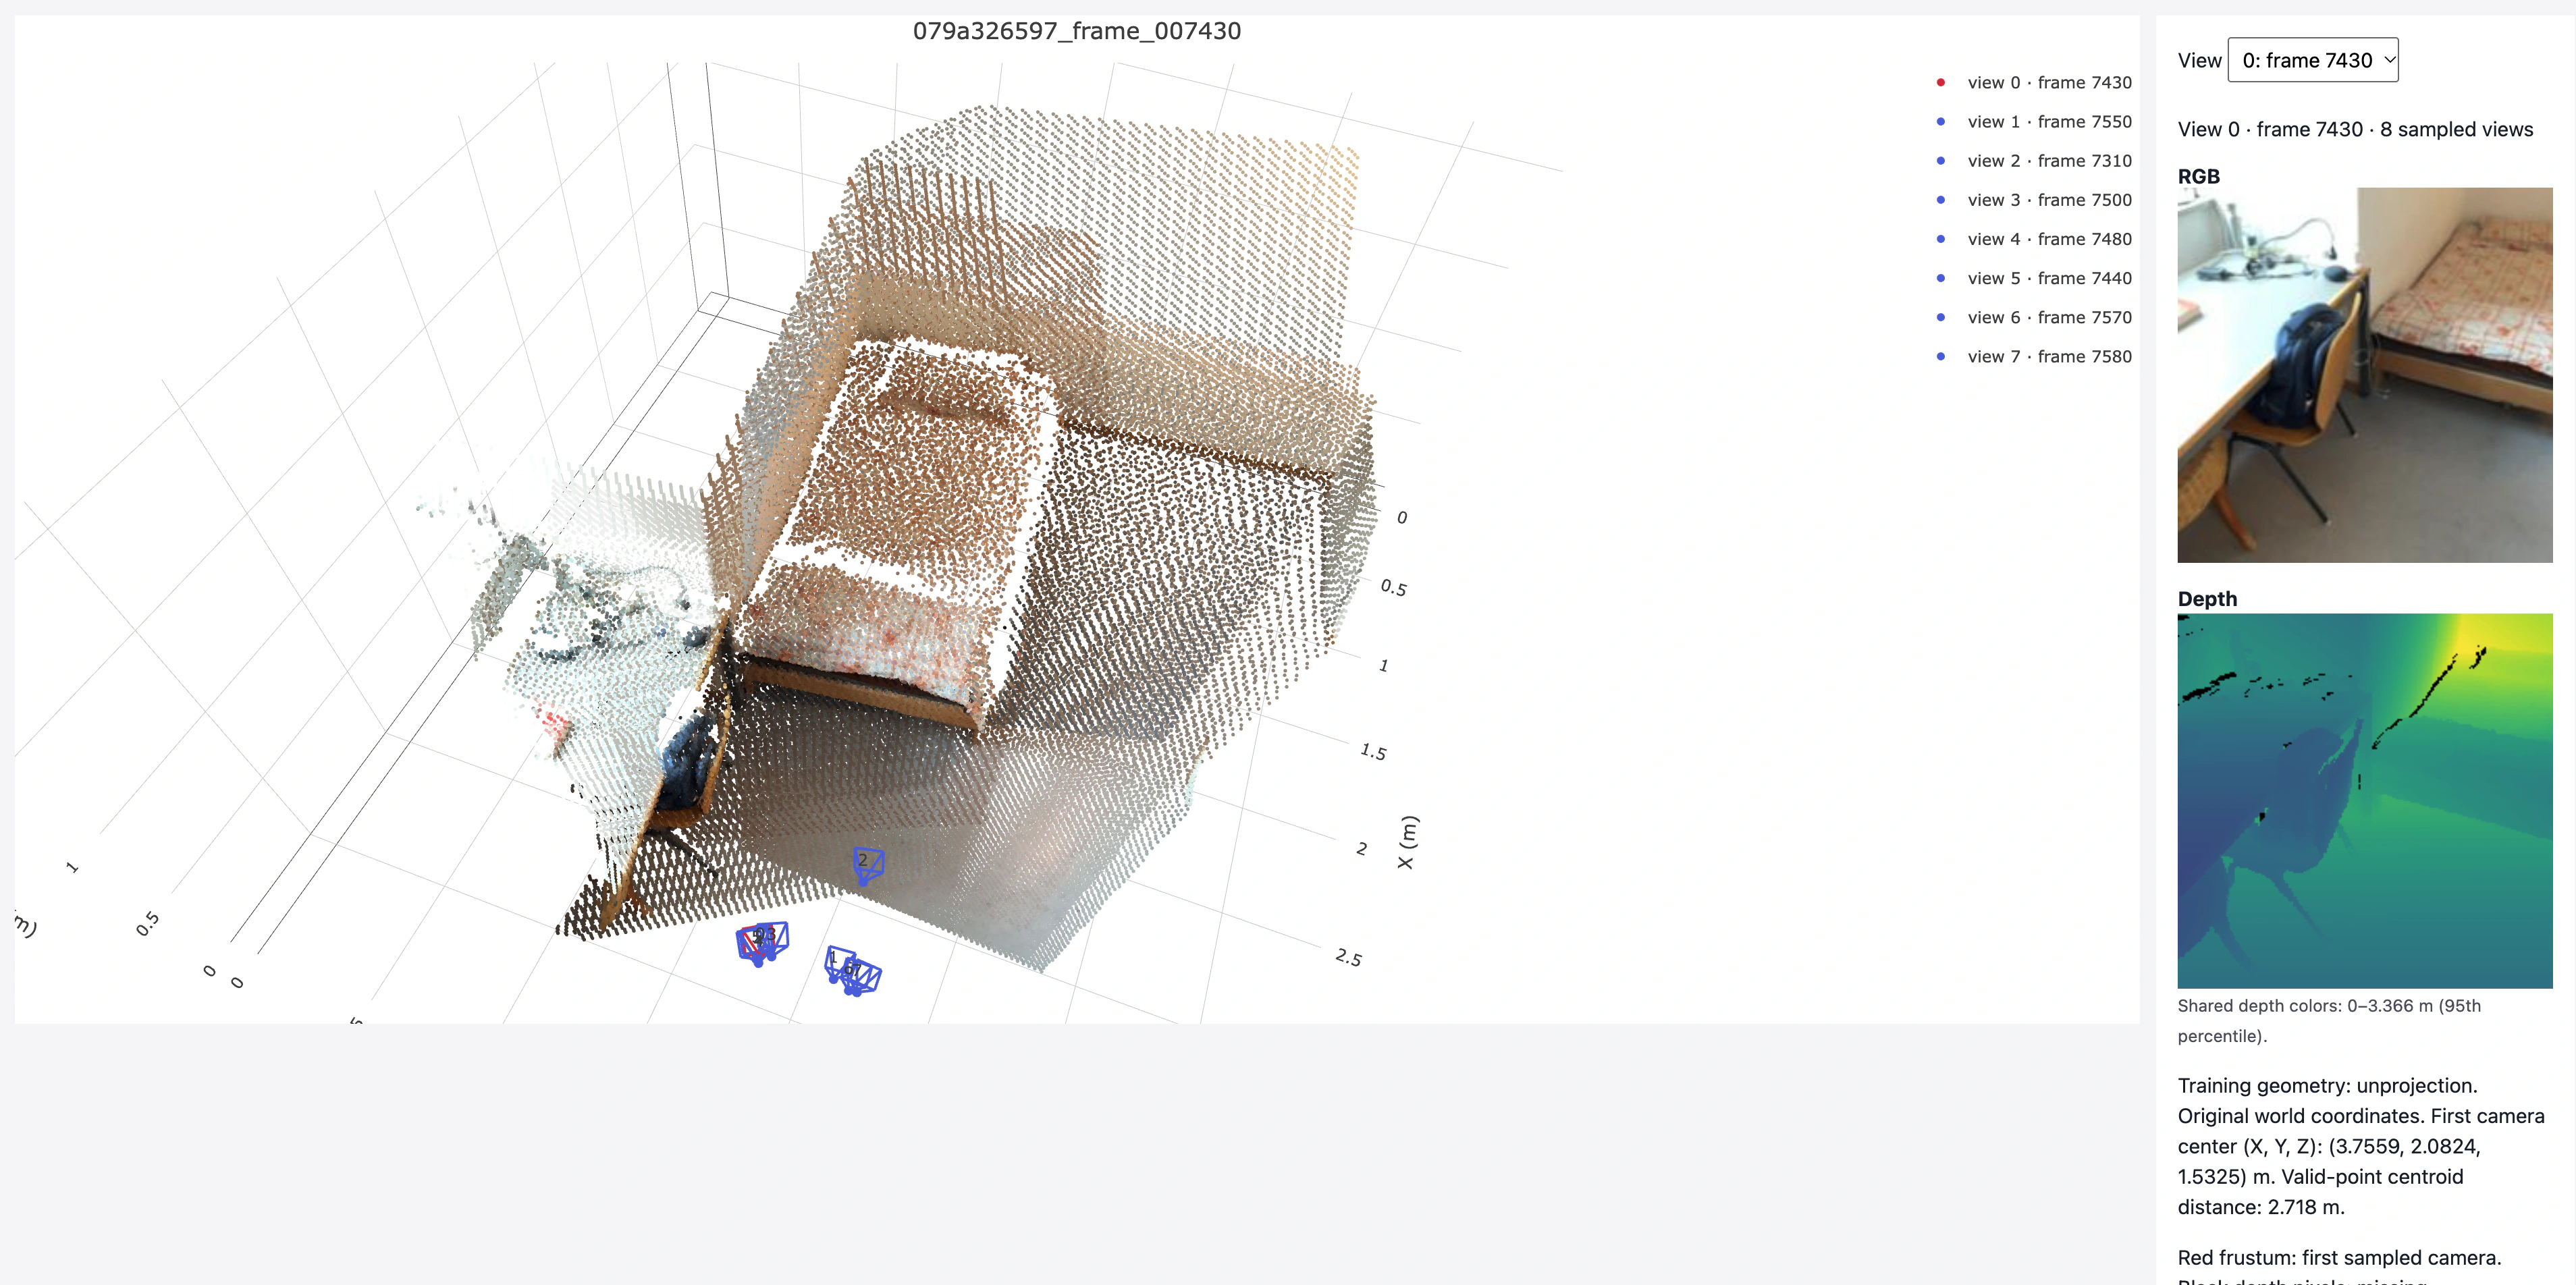
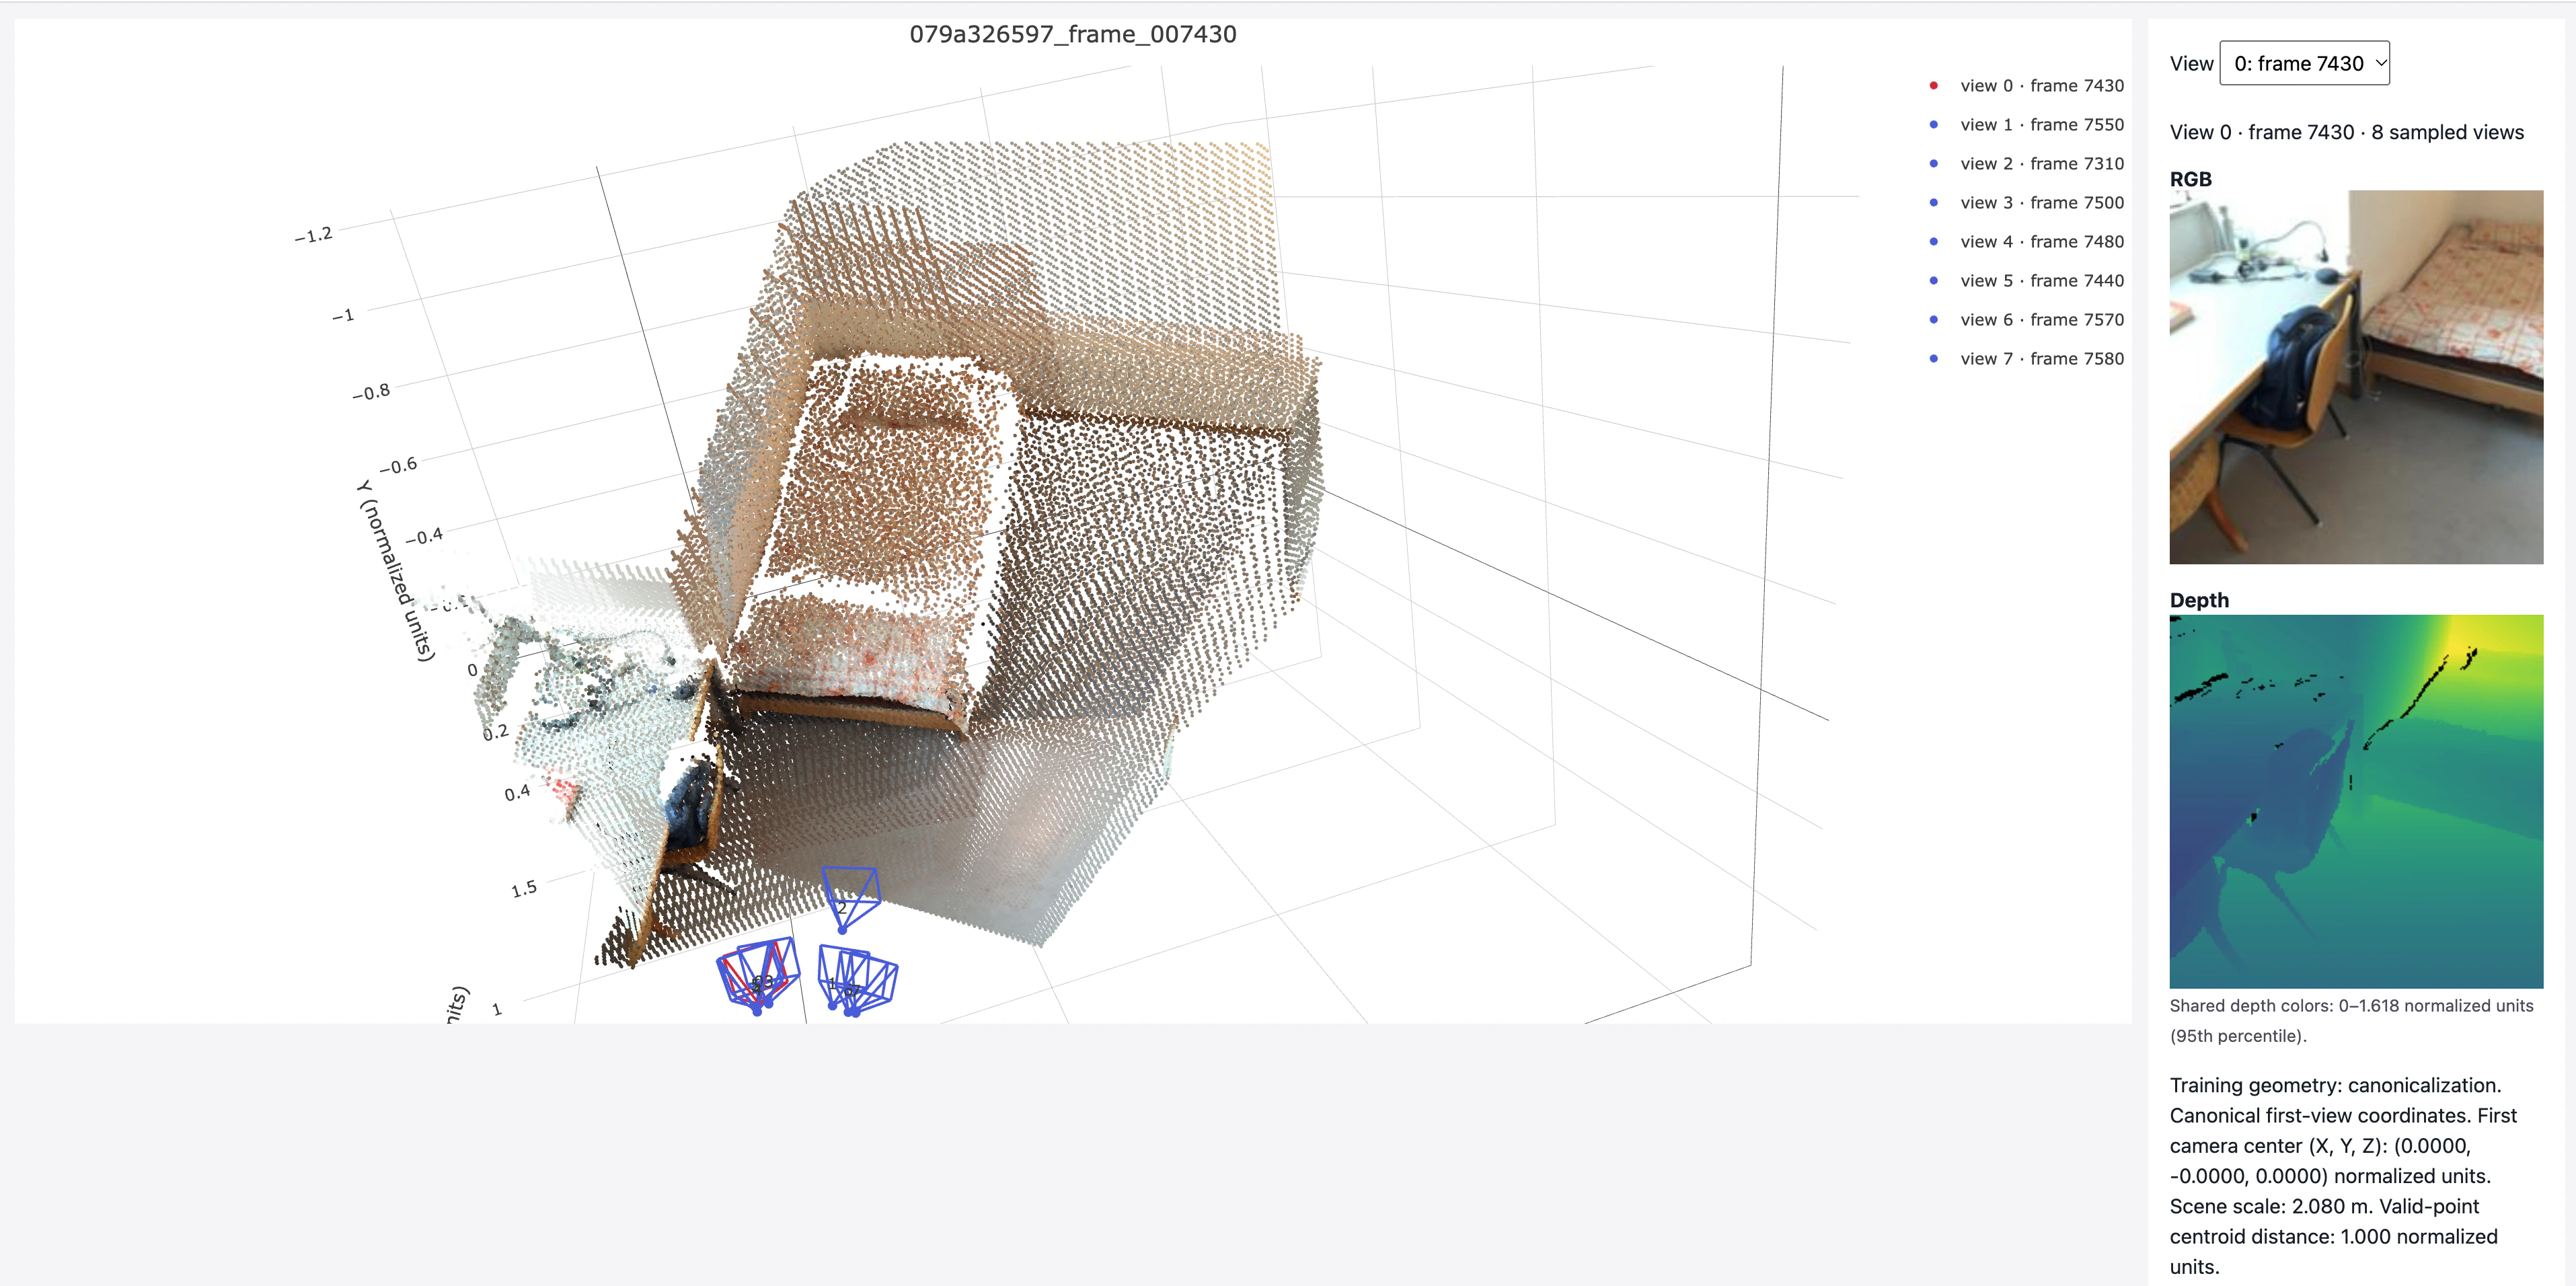
The following results show the same sampled views after unprojection and canonicalization.
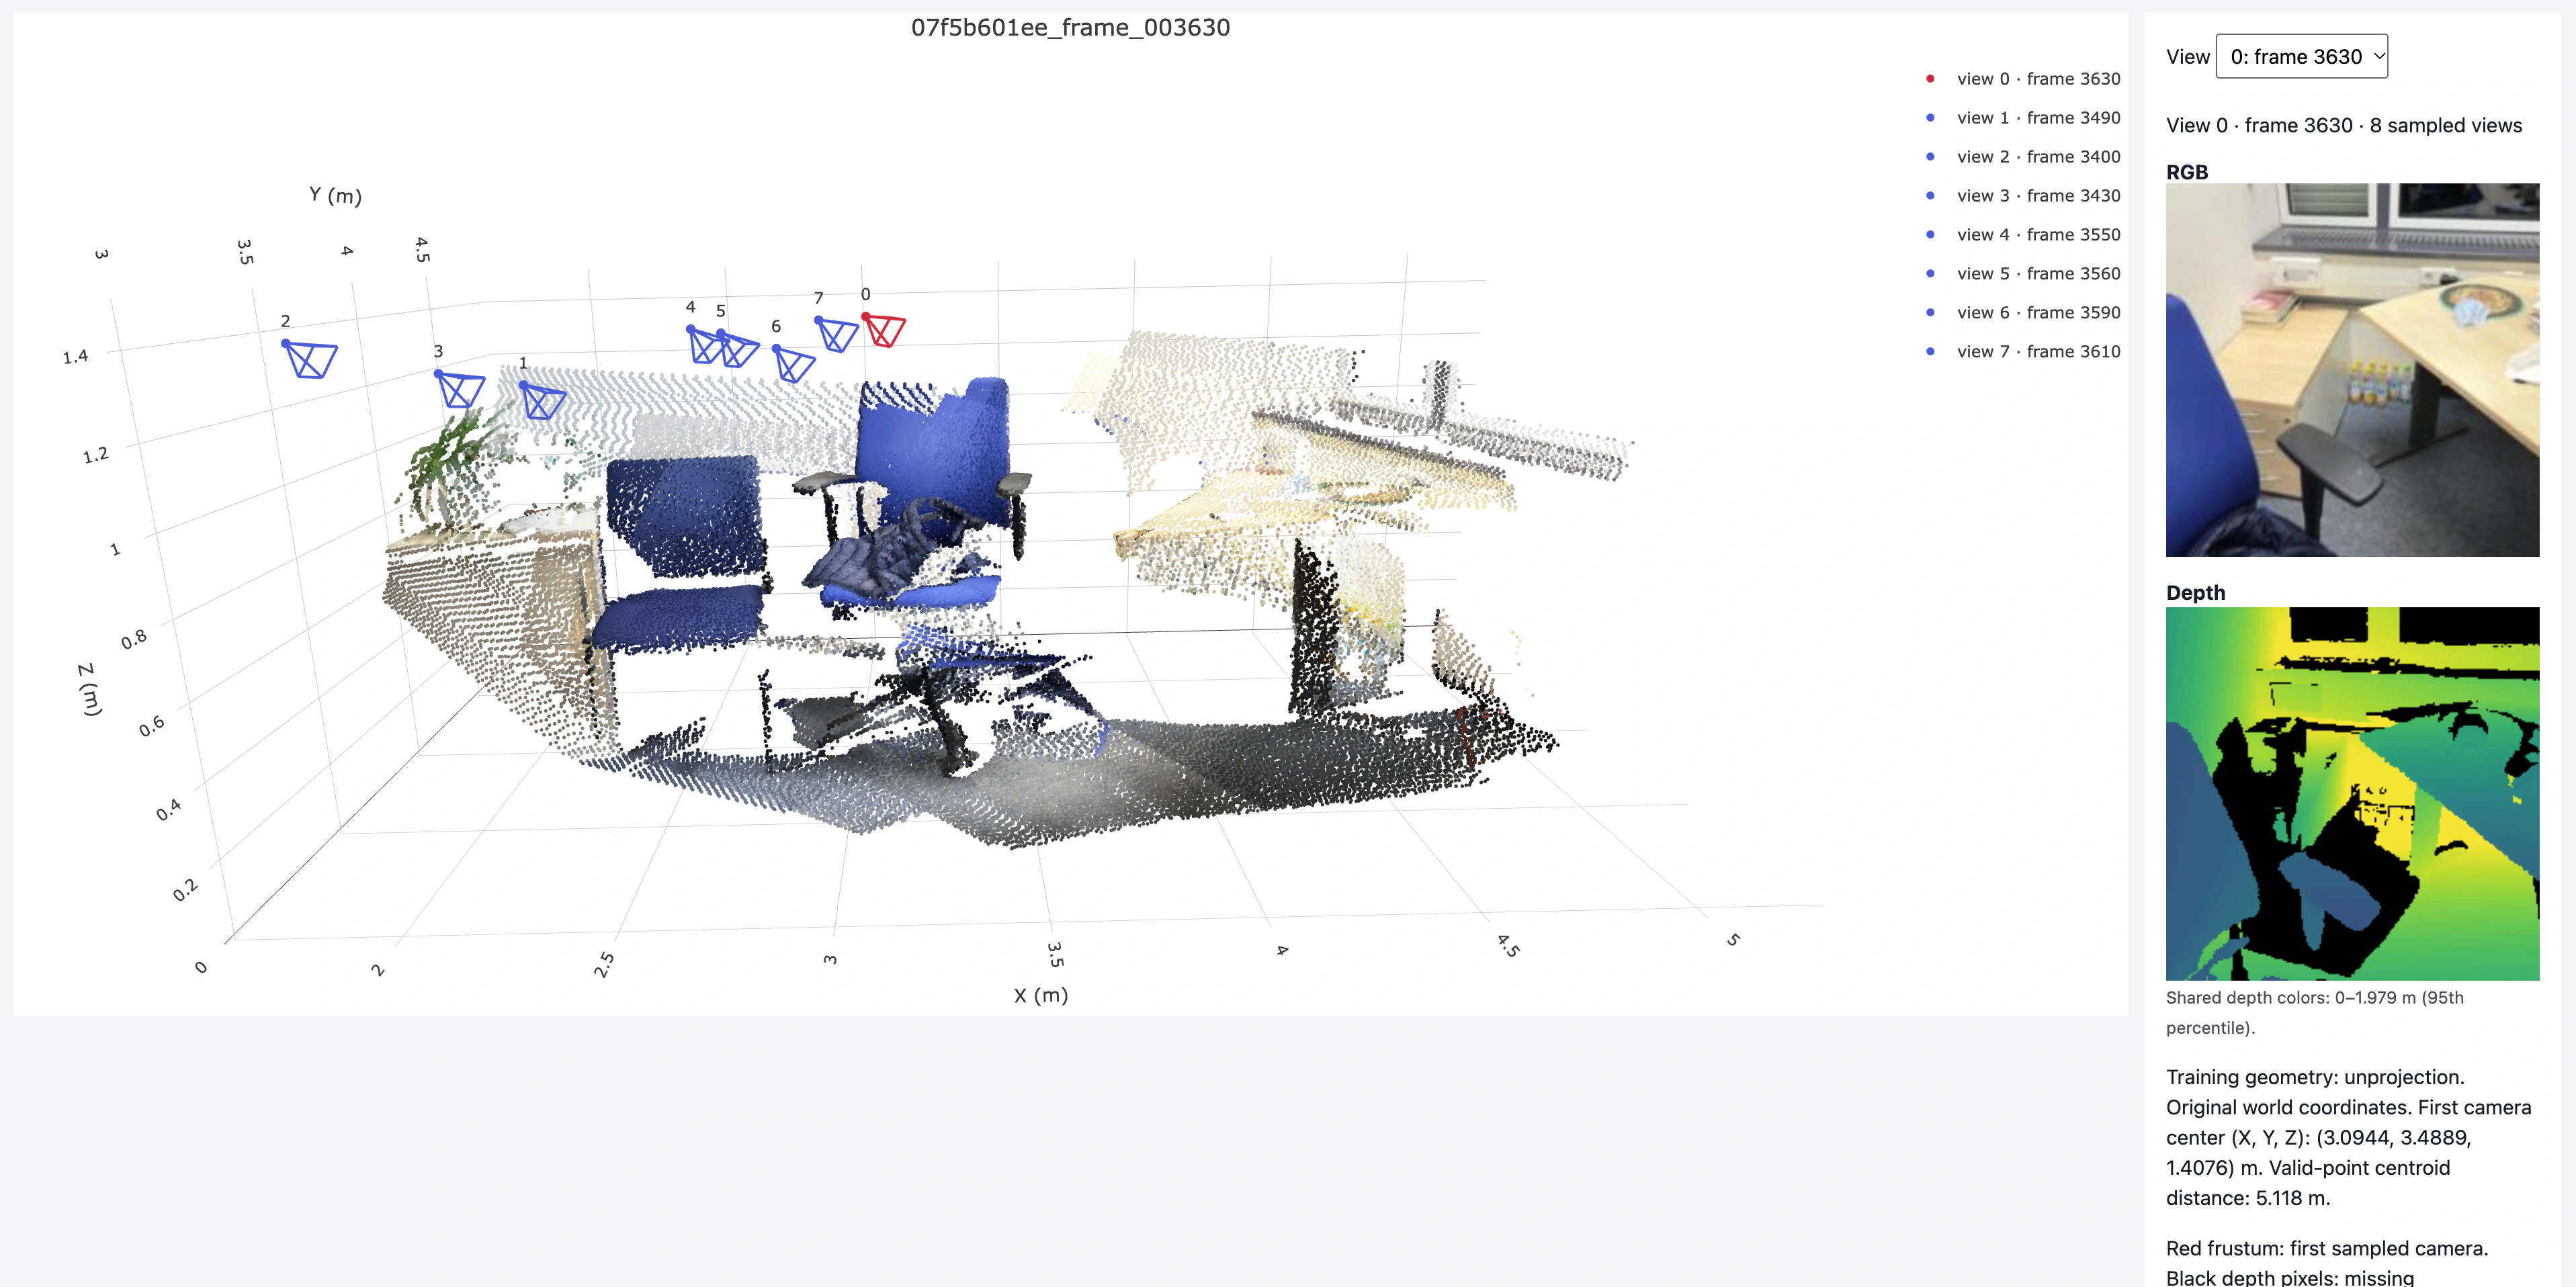
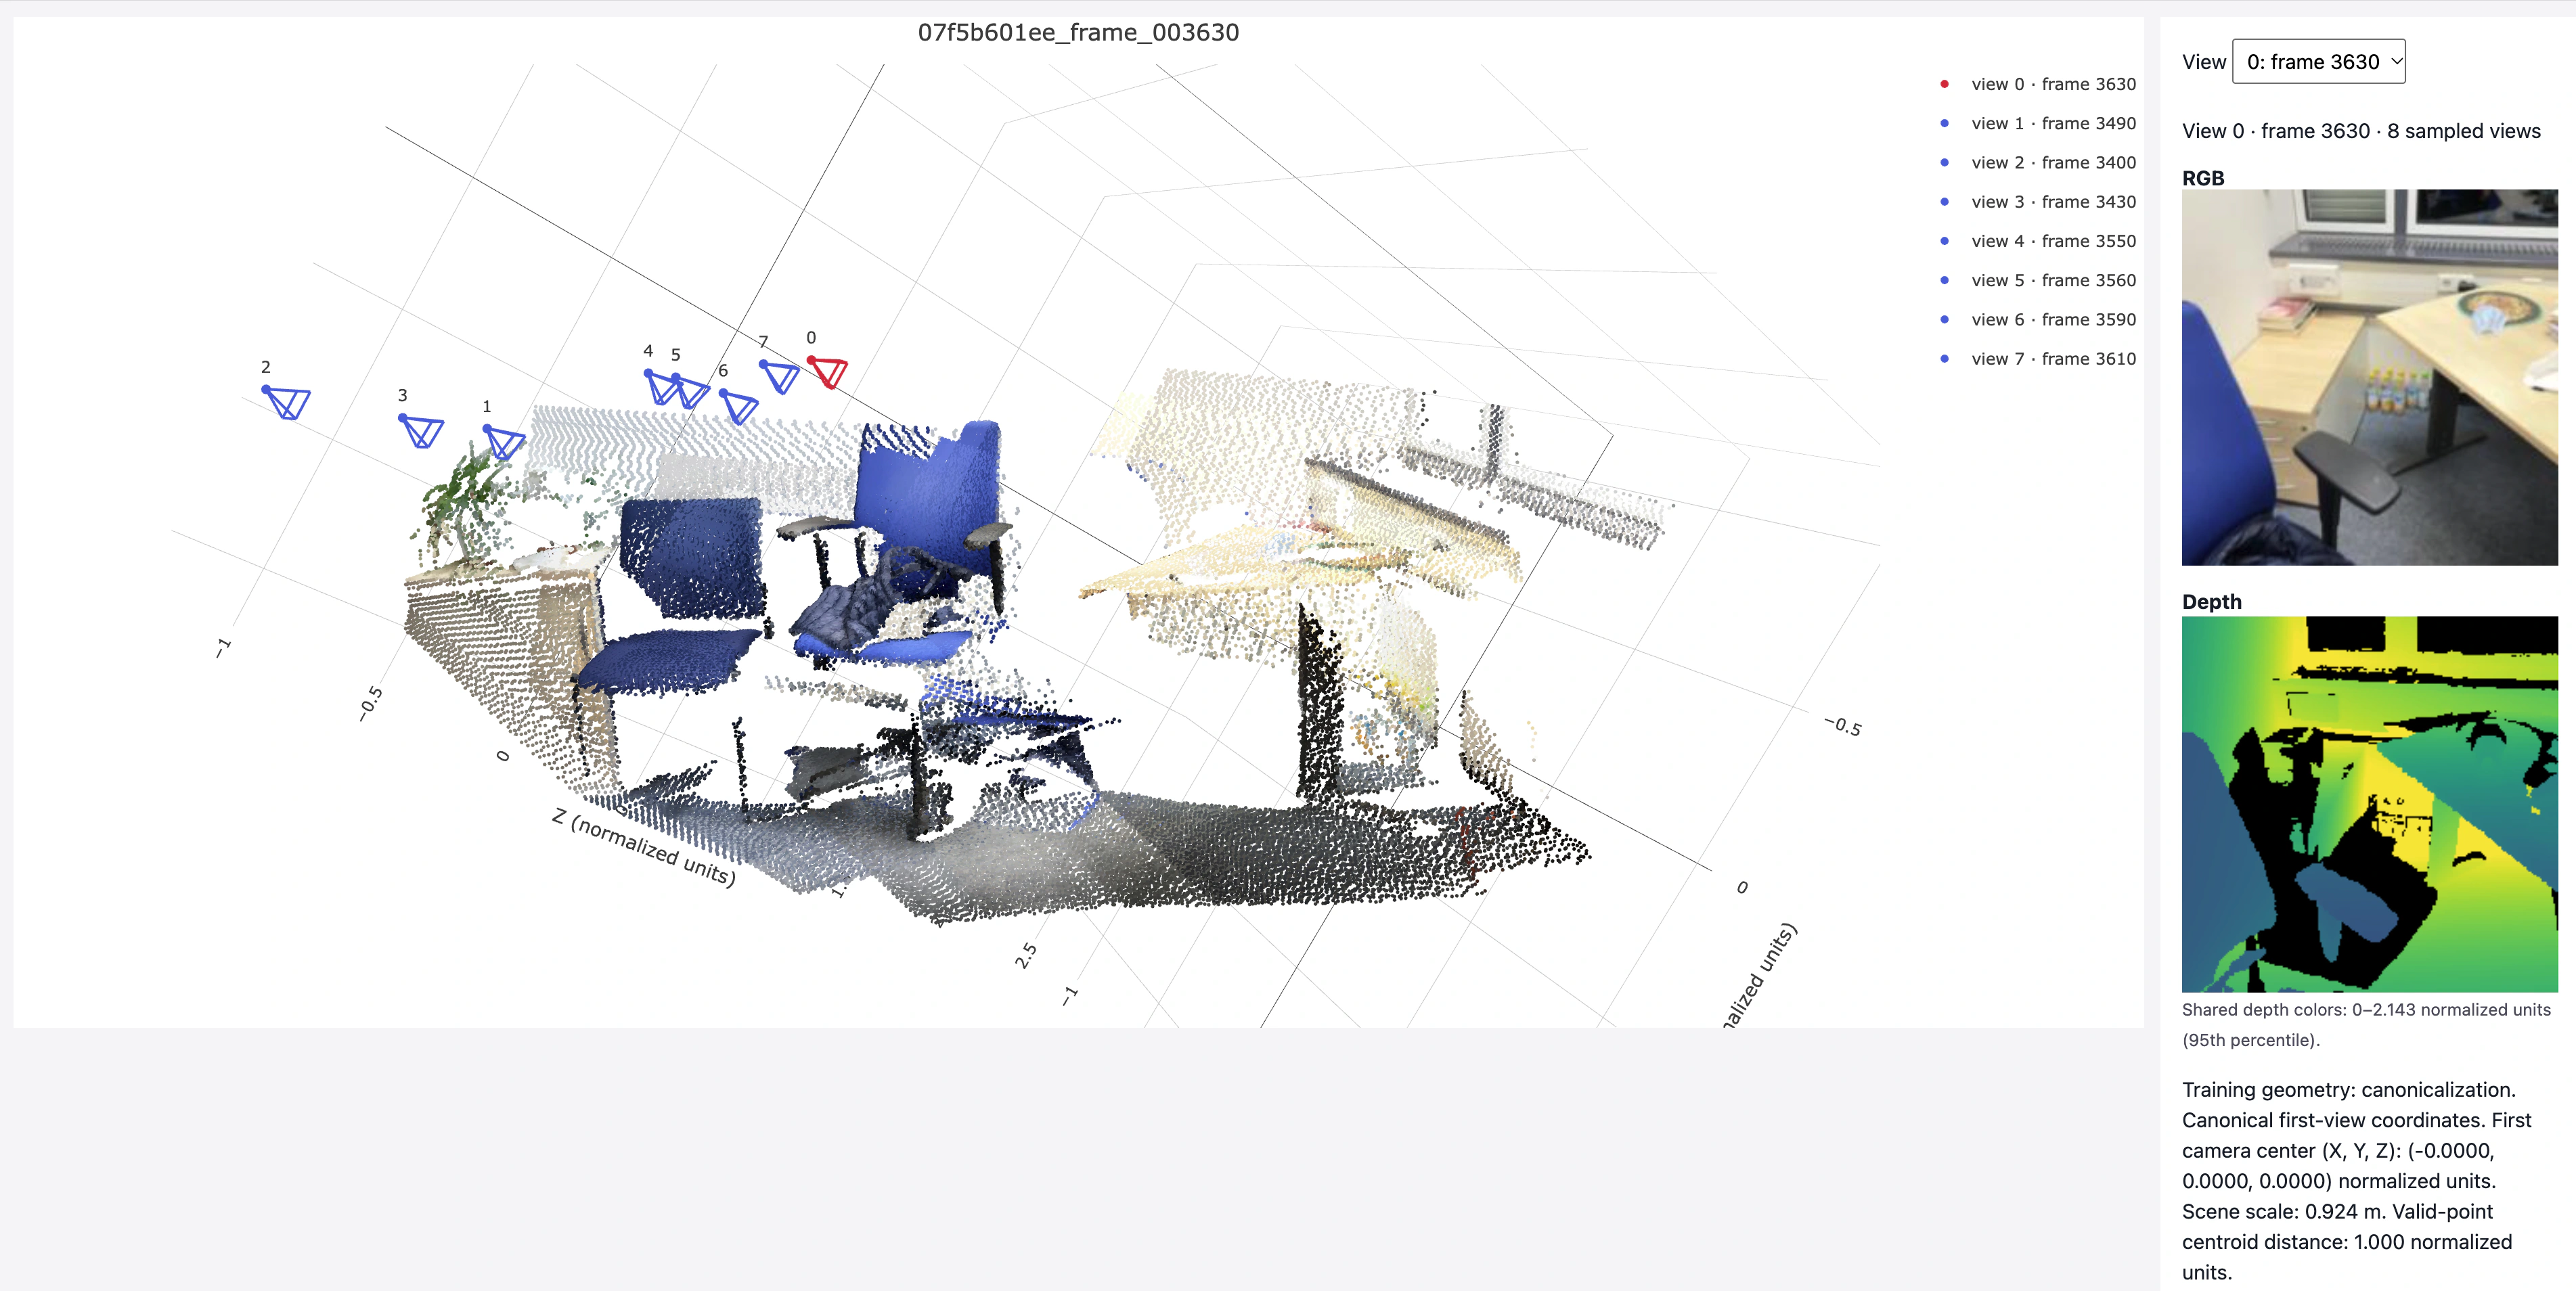
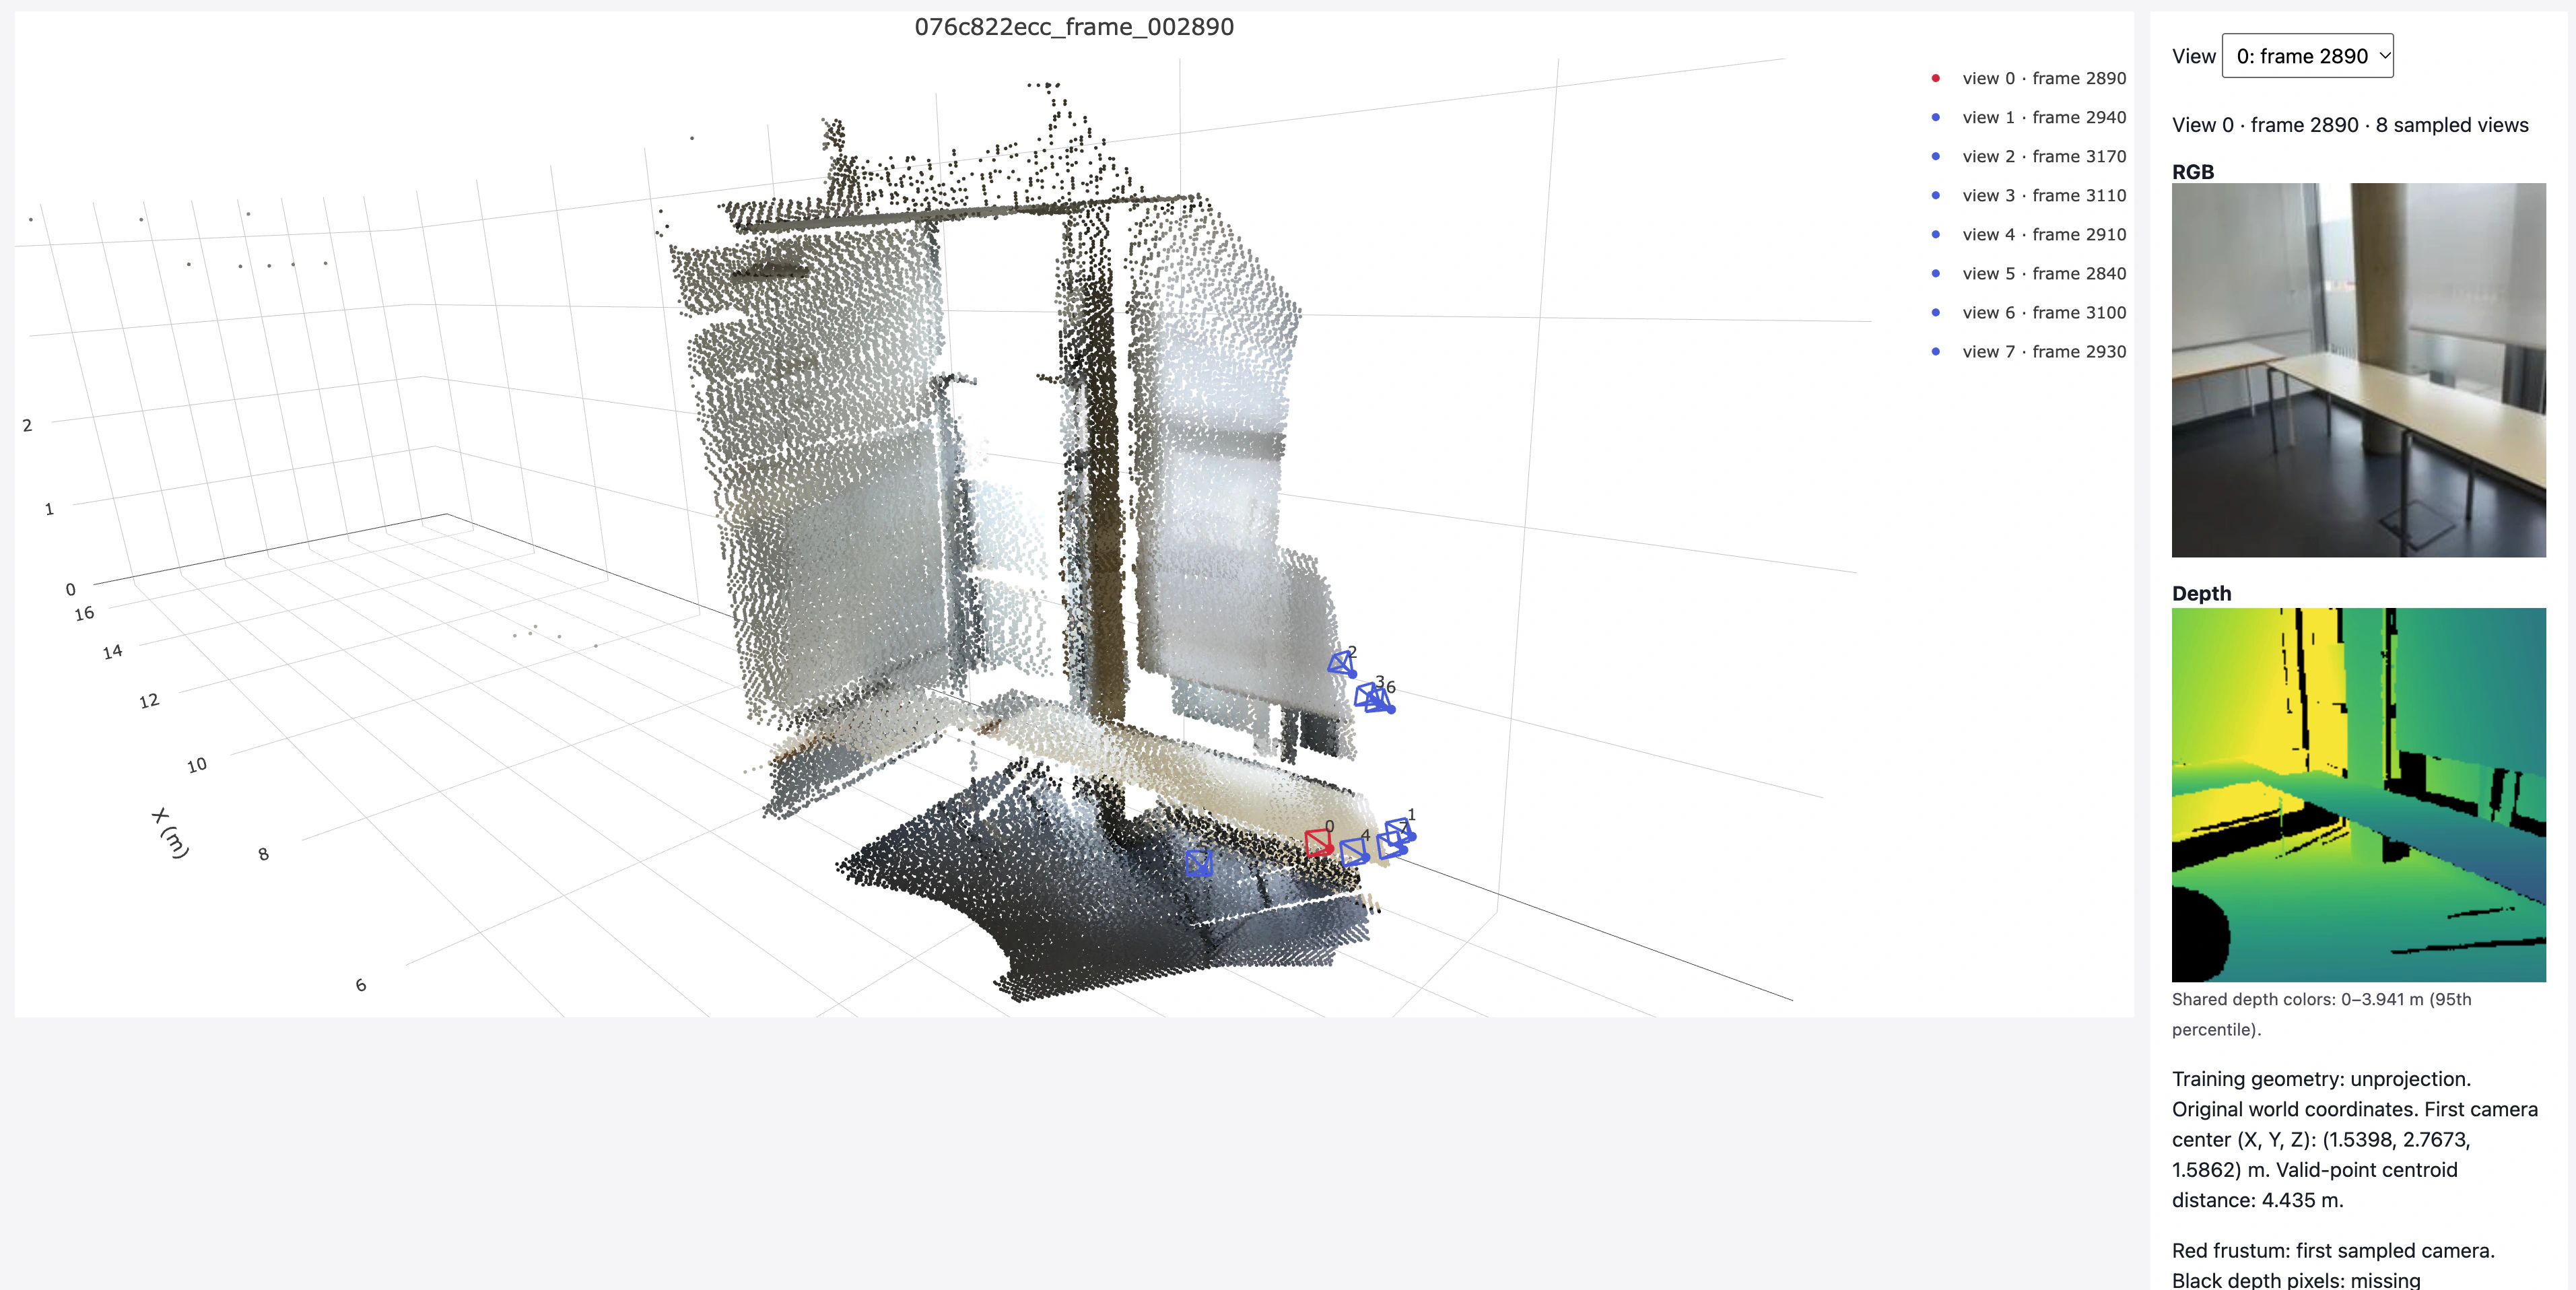
The first sampled camera is shown in red.
Each screenshot of the canonicalization visualization includes the first camera center and the valid-point centroid distance in the sidebar; all three centers are approximately (0, 0, 0) and all three centroid distances are 1.000.
079a326597_frame_007430Unprojection (original world coordinates, m)
Canonicalization (first-camera coordinates, normalized units)
07f5b601ee_frame_003630Unprojection (original world coordinates, m)
Canonicalization (first-camera coordinates, normalized units)
076c822ecc_frame_002890Unprojection (original world coordinates, m)
Canonicalization (first-camera coordinates, normalized units)
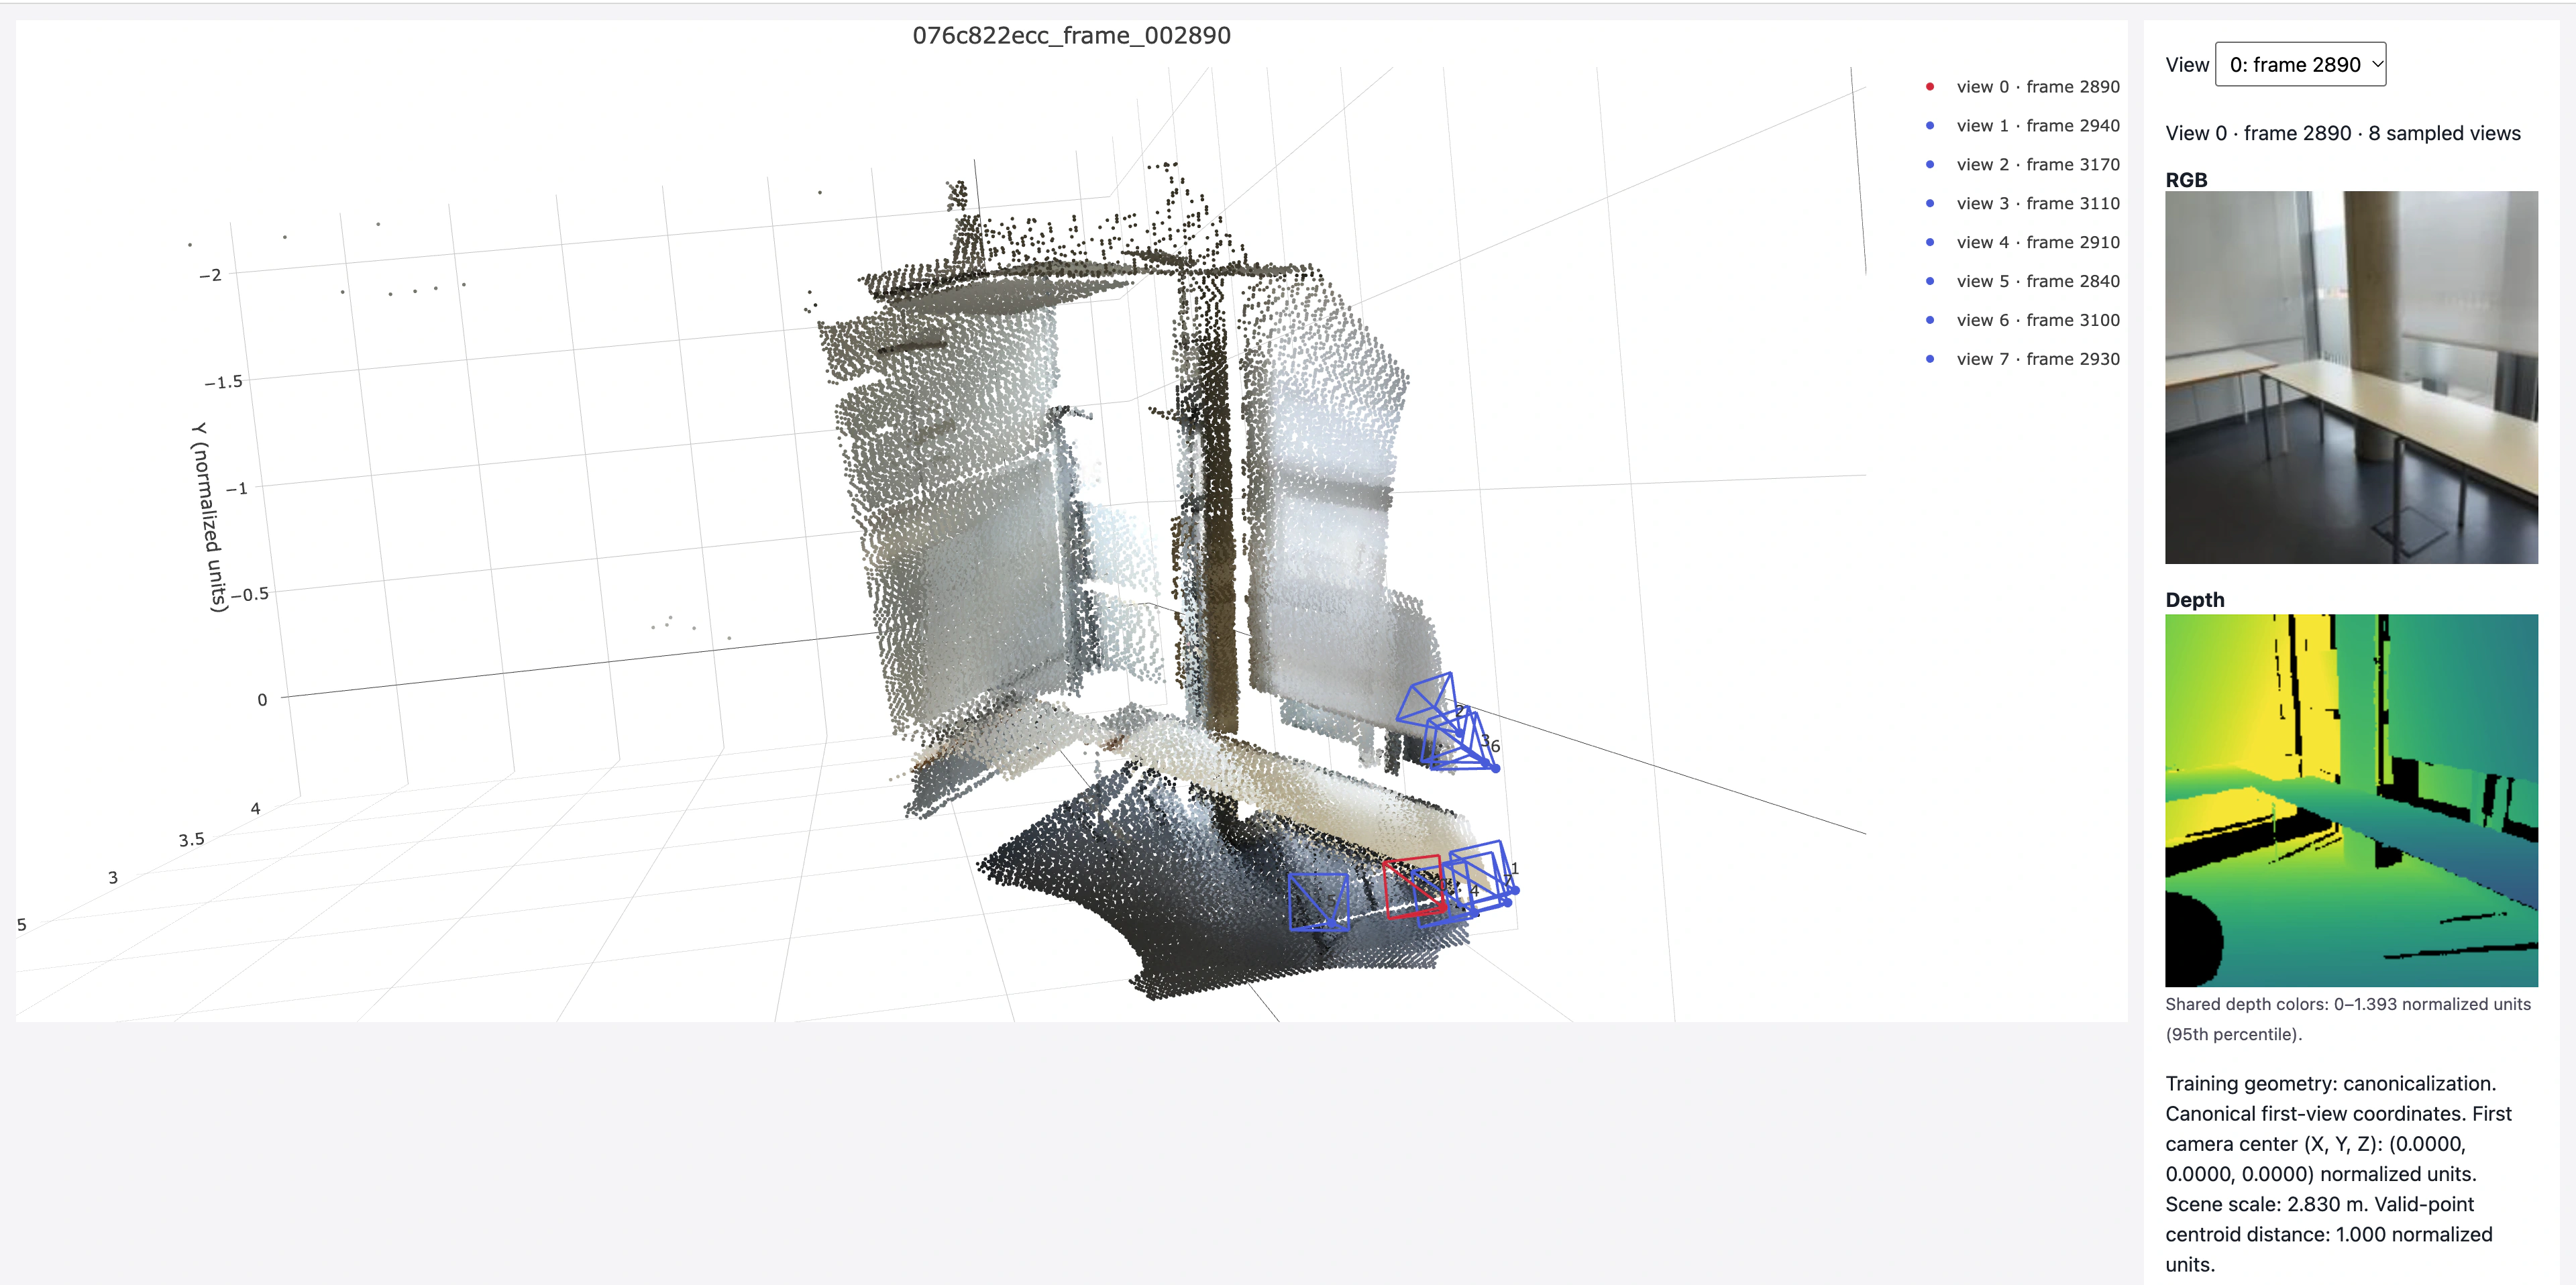
Click any screenshot to view its numerical annotations at full resolution. Missing regions and scattered points reflect incomplete or noisy input depth.
python scripts/check_data.py --config configs/scannetpp/iphone/data.json --split train --max-samples 4
Across the four checked samples, the reported tensor shapes match the data contract, the maximum point and ray reprojection errors are approximately 0.000111 pixels (< 0.01 pixels), and the valid-point centroid distances are approximately 1.0,
{
  "split": "train",
  "dataset_samples": 224,
  "checked_samples": 4,
  "samples": [
    {
      "sequence_name": "e050c15a8d_frame_007080",
      "views": 8,
      "resolution": 224,
      "valid_depth_fraction": 0.9779127240180969,
      "max_reprojection_error_px": 0.00011009880108758807,
      "max_ray_reprojection_error_px": 9.41436446737498e-05,
      "centroid_distance": 1.0
    },
    {
      "sequence_name": "5f99900f09_frame_002820",
      "views": 8,
      "resolution": 224,
      "valid_depth_fraction": 0.9903116226196289,
      "max_reprojection_error_px": 0.00011108566104667261,
      "max_ray_reprojection_error_px": 0.00011108566104667261,
      "centroid_distance": 0.9999999403953552
    },
    {
      "sequence_name": "47b37eb6f9_frame_002720",
      "views": 8,
      "resolution": 224,
      "valid_depth_fraction": 0.9609947800636292,
      "max_reprojection_error_px": 9.351845073979348e-05,
      "max_ray_reprojection_error_px": 8.897326188161969e-05,
      "centroid_distance": 1.0
    },
    {
      "sequence_name": "4c5c60fa76_frame_006690",
      "views": 8,
      "resolution": 224,
      "valid_depth_fraction": 0.7516716122627258,
      "max_reprojection_error_px": 0.00010400763130746782,
      "max_ray_reprojection_error_px": 9.423537994734943e-05,
      "centroid_distance": 1.0
    }
  ],
  "batch_shapes": {
    "rgb": [
      2,
      8,
      3,
      224,
      224
    ],
    "depth": [
      2,
      8,
      1,
      224,
      224
    ],
    "depth_valid": [
      2,
      8,
      1,
      224,
      224
    ],
    "K": [
      2,
      8,
      3,
      3
    ],
    "frame_numbers": [
      2,
      8
    ],
    "T_world_from_camera": [
      2,
      8,
      4,
      4
    ],
    "original_world_from_reference": [
      2,
      4,
      4
    ],
    "scene_scale": [
      2
    ],
    "points_world": [
      2,
      8,
      3,
      224,
      224
    ],
    "ray_origins": [
      2,
      8,
      3,
      224,
      224
    ],
    "ray_directions": [
      2,
      8,
      3,
      224,
      224
    ],
    "plucker": [
      2,
      8,
      6,
      224,
      224
    ]
  }
}
Canonicalization is the transformation of multi-view geometry into the first camera's coordinate frame (The first camera has the identity pose). A shared scale makes the valid-point centroid distance equal to 1.
World-space ray direction is the unit ray direction (unit vector pointing from a camera center through a pixel), expressed in the world coordinate frame. It is computed as d = normalize(R @ inverse(K) @ [u, v, 1]).
Plücker moment is the vector m = o × d, where o is the world-space ray origin in canonical units and d is the unit world-space ray direction. Together, [d, m] encodes the oriented line’s direction and position.
The final overfit PSNR was 30.89 dB , which reaches about 30 dB or more.

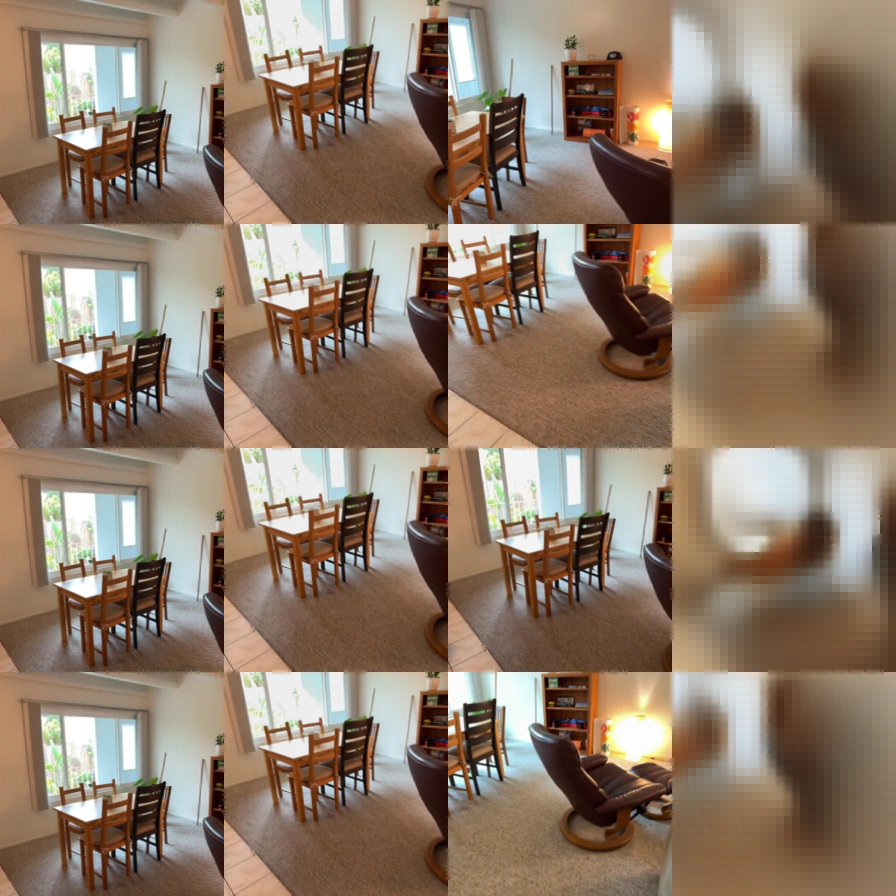
Each row shows (from left to right): two source views, the ground-truth target, and the prediction.
Mini-LVSM Training settings.
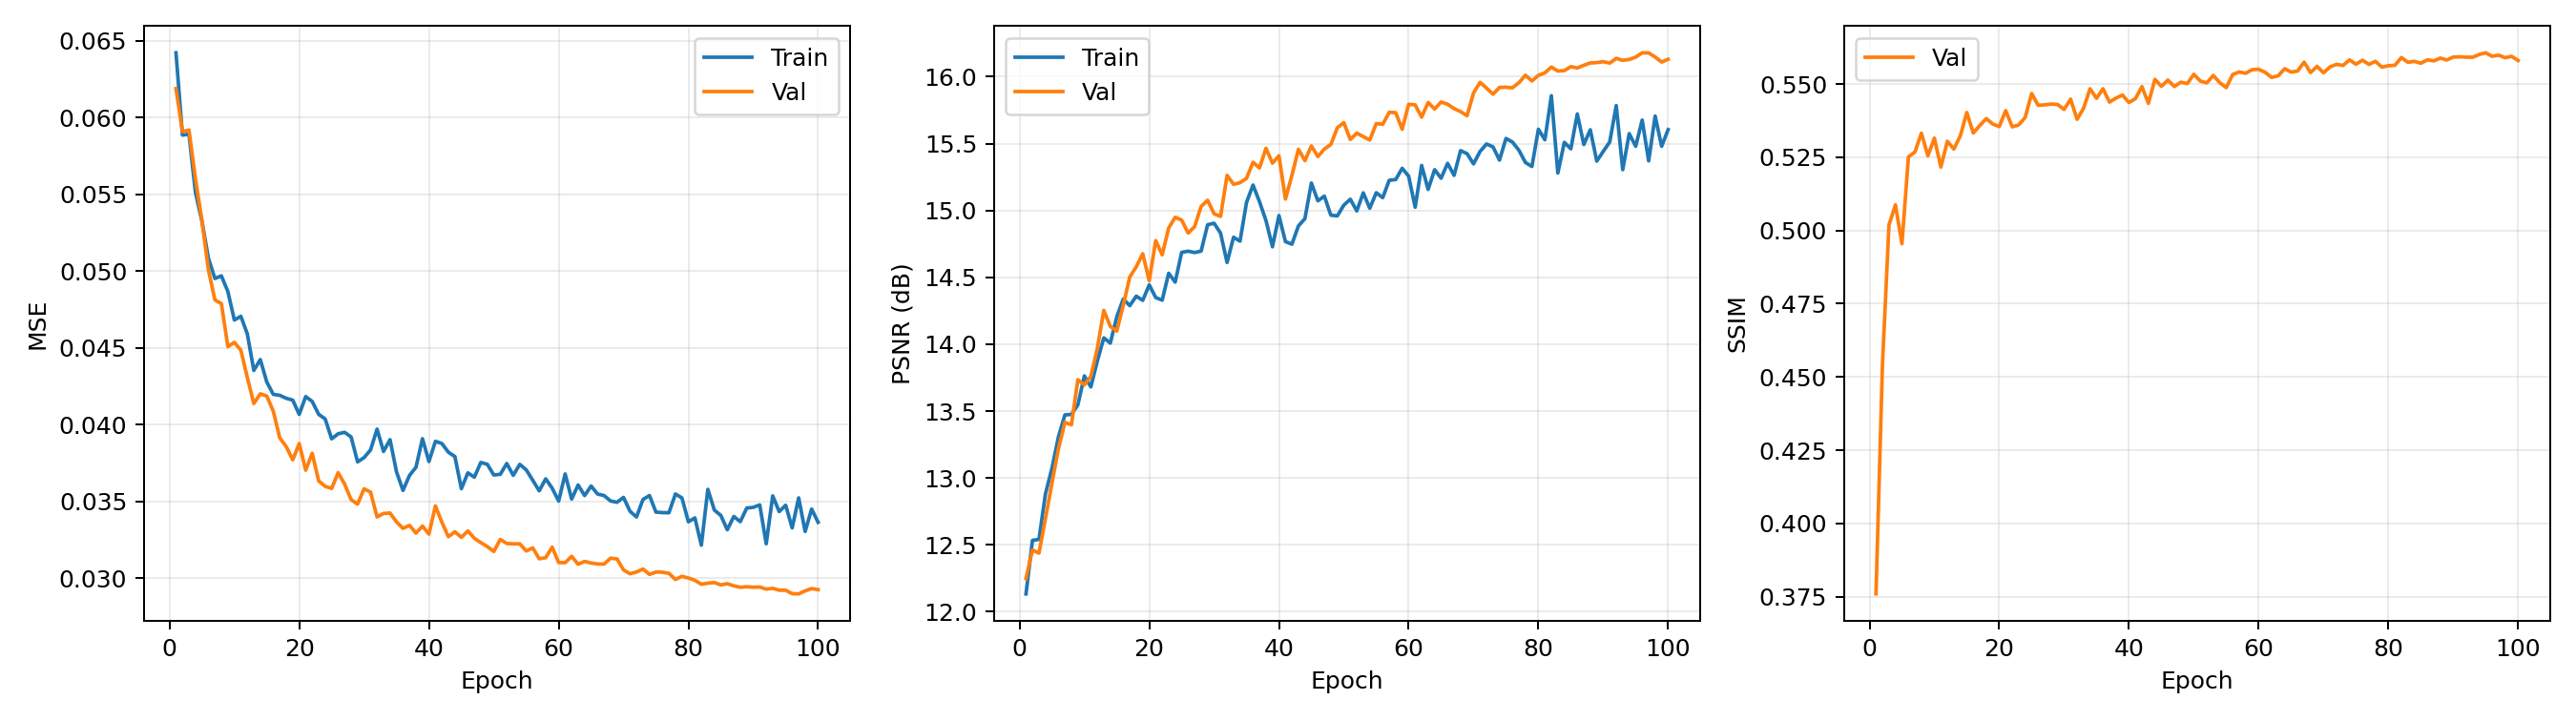
Training curves
Validation ablations
All settings below use the same best checkpoint which is saved at epoch 95 (counted from epoch 0)
| Number of source views | Target-ray conditioning | PSNR (dB) | SSIM | Target images |
|---|---|---|---|---|
| 1 | correct | 15.2192 | 0.5573 | 196 |
| 1 | shuffled | 11.7826 | 0.4862 | 196 |
| 1 | none | 12.4361 | 0.5287 | 196 |
| 2 | correct | 16.1787 | 0.5594 | 168 |
| 2 | shuffled | 11.4341 | 0.4707 | 168 |
| 2 | none | 12.4098 | 0.5257 | 168 |
| 4 | correct | 16.8570 | 0.5737 | 112 |
| 4 | shuffled | 11.5636 | 0.4739 | 112 |
| 4 | none | 12.4629 | 0.5362 | 112 |
Training Visualizations
Each row shows (from left to right): two source views, the ground-truth target, and the prediction.
Epoch 1:
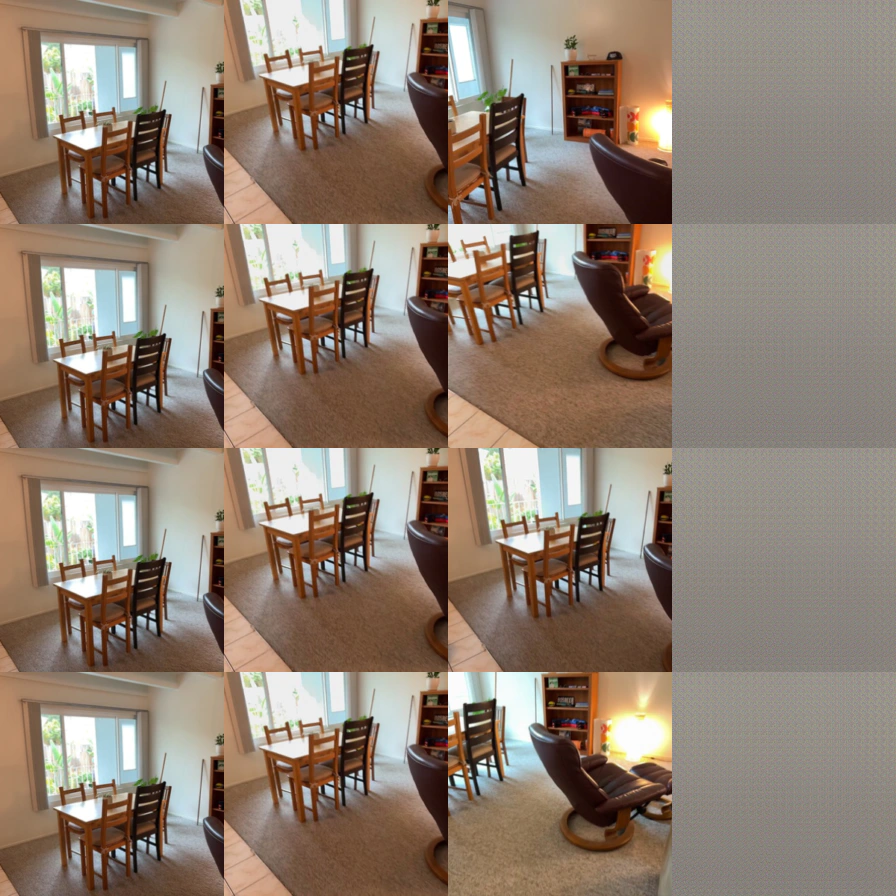
Epoch 51:
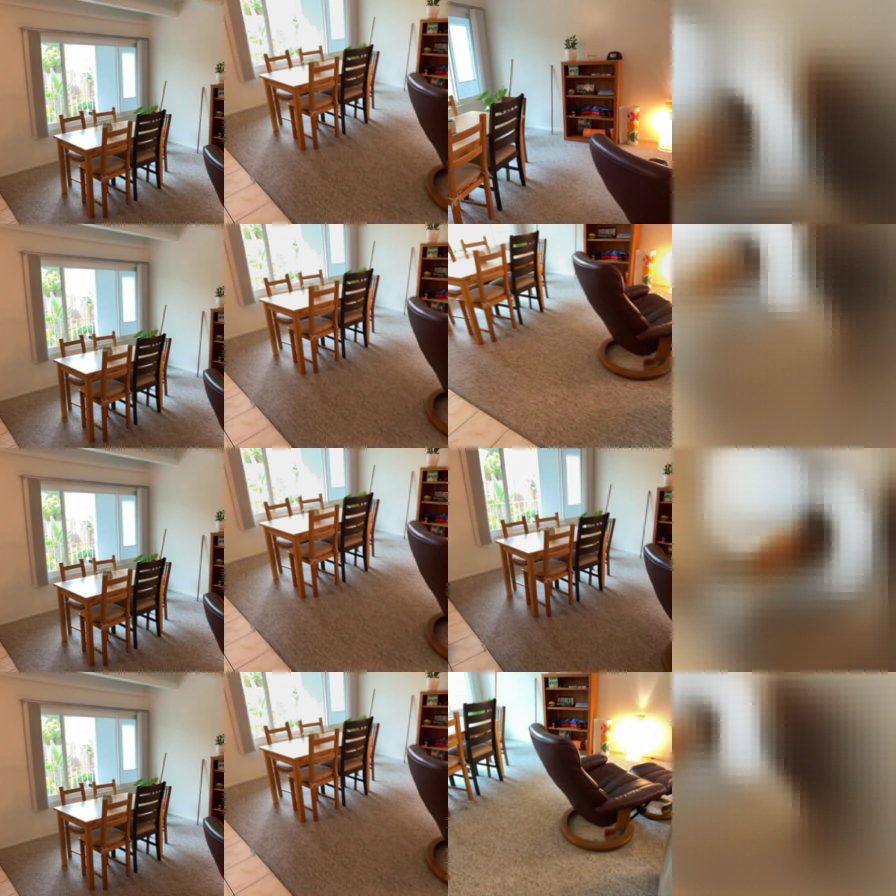
Epoch 96:
Evaluation visualizations
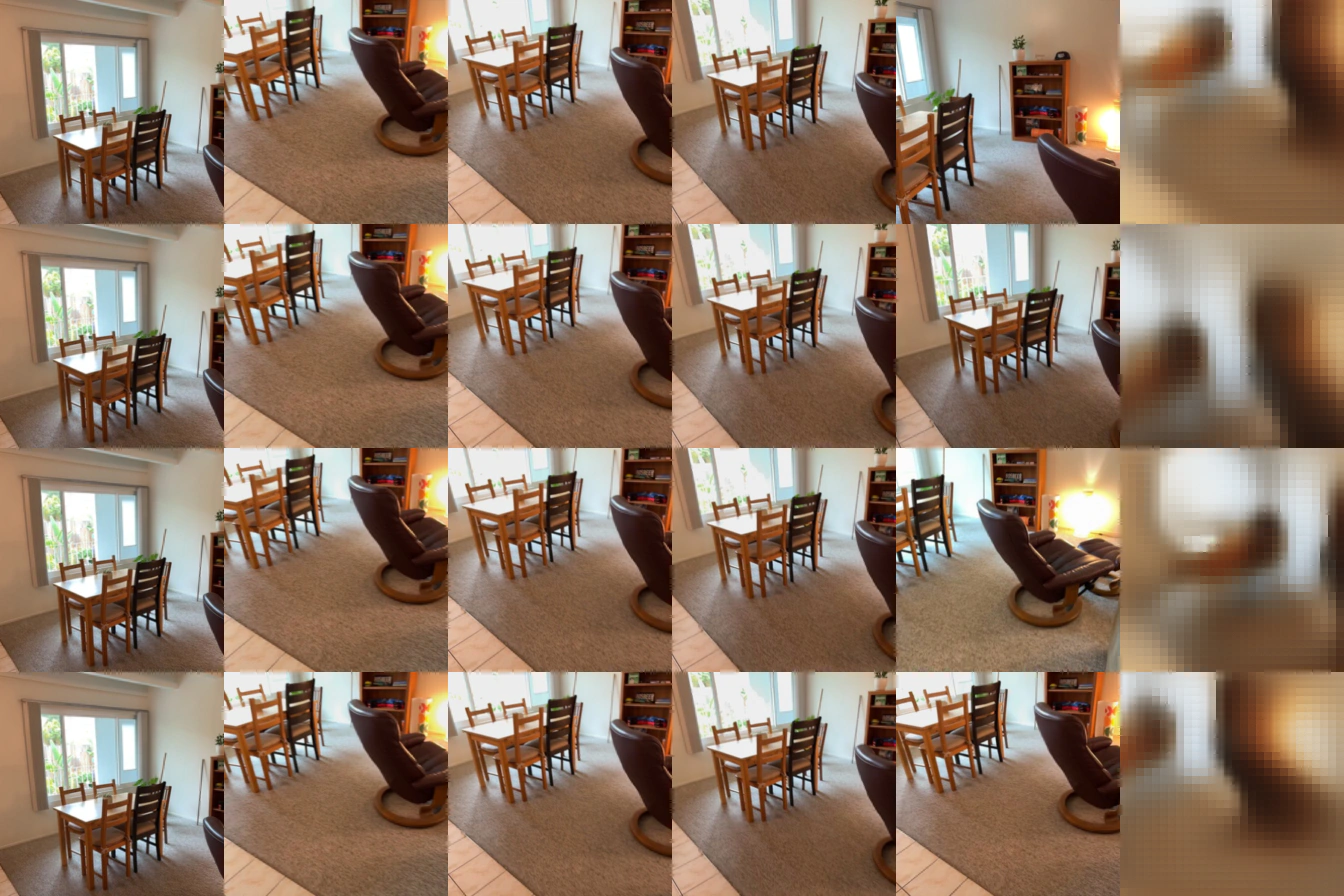
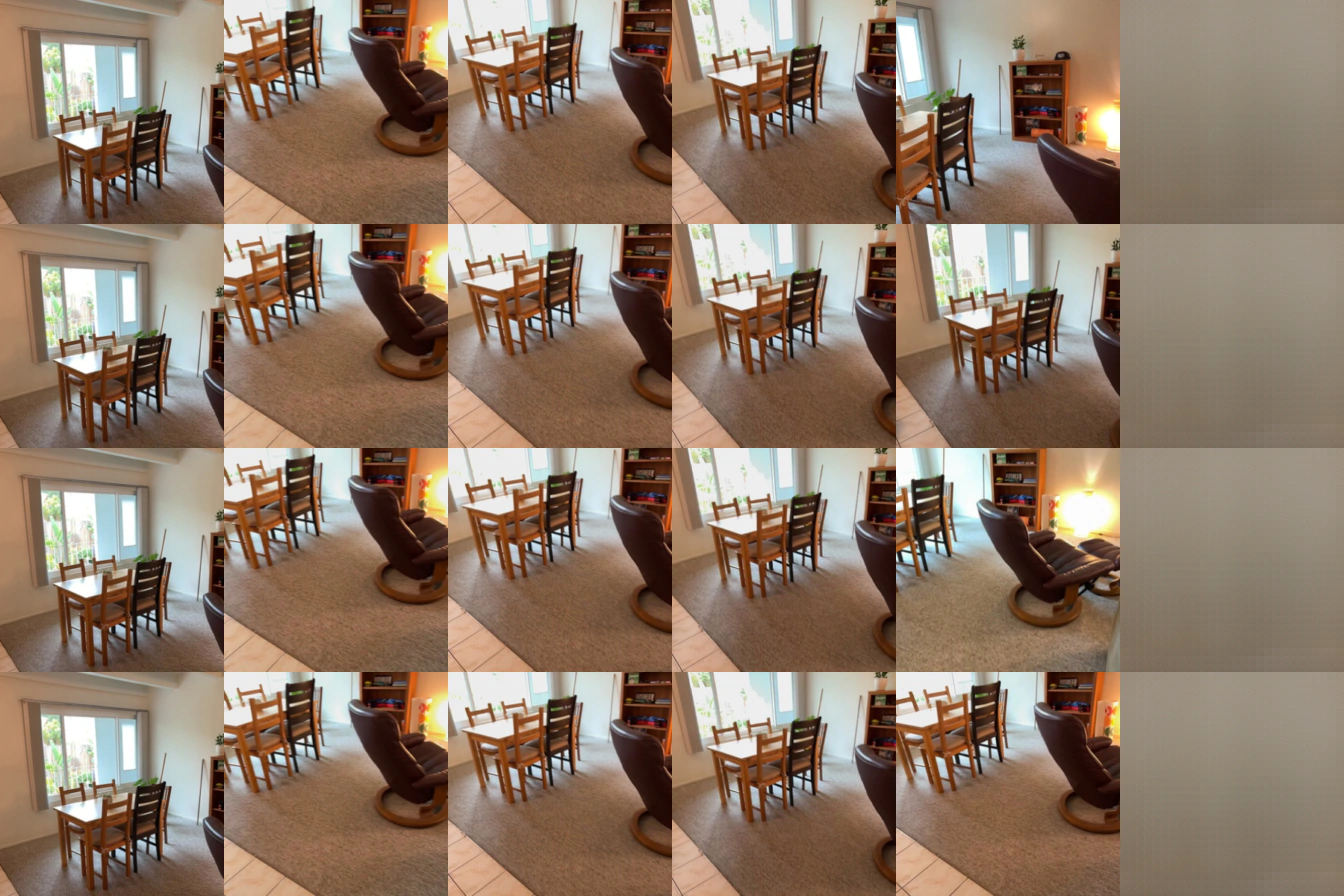
Each row shows (from left to right): the source views (in the first 1, 2, or 4 columns), the ground-truth target, and the prediction.
1 source view, correct target rays:
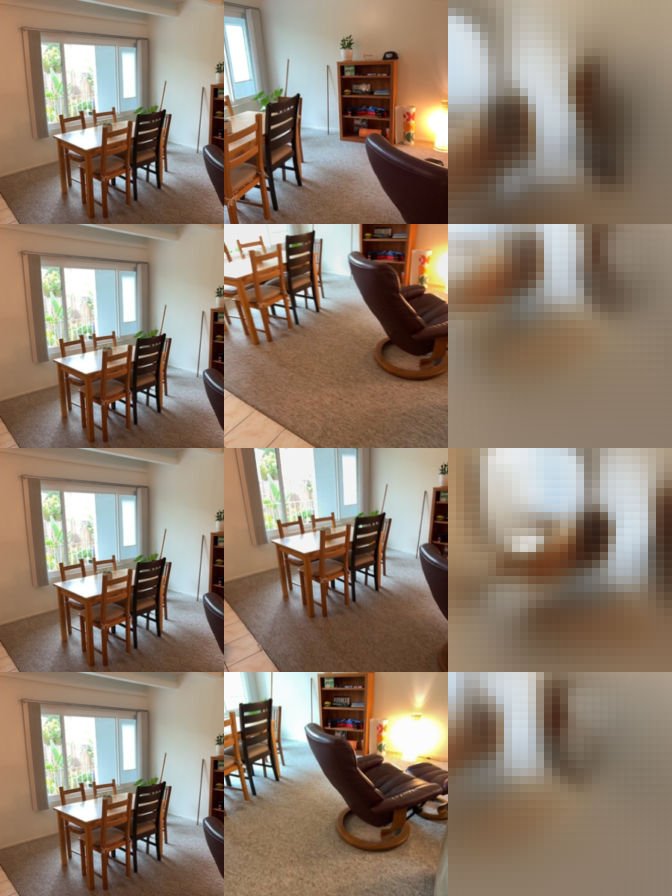
1 source view, shuffled target rays:
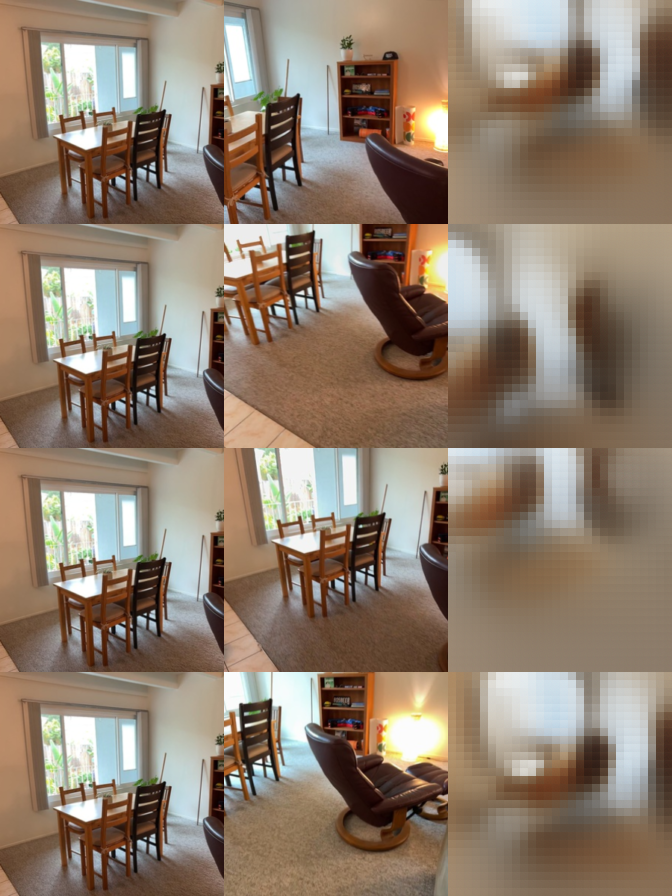
1 source view, none target rays:
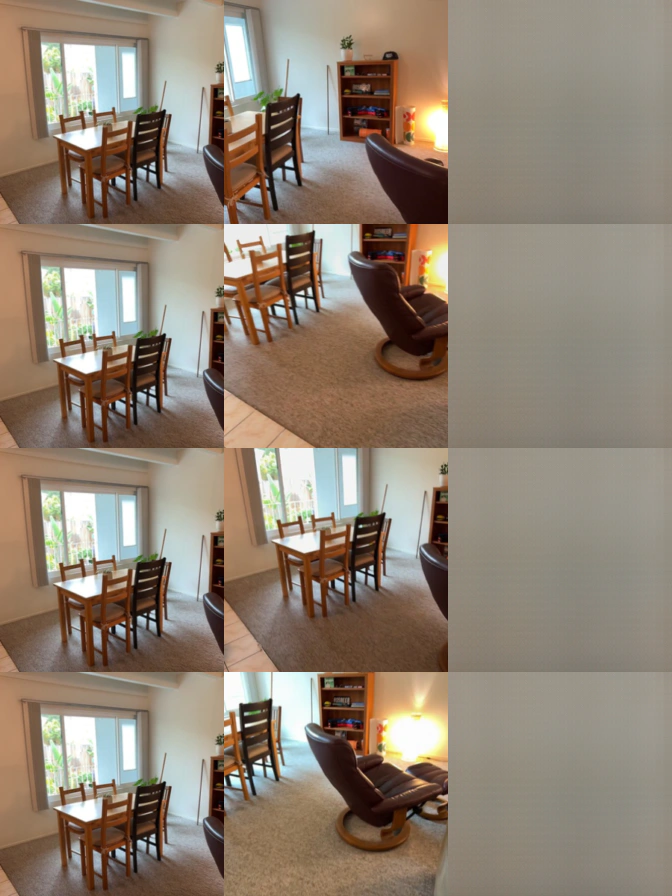
2 source views, correct target rays:
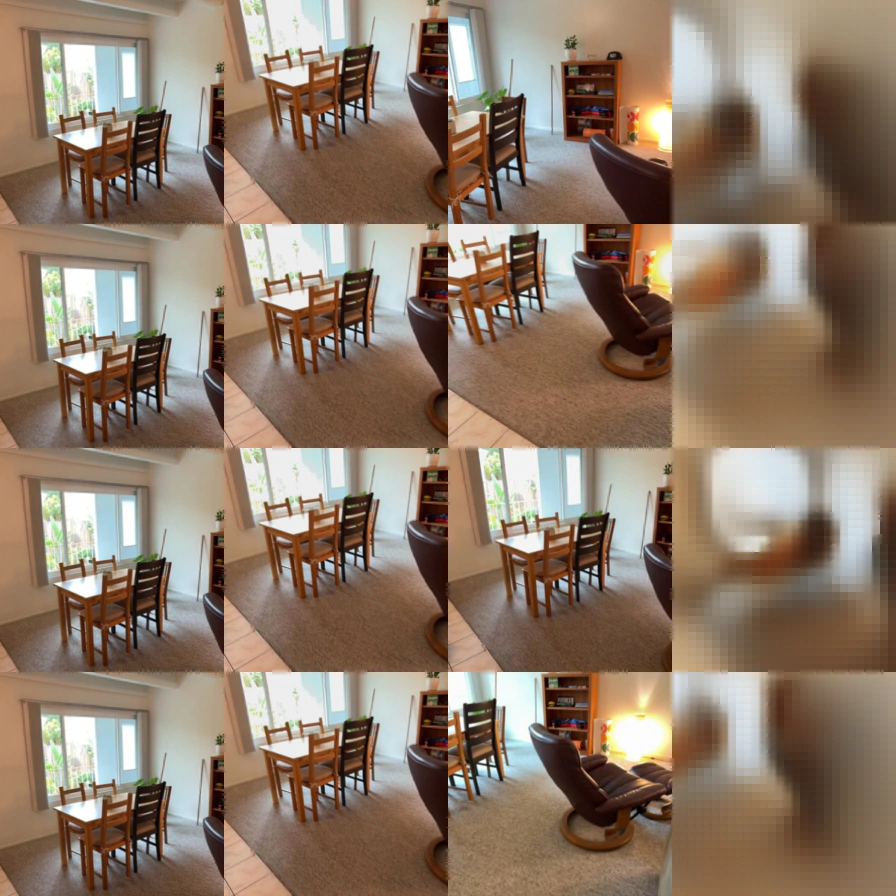
2 source views, shuffled target rays:
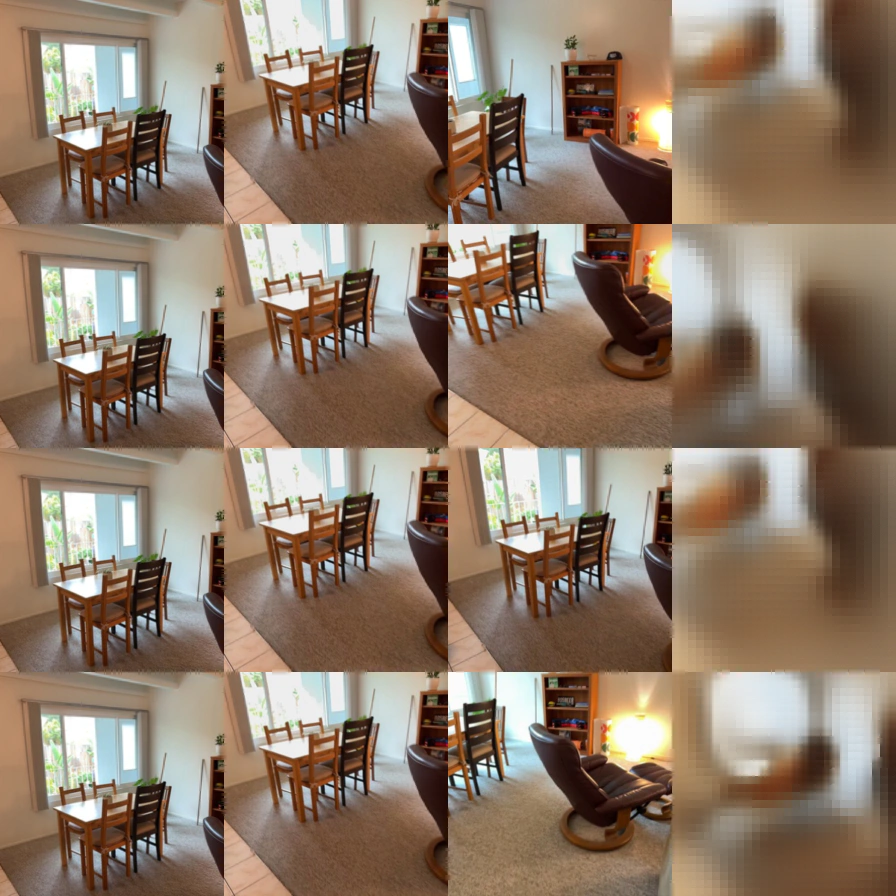
2 source views, none target rays:
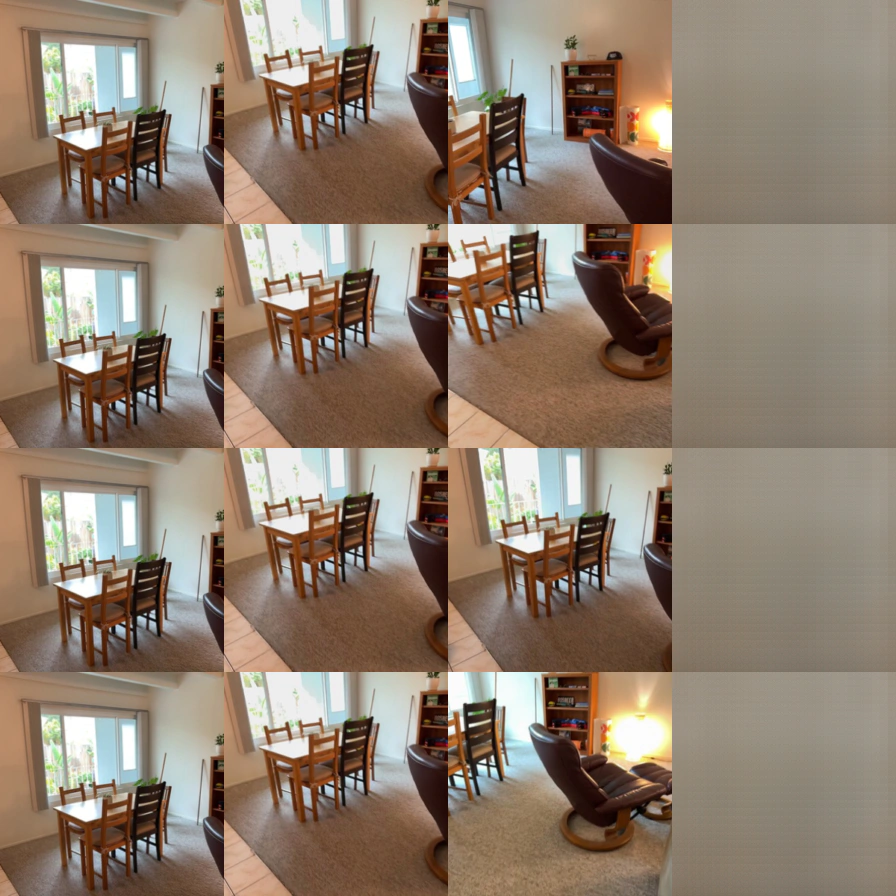
4 source views, correct target rays:
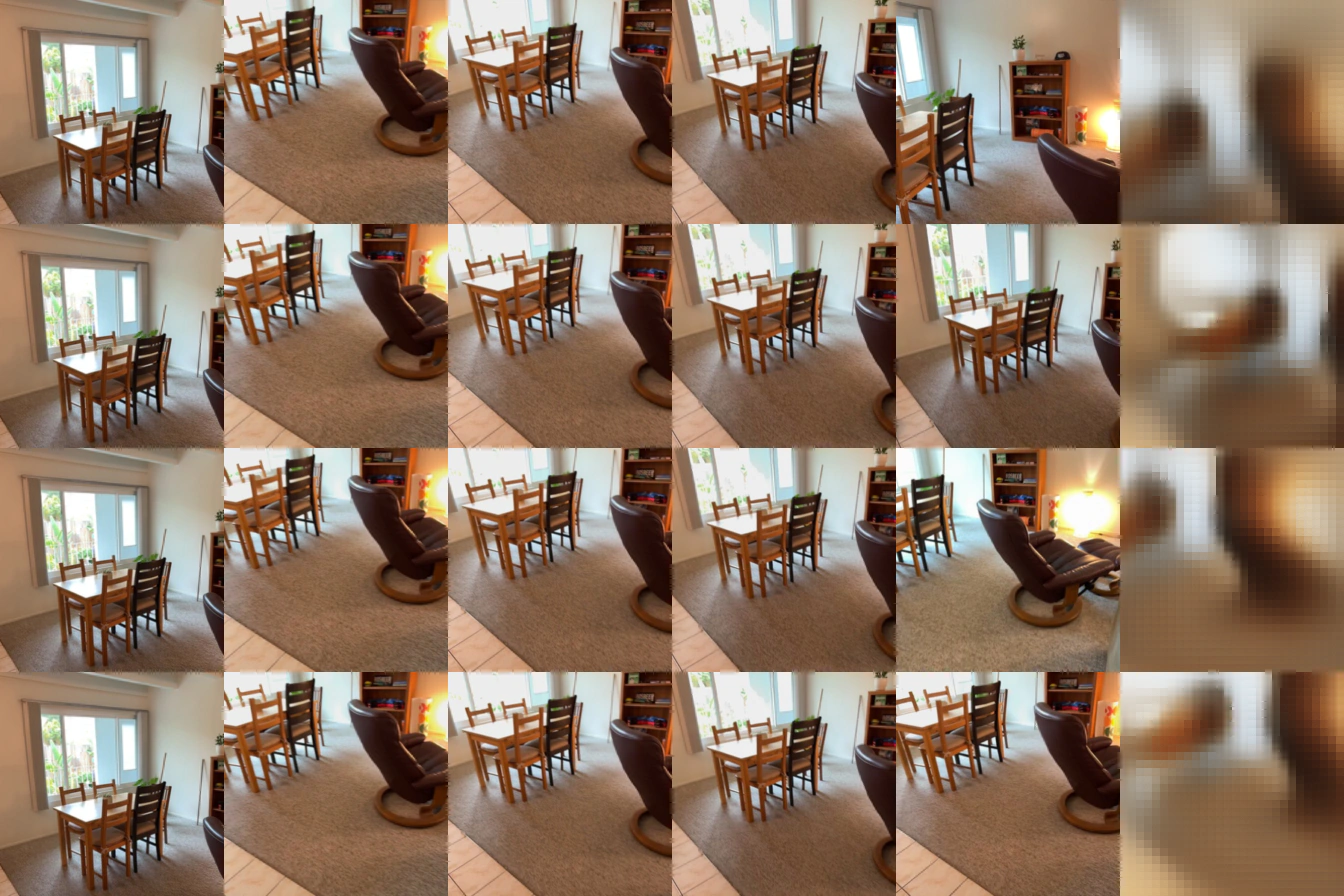
4 source views, shuffled target rays:
4 source views, none target rays:
Discussion: number of source views
With correct target rays, increasing the number of source views from 1 to 2 to 4 improves both PSNR and SSIM. PSNR increases from 15.22 to 16.18 to 16.86 dB, while SSIM increases from 0.5573 to 0.5594 to 0.5737. More source views provide additional scene information and help better constrain the target-view prediction.
Discussion: ray conditioning
Among experiments with the same number of source views, correct target rays achieve the best performance, while shuffled target rays yield the worst performance. For instance, with 4 source views, shuffling the target rays reduces PSNR from 16.86 to 11.56 dB and SSIM from 0.5737 to 0.4739. Removing the target rays reduces PSNR to 12.46 dB and SSIM to 0.5362, therefore experiments without target rays perform between those with correct and shuffled rays. This suggests that incorrect target rays can be more harmful than missing target rays, showing that correct ray conditioning is crucial for reconstruction.
Question: How does adding an L1 term to the MSE loss affect PSNR, SSIM, and visual sharpness?
Experimental settings: The training objective is L = MSE + lambda * L1, with lambda = 0, 0.1, 0.5, 1.0. The MSE baseline from Section 2.2 is the experiment run of lambda = 0. Each model is trained from scratch for 100 epochs with the same model architecture, data settings, seed and optimizer as Section 2.2. The best checkpoint is selected by validation PSNR and evaluated on the same validation scenes using 2 source views and correct target rays.
Results:
| L1 weight | Validation PSNR (dB) | Validation SSIM |
|---|---|---|
| 0 (Single MSE loss baseline) | 16.1787 | 0.5594 |
| 0.1 | 16.2569 | 0.5604 |
| 0.5 | 16.3368 | 0.5633 |
| 1.0 | 16.3265 | 0.5640 |
All three L1 settings very slightly improve PSNR and SSIM over the baseline. A weight of 0.5 achieves the highest PSNR (16.3368 dB). A weight of 1.0 achieves the highest SSIM (0.5640).
The following images show the same source and target views across all four loss settings. Each row contains two source views, the ground-truth target, and the prediction. The predictions largely remain blurry and the visual improvement is limited.
L1 weight = 0:
L1 weight = 0.1:
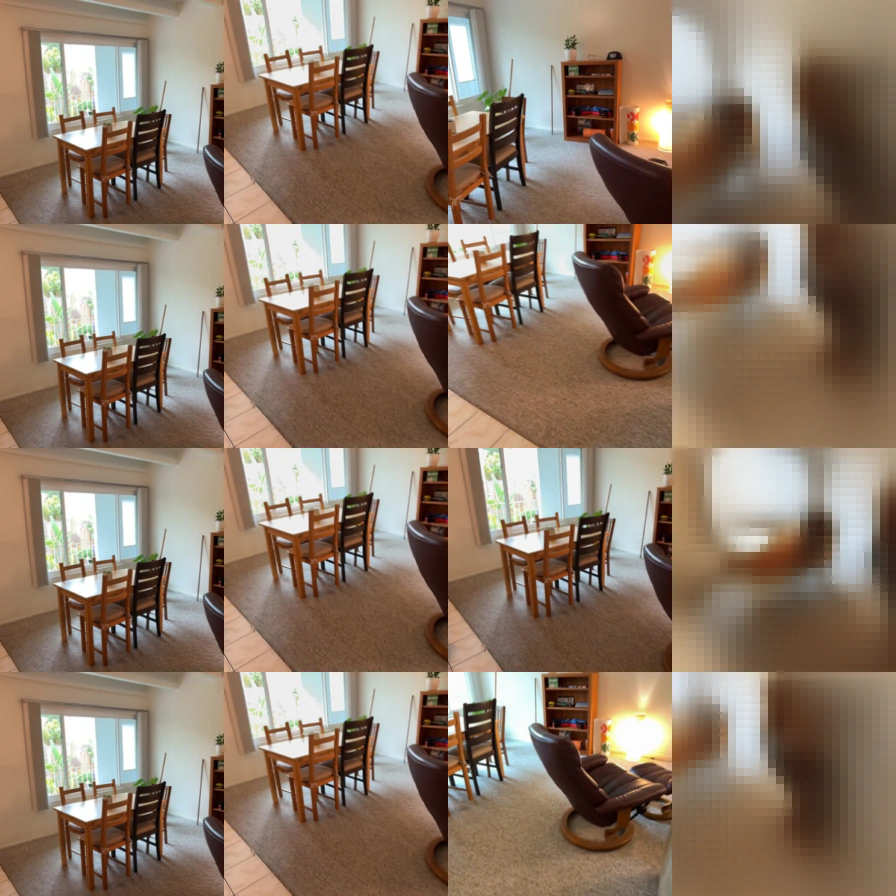
L1 weight = 0.5:
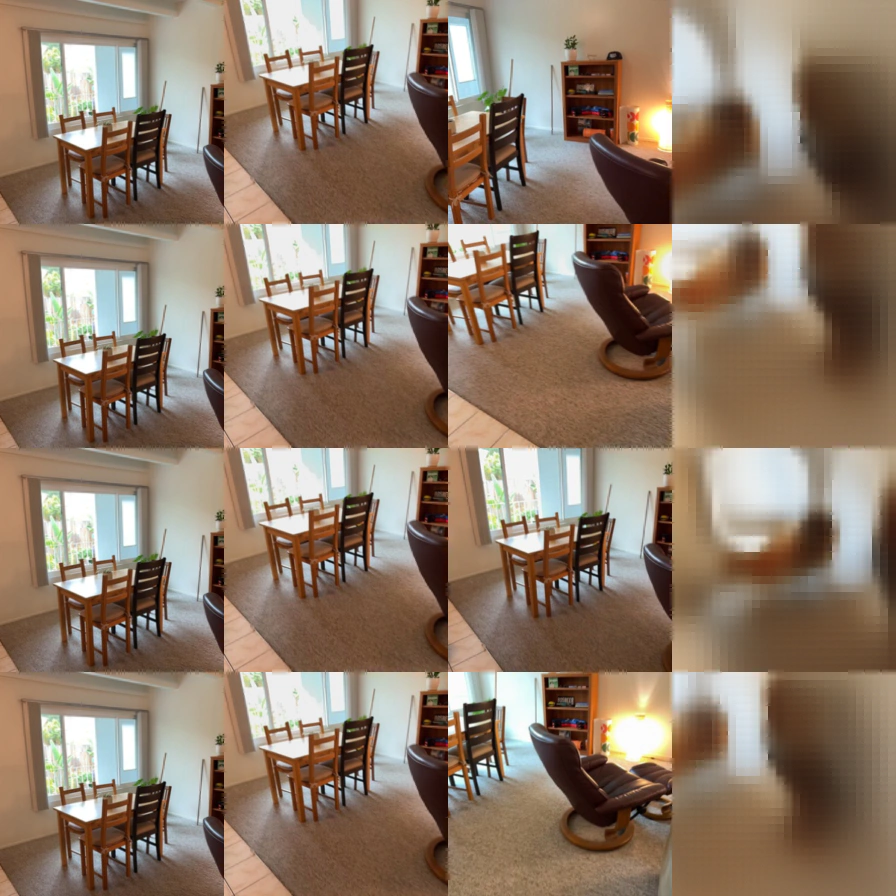
L1 weight = 1.0:
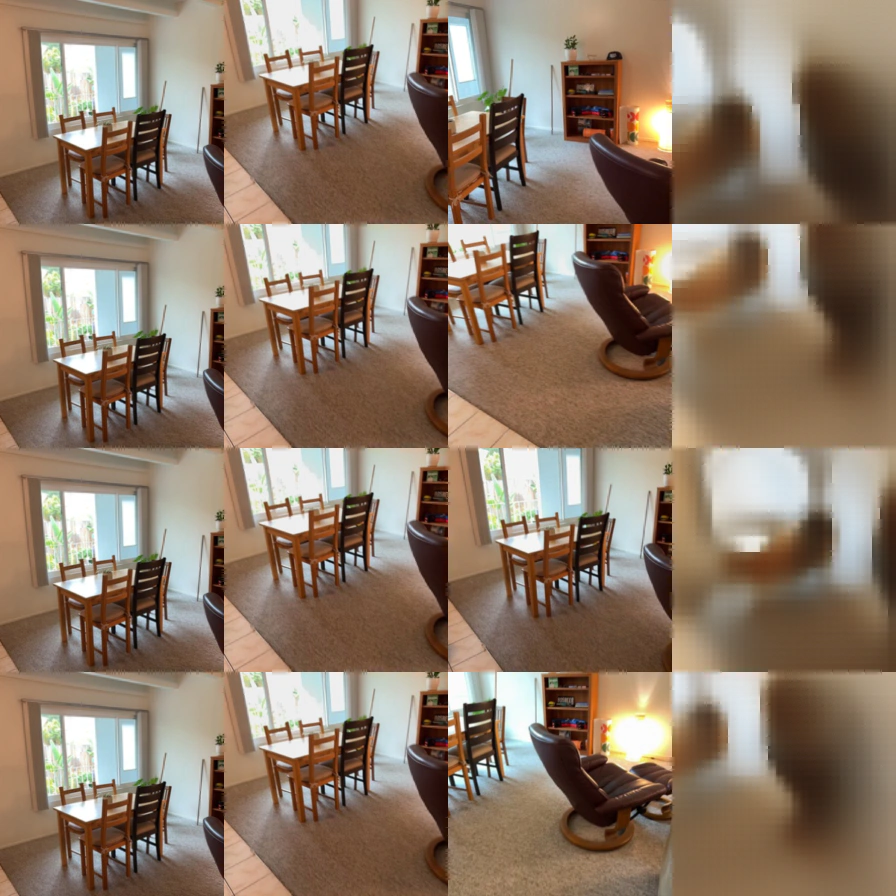
Possible explanation: Adding L1 loss gives smaller pixel errors more weight relative to using only the MSE loss. Adding L1 loss can change how the model balances errors across pixels. This may lead to the small gains in metrics. However, both losses operate on individual pixels and do not explicitly enforce sharp edges or enhance visual details.
Limitations: Each setting uses only one seed, so the small differences may reflect training variability. The visual predictions suggest that the model is still underfitting.
Conclusion: Adding L1 provides a small improvement in validation PSNR and SSIM for these runs. L1 alone does not visibly improve the blurry, blocky predictions.
Loss curve

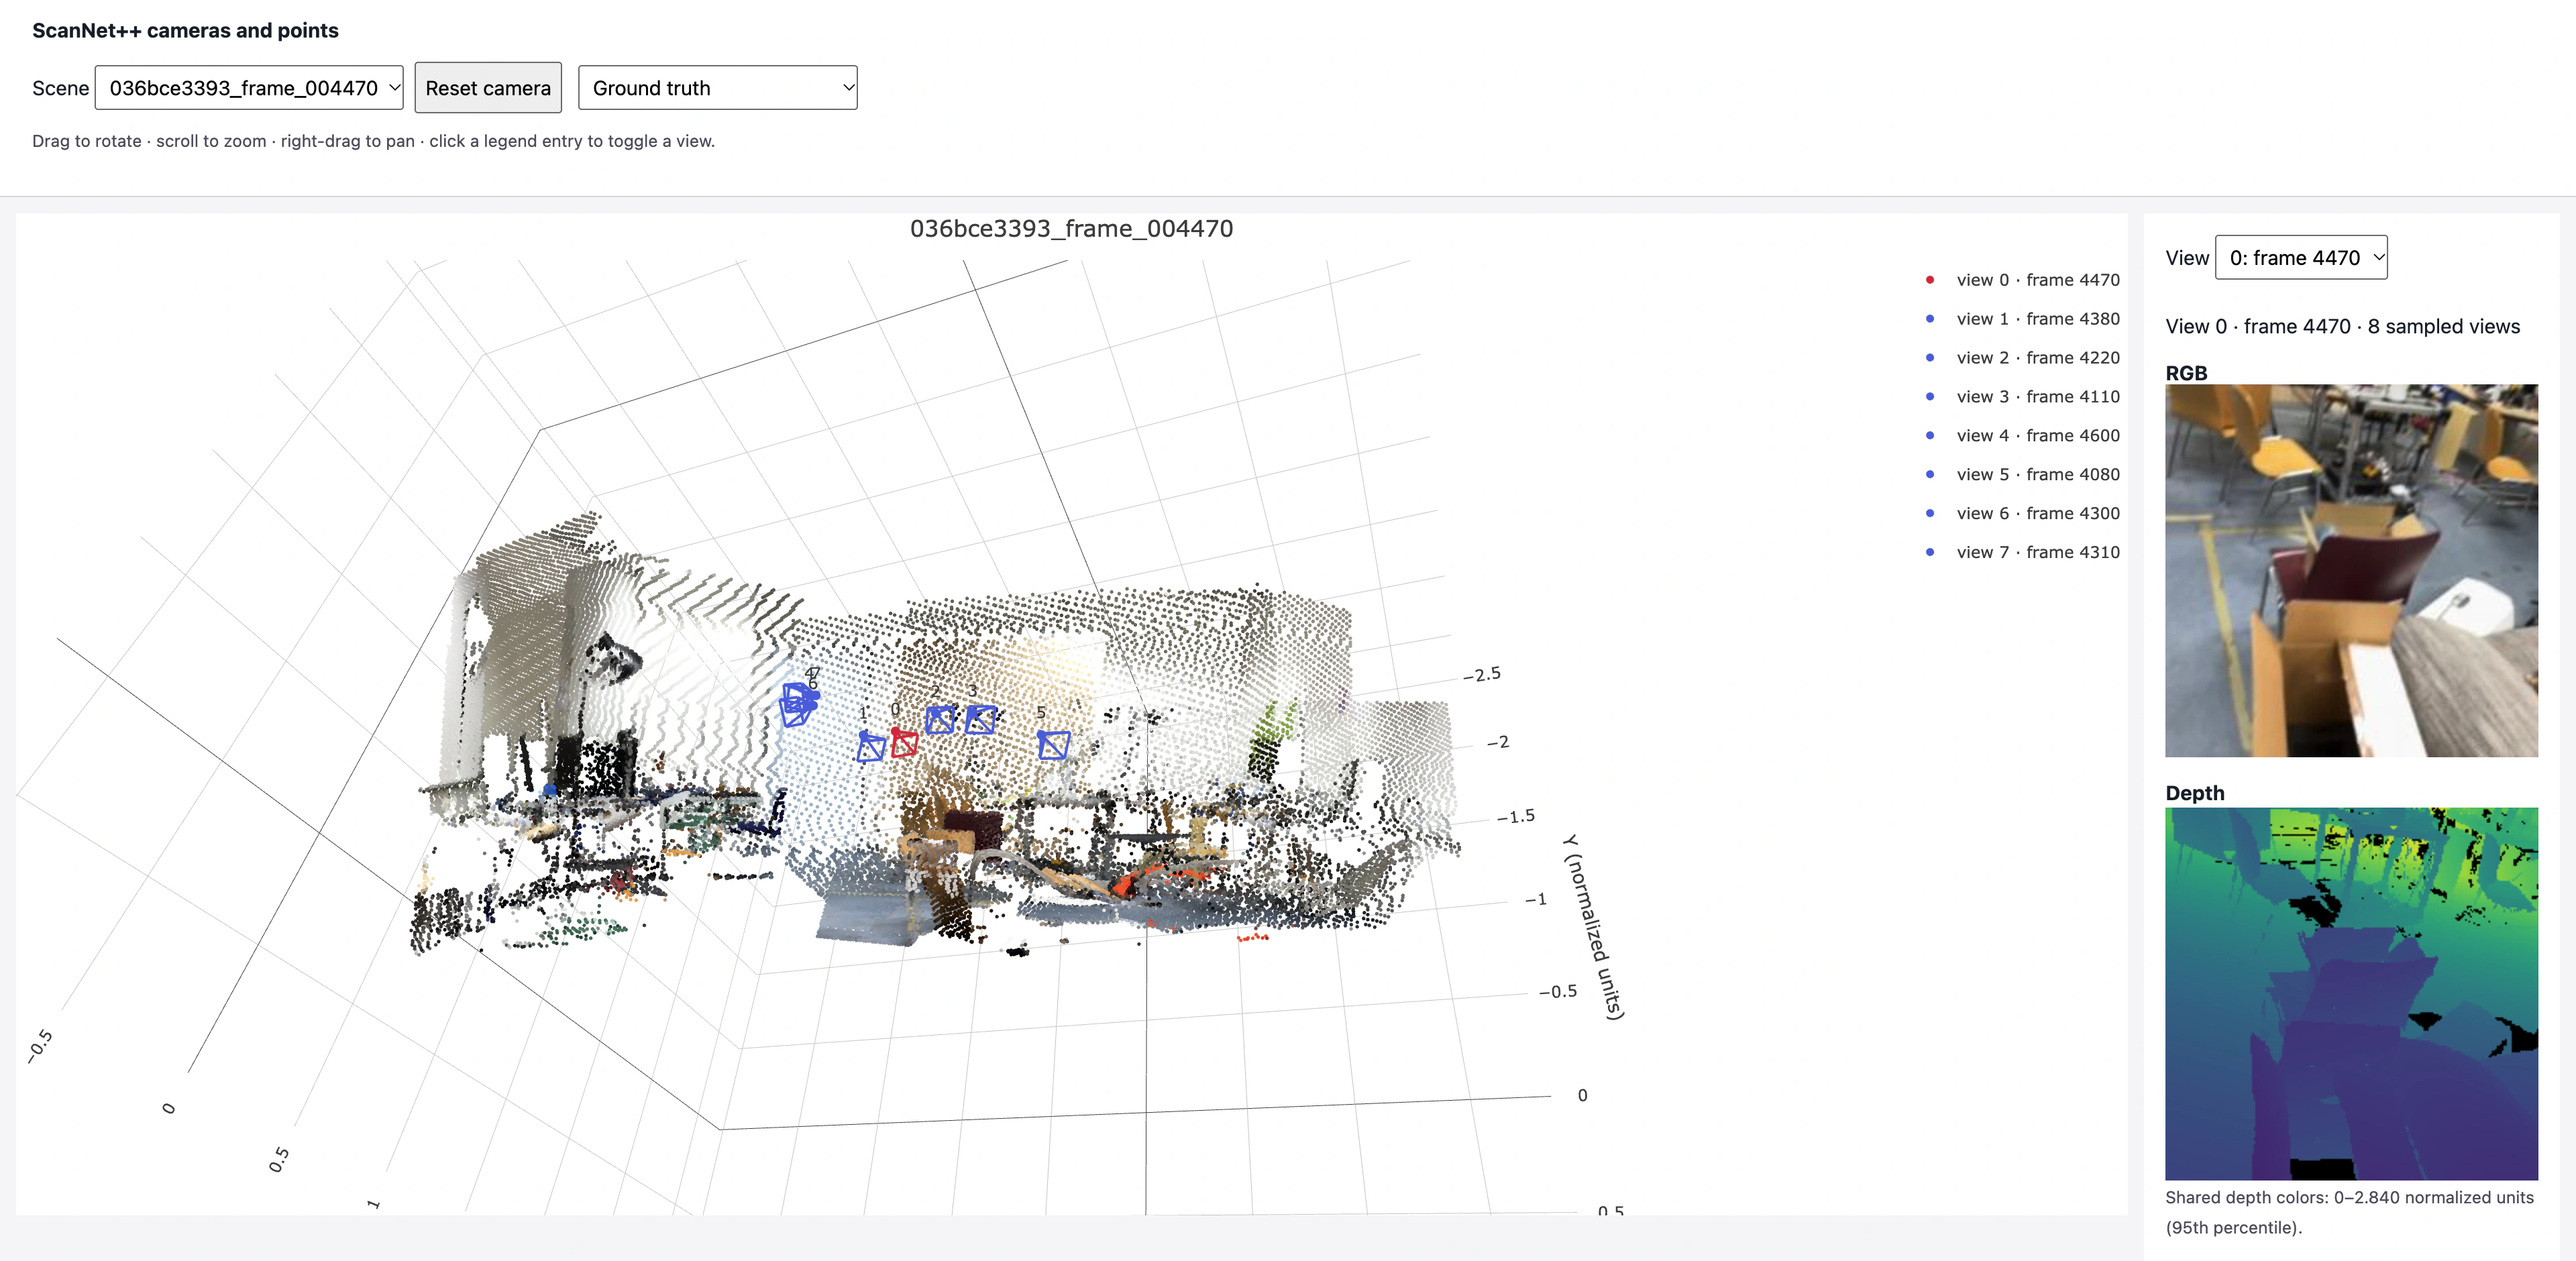
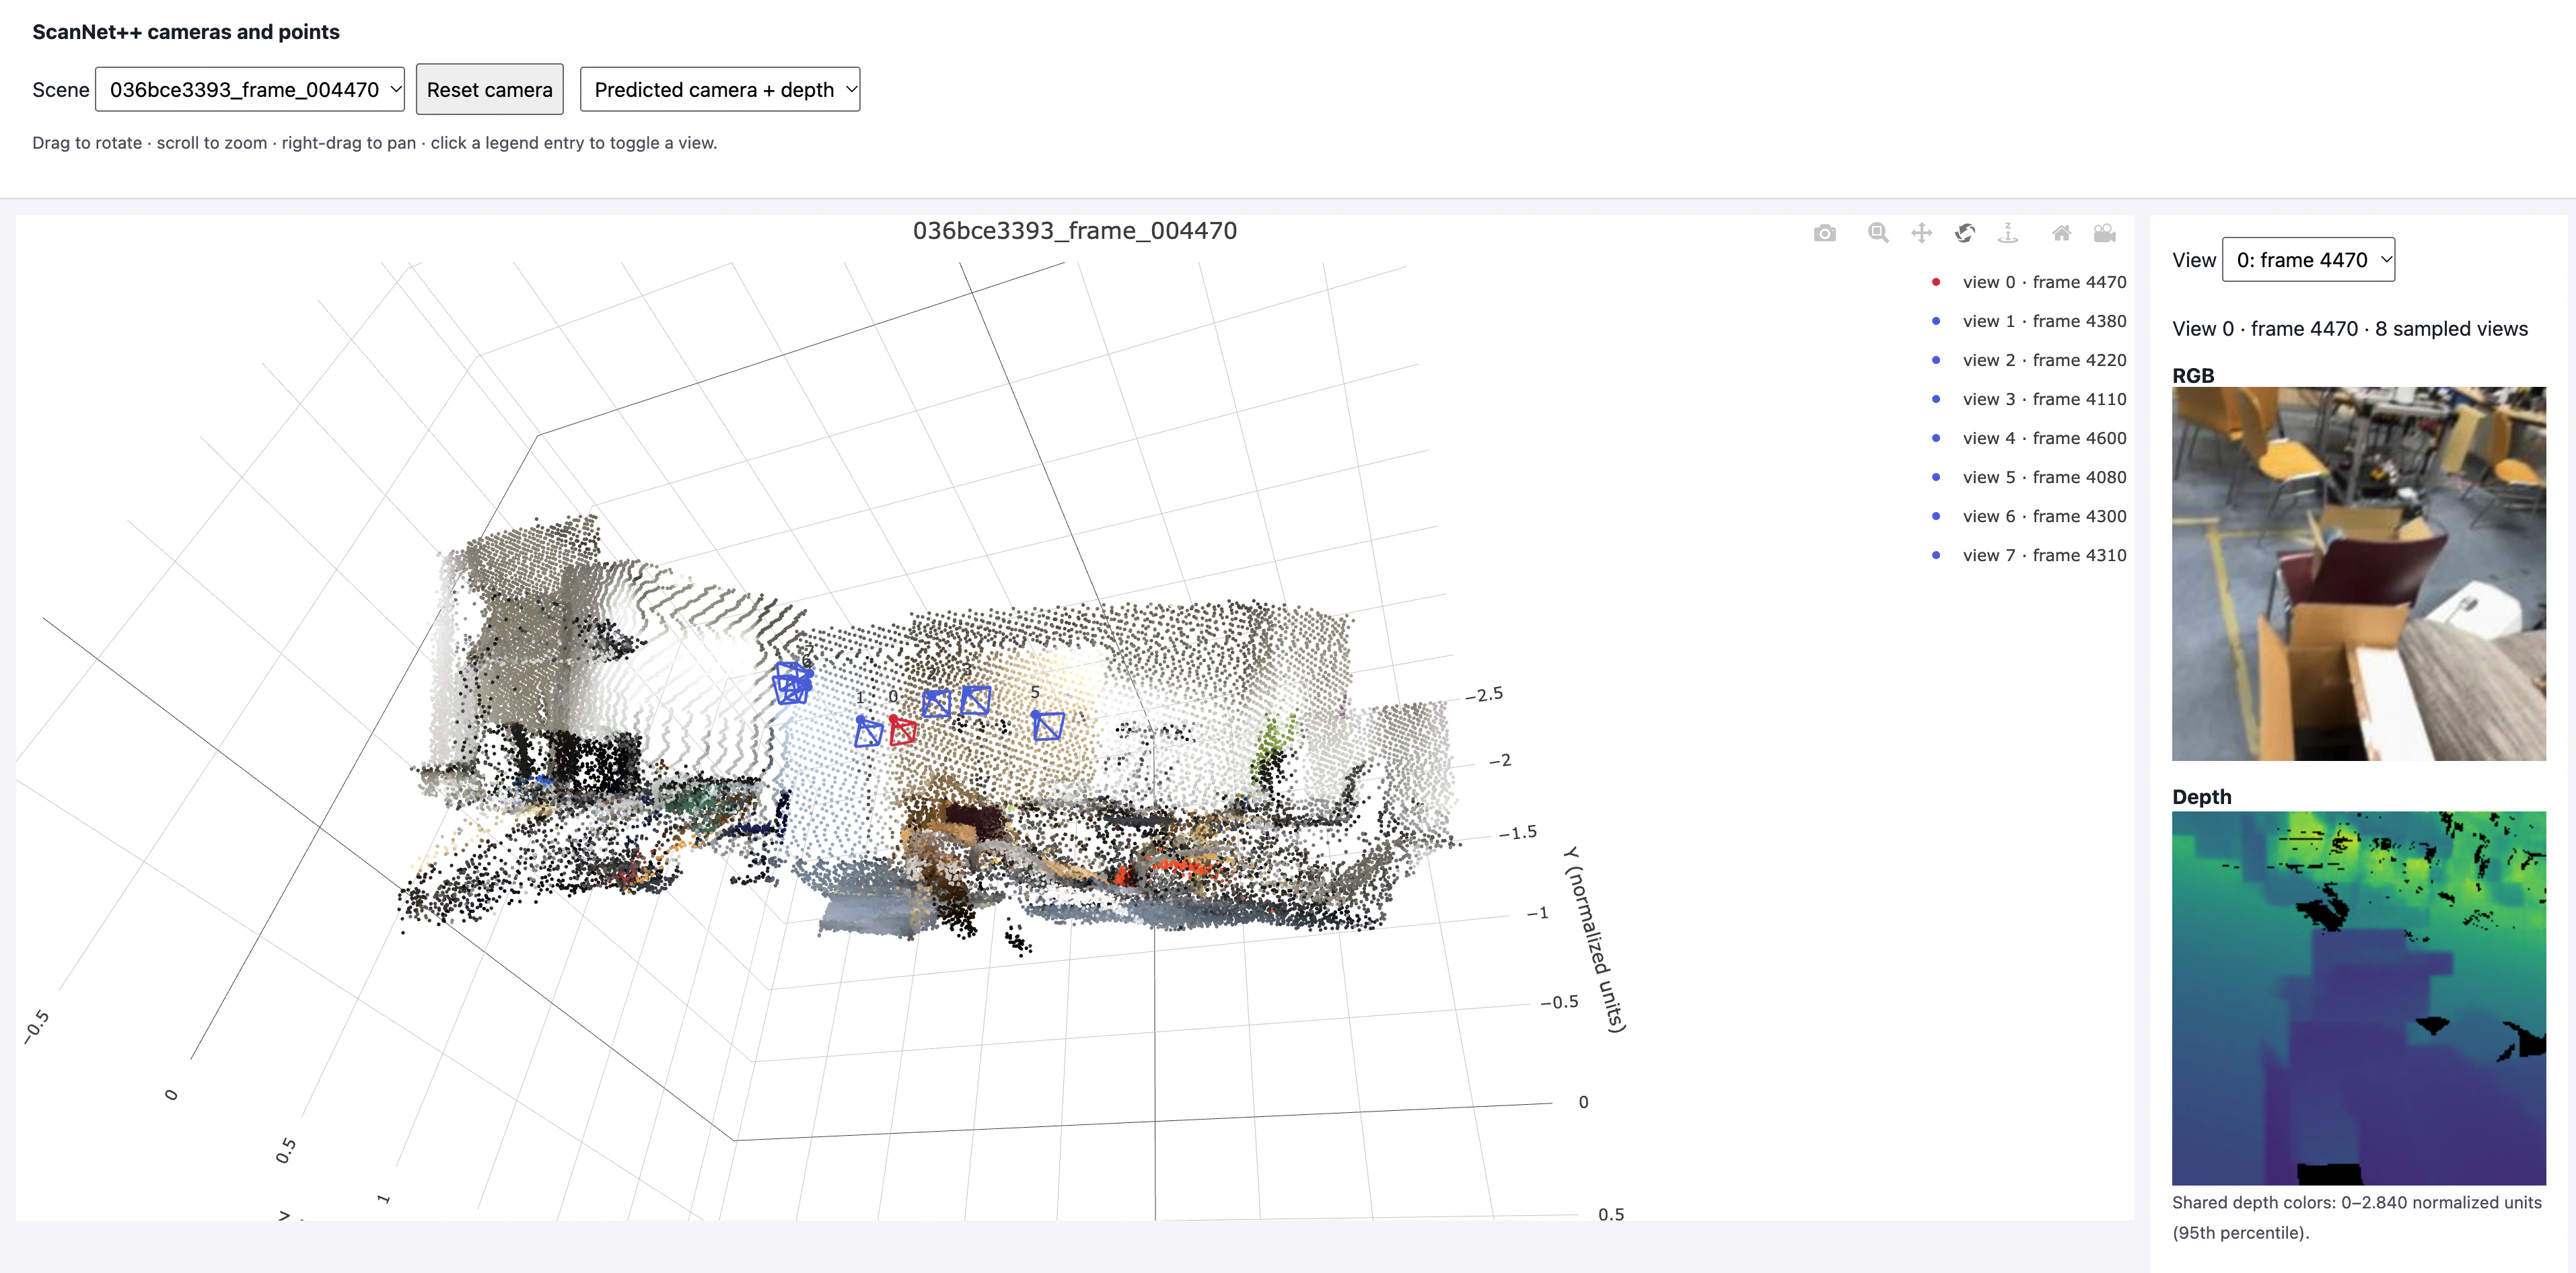
The total, camera, and depth losses decrease during training. The final evaluation yields a total loss of -0.1489, a camera loss of 0.0023, and a depth loss of -0.1601.
| Metric | Initial | Final |
|---|---|---|
| Depth AbsRel | 0.6186 | 0.0381 |
| Depth δ1 | 0.2081 | 0.9536 |
| Mean rotation error (degrees) | 49.73 | 0.17 |
| Mean translation-direction error (degrees) | 90.00 | 0.37 |
GT and predicted geometry
Ground truth:
Predicted camera + depth:
Mini-VGGT Training settings.
Normal-training loss curves

The plots show total, camera, and depth losses on the training and validation splits.
Validation and test metrics
Both val and test splits are evaluated using the same best checkpoint.
| Split | Depth AbsRel ↓ | Depth δ1 ↑ |
|---|---|---|
| Validation | 0.1406 | 0.8336 |
| Test | 0.1466 | 0.8029 |
| Split | Metric | AUC@5° ↑ | AUC@15° ↑ | AUC@30° ↑ |
|---|---|---|---|---|
| Validation | Rotation | 0.1770 | 0.4963 | 0.6937 |
| Test | Rotation | 0.1541 | 0.4713 | 0.6942 |
| Validation | Translation | 0.0110 | 0.0642 | 0.1793 |
| Test | Translation | 0.0066 | 0.0421 | 0.1429 |
| Validation | Joint pose | 0.0020 | 0.0461 | 0.1541 |
| Test | Joint pose | 0.0000 | 0.0275 | 0.1327 |
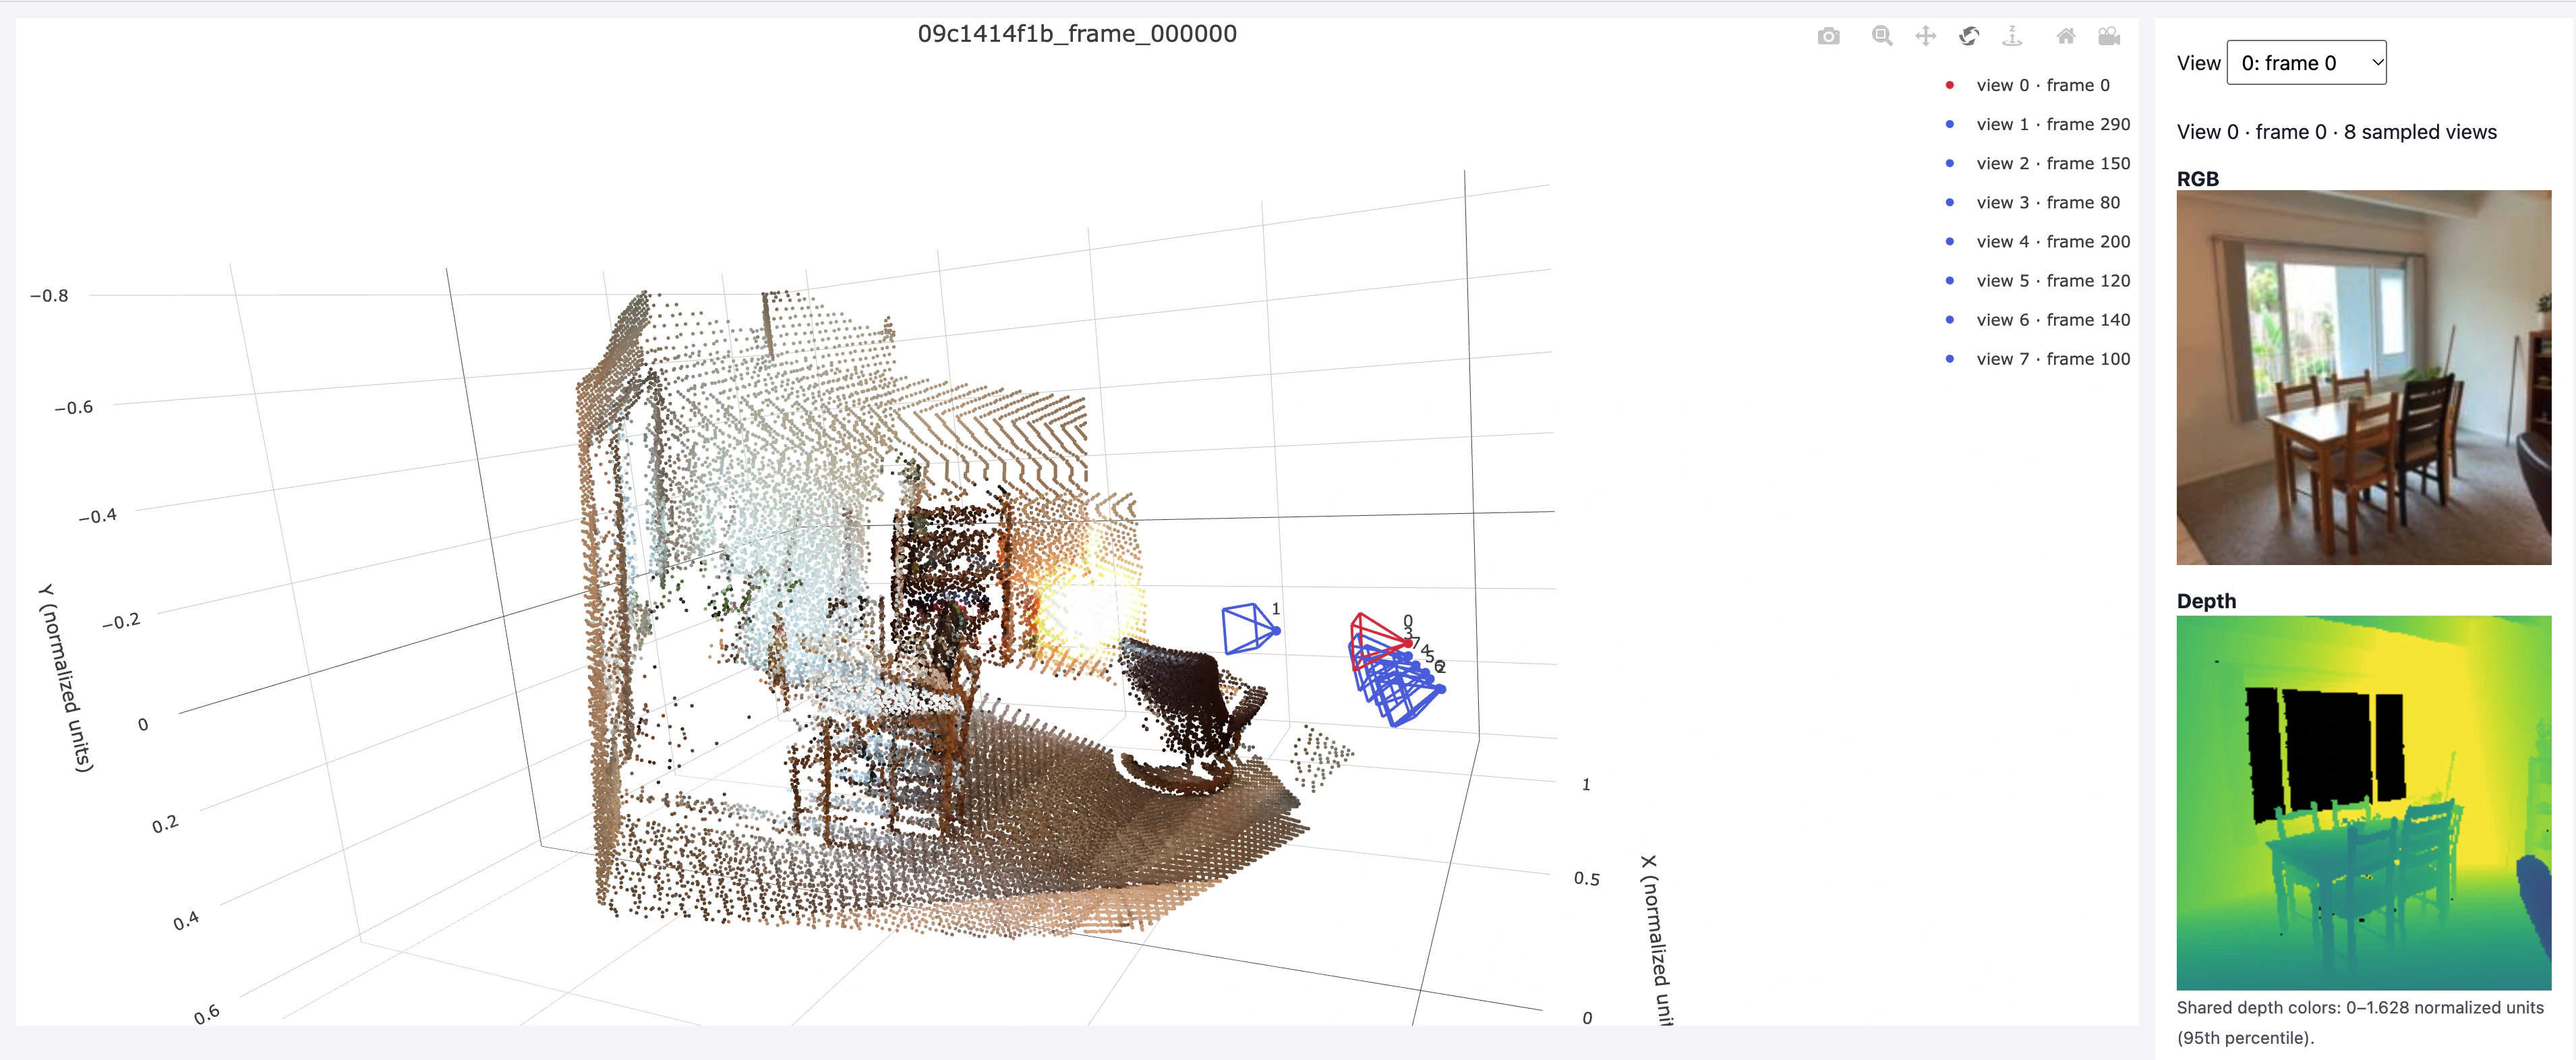
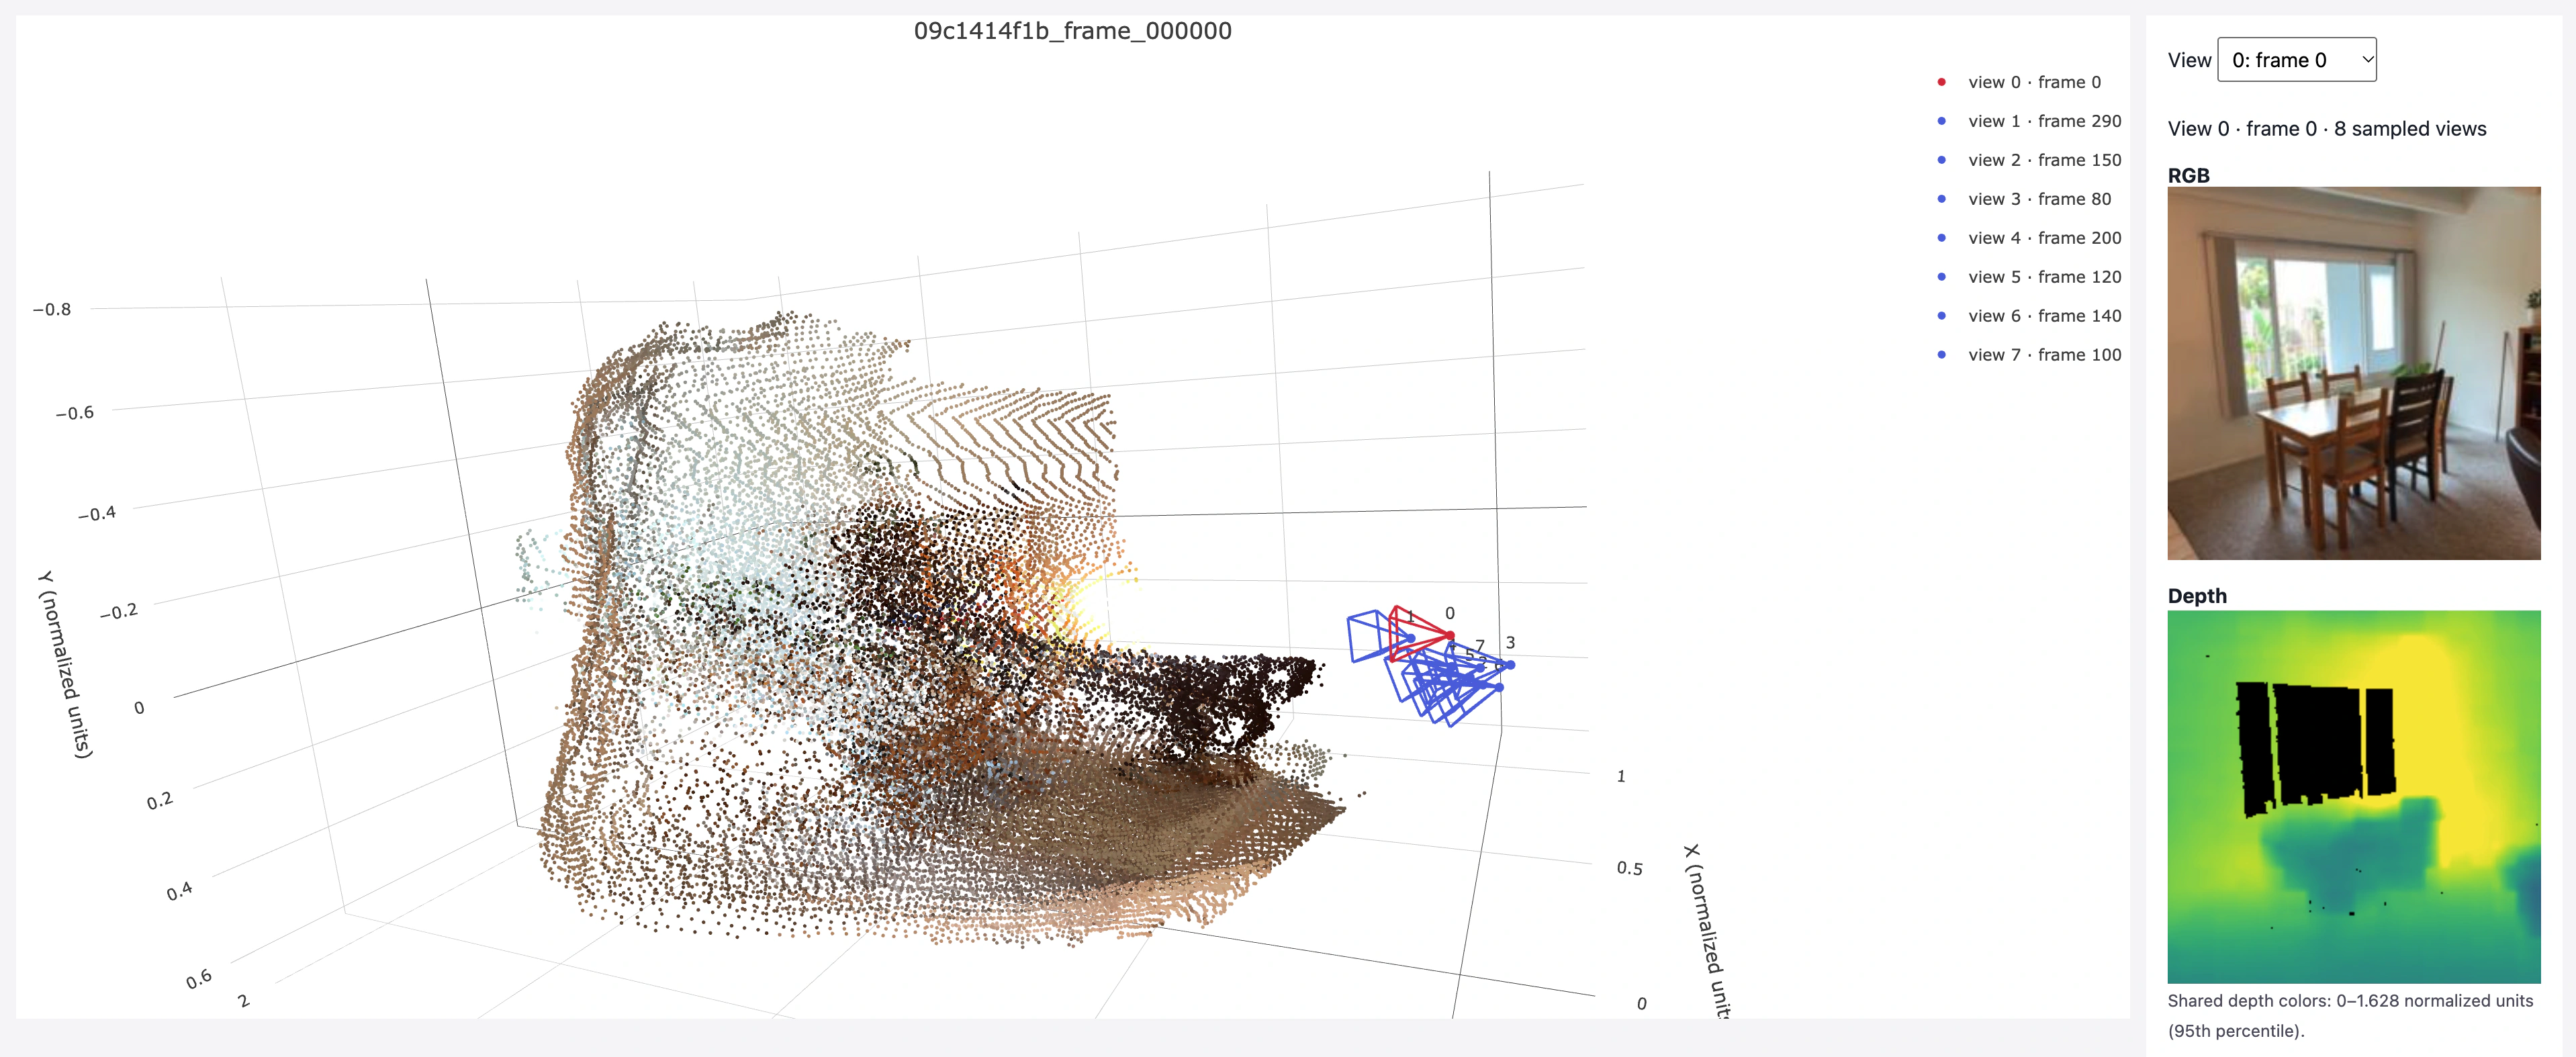
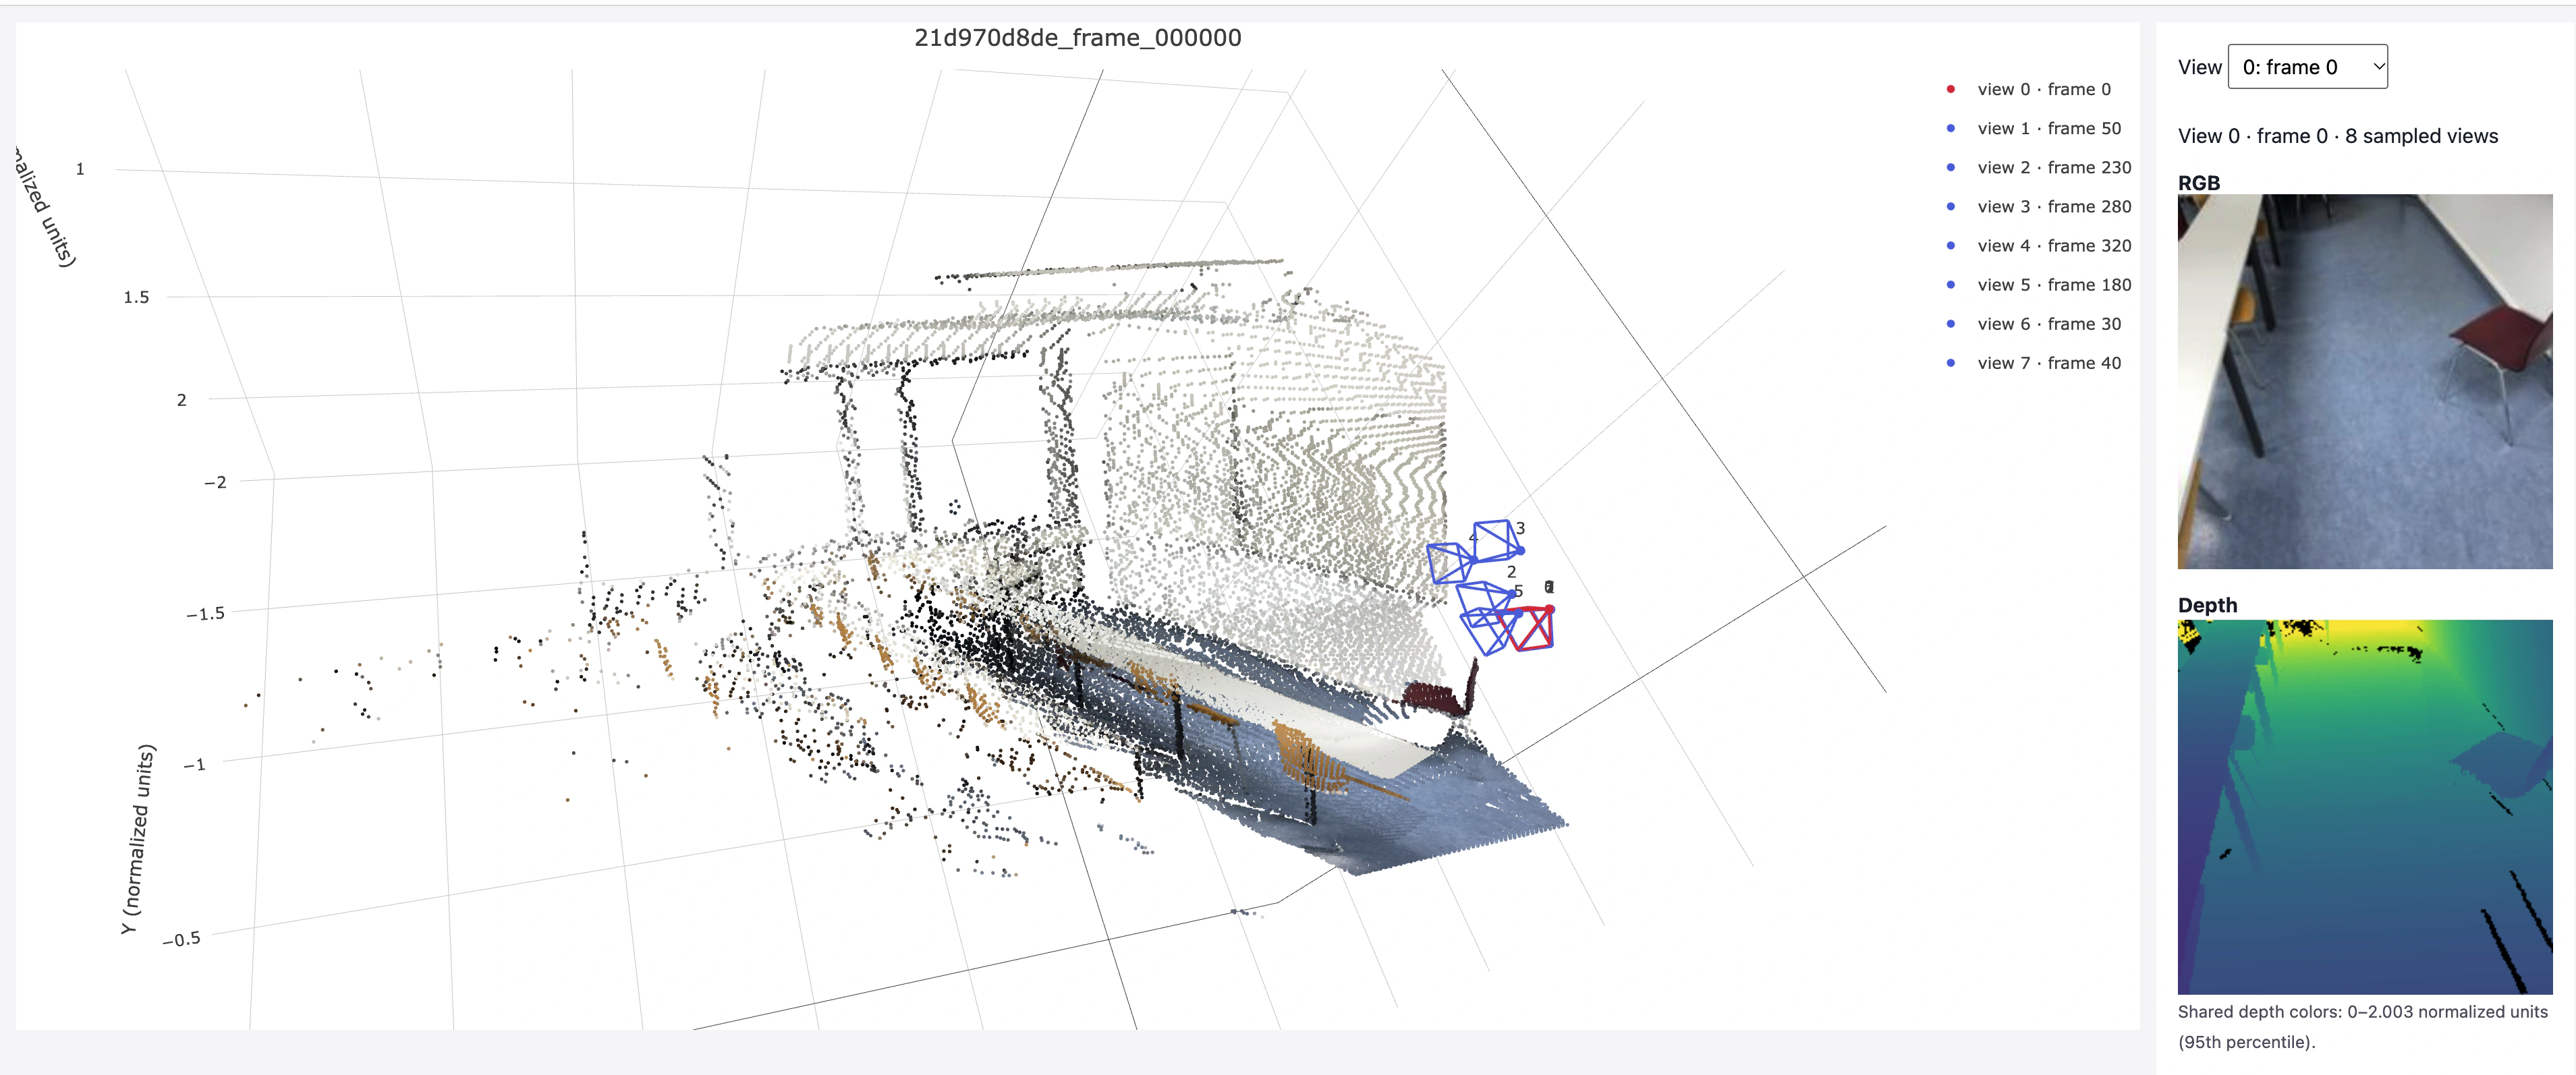
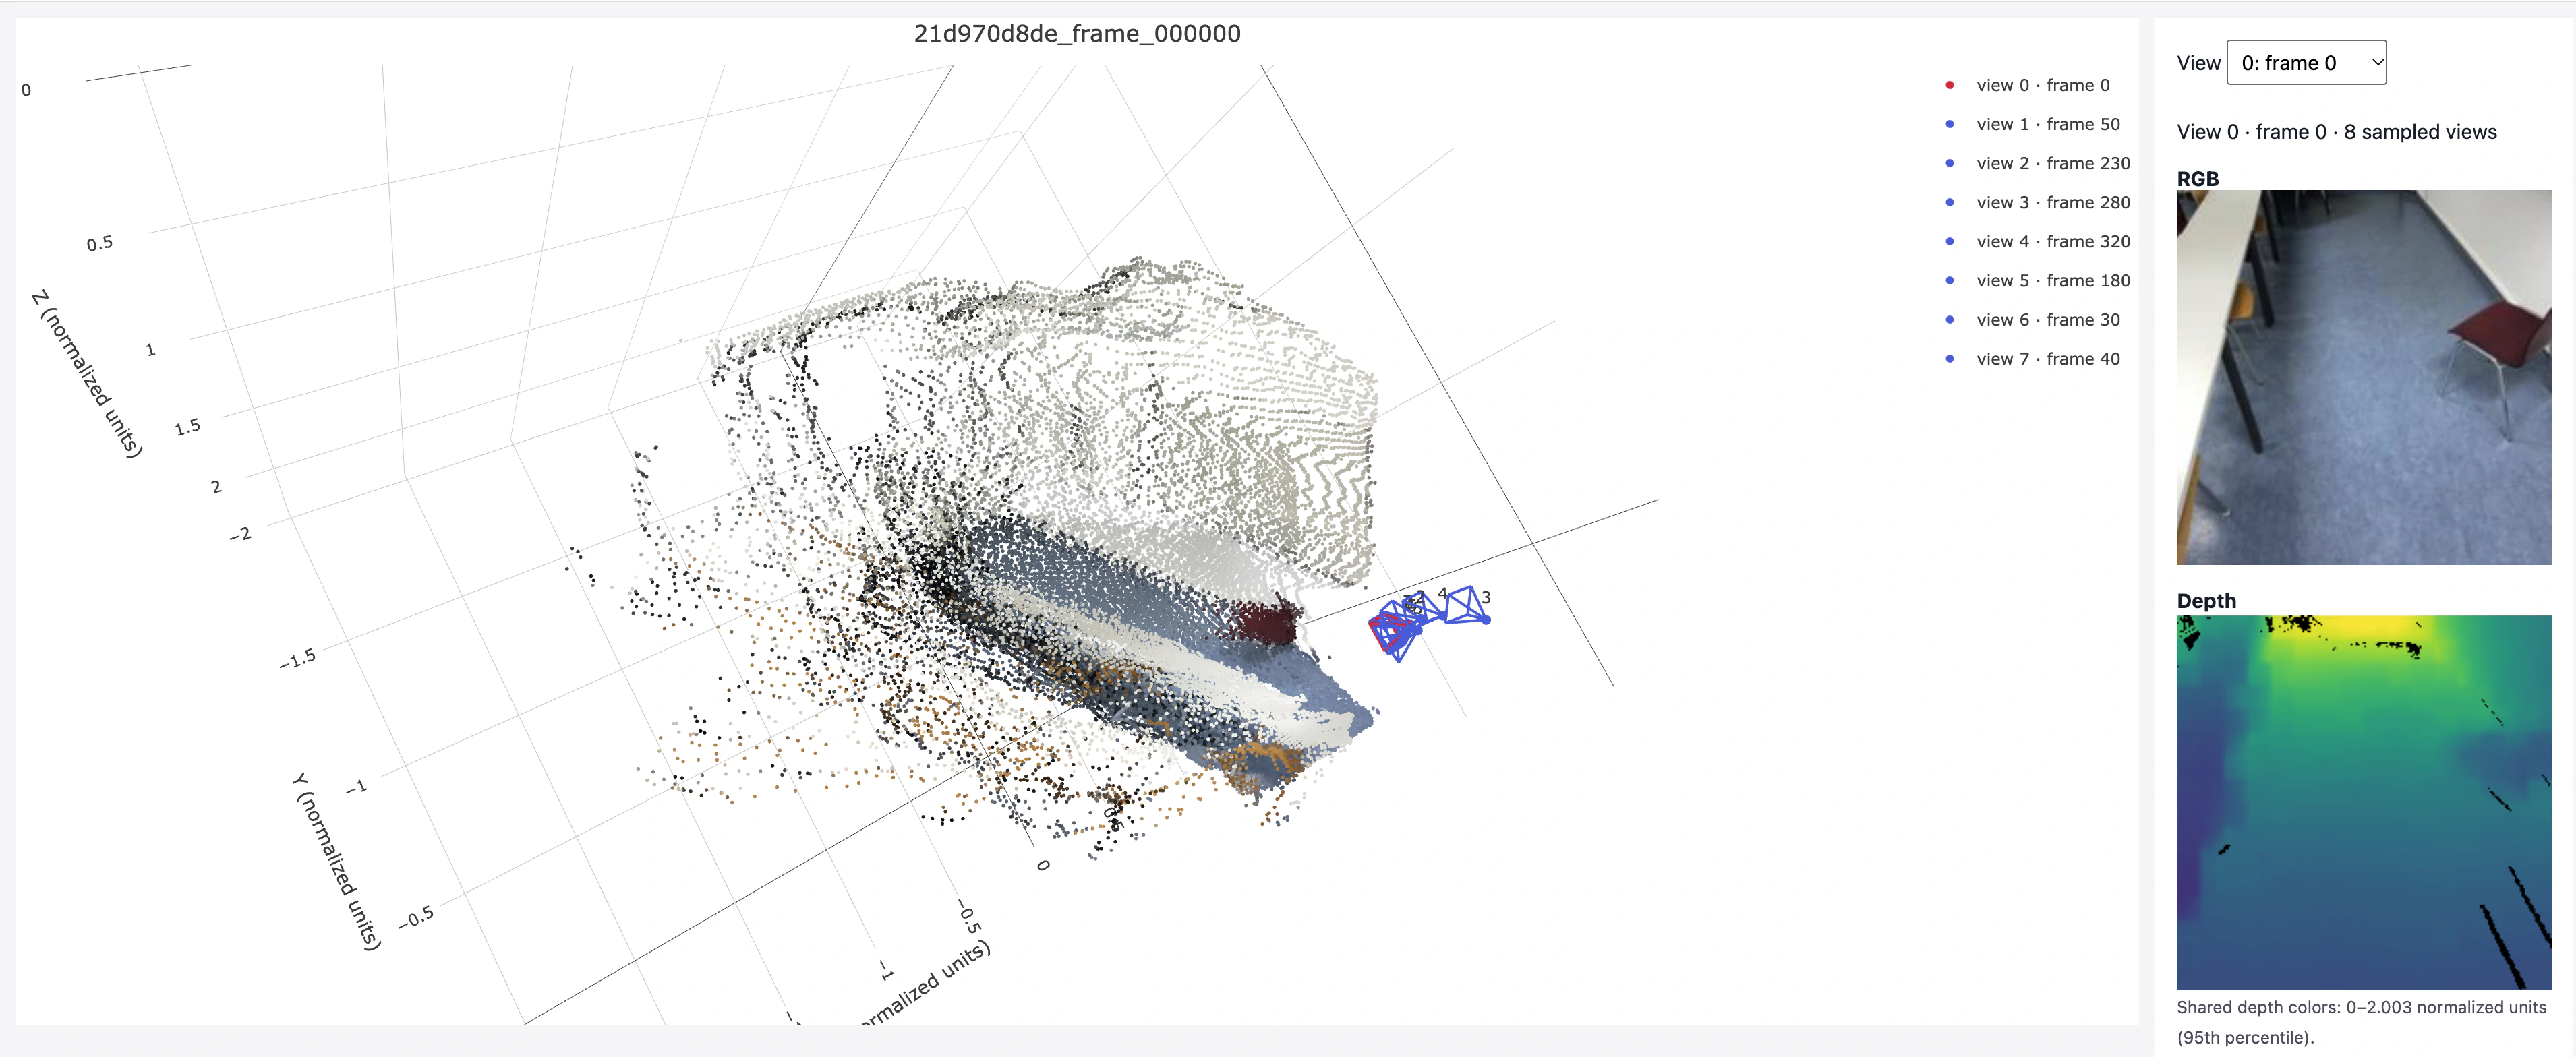
GT and predicted geometry on four validation scenes
Scene 1: 09c1414f1b_frame_000000
Ground truth:
Predicted camera + depth:
Scene 2: 21d970d8de_frame_000000
Ground truth:
Predicted camera + depth:
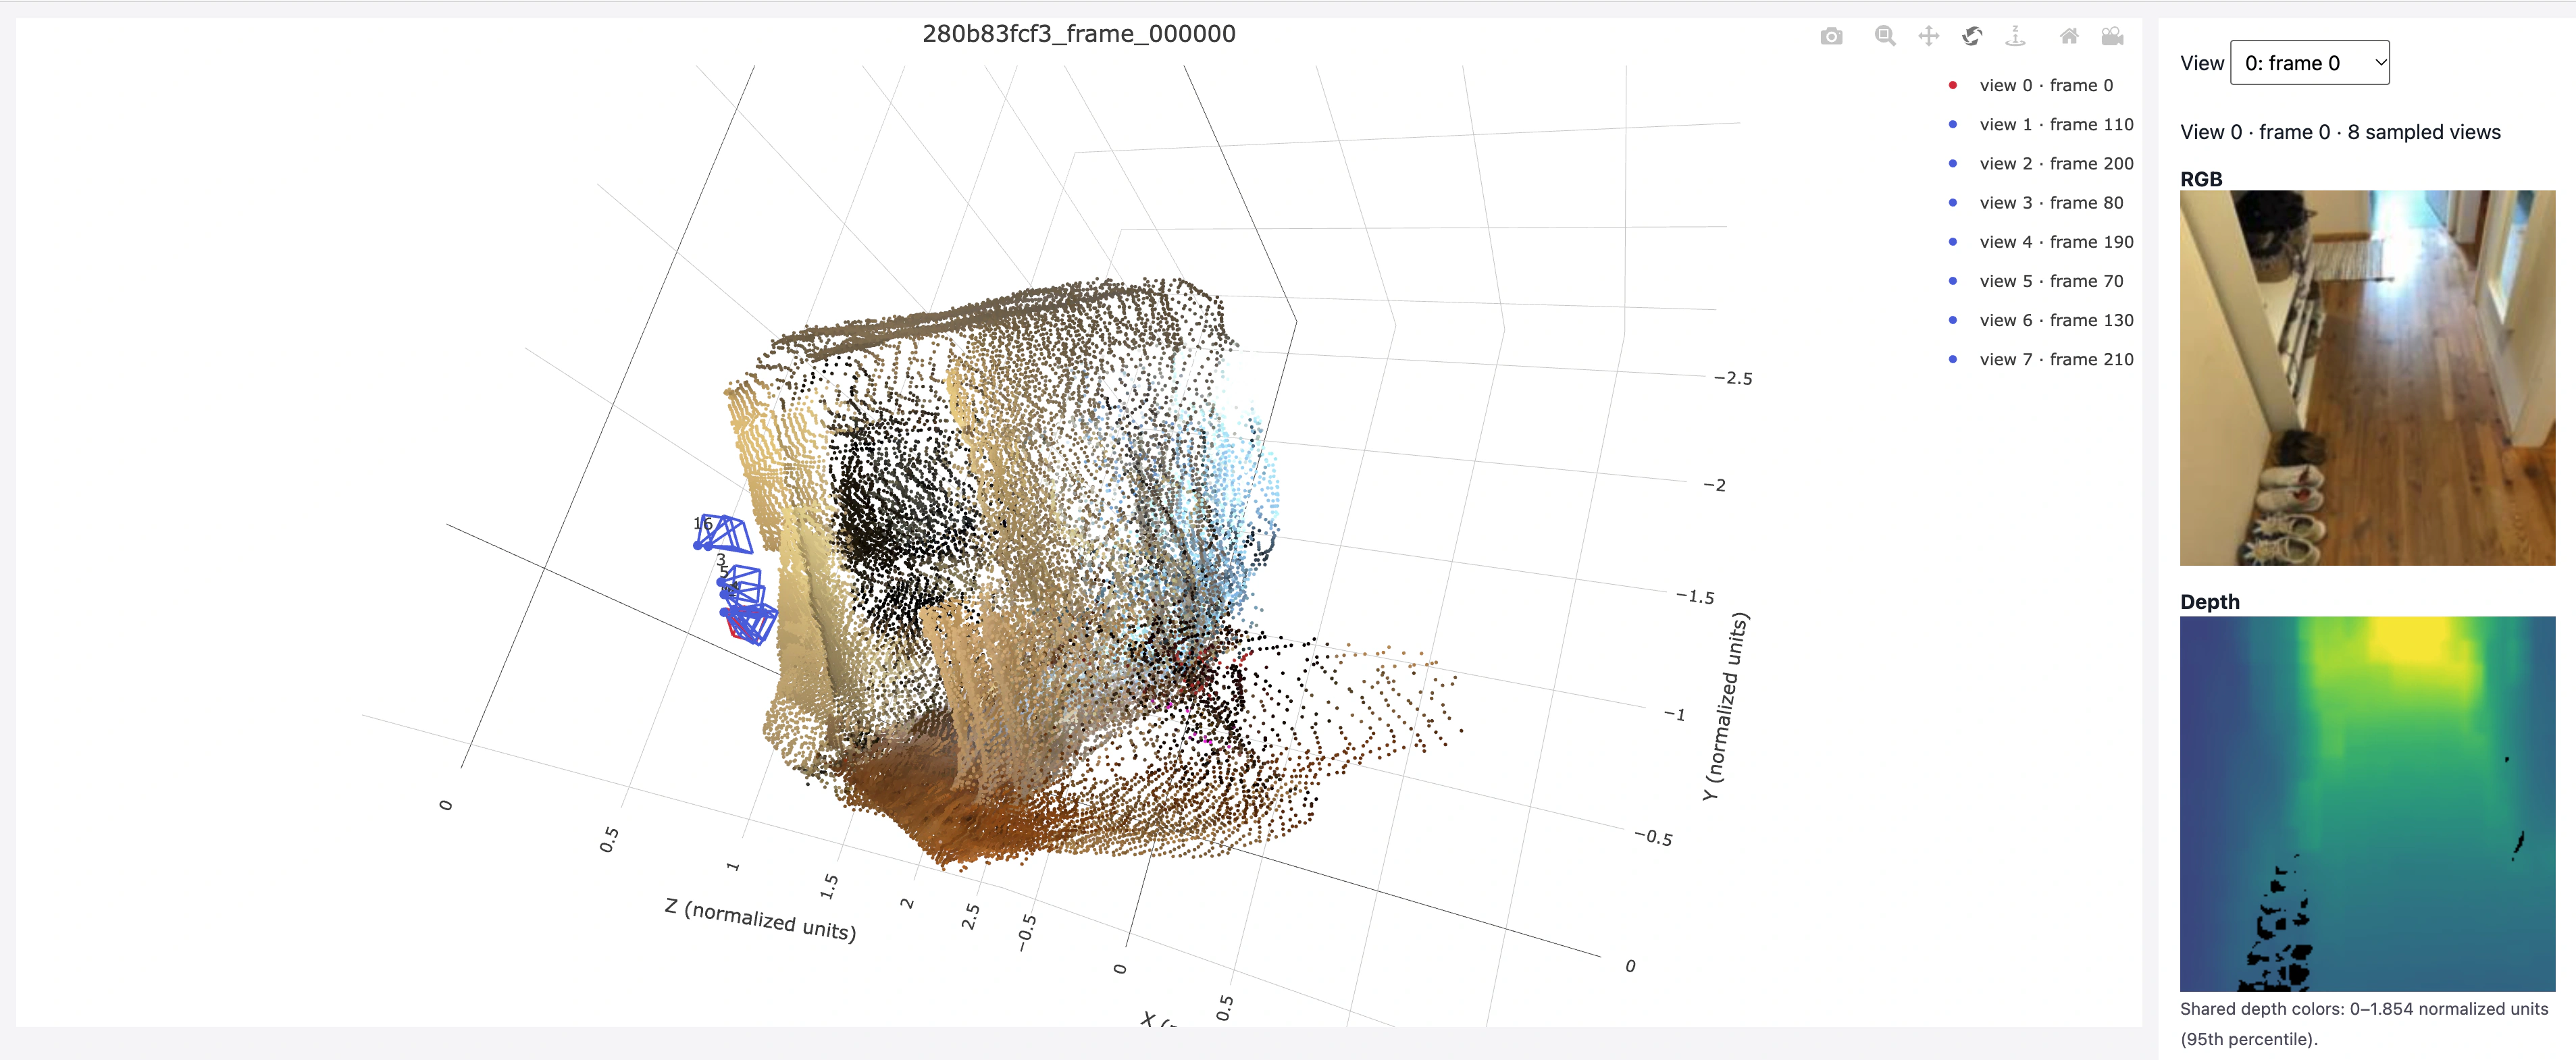
Scene 3: 280b83fcf3_frame_000000
Ground truth:
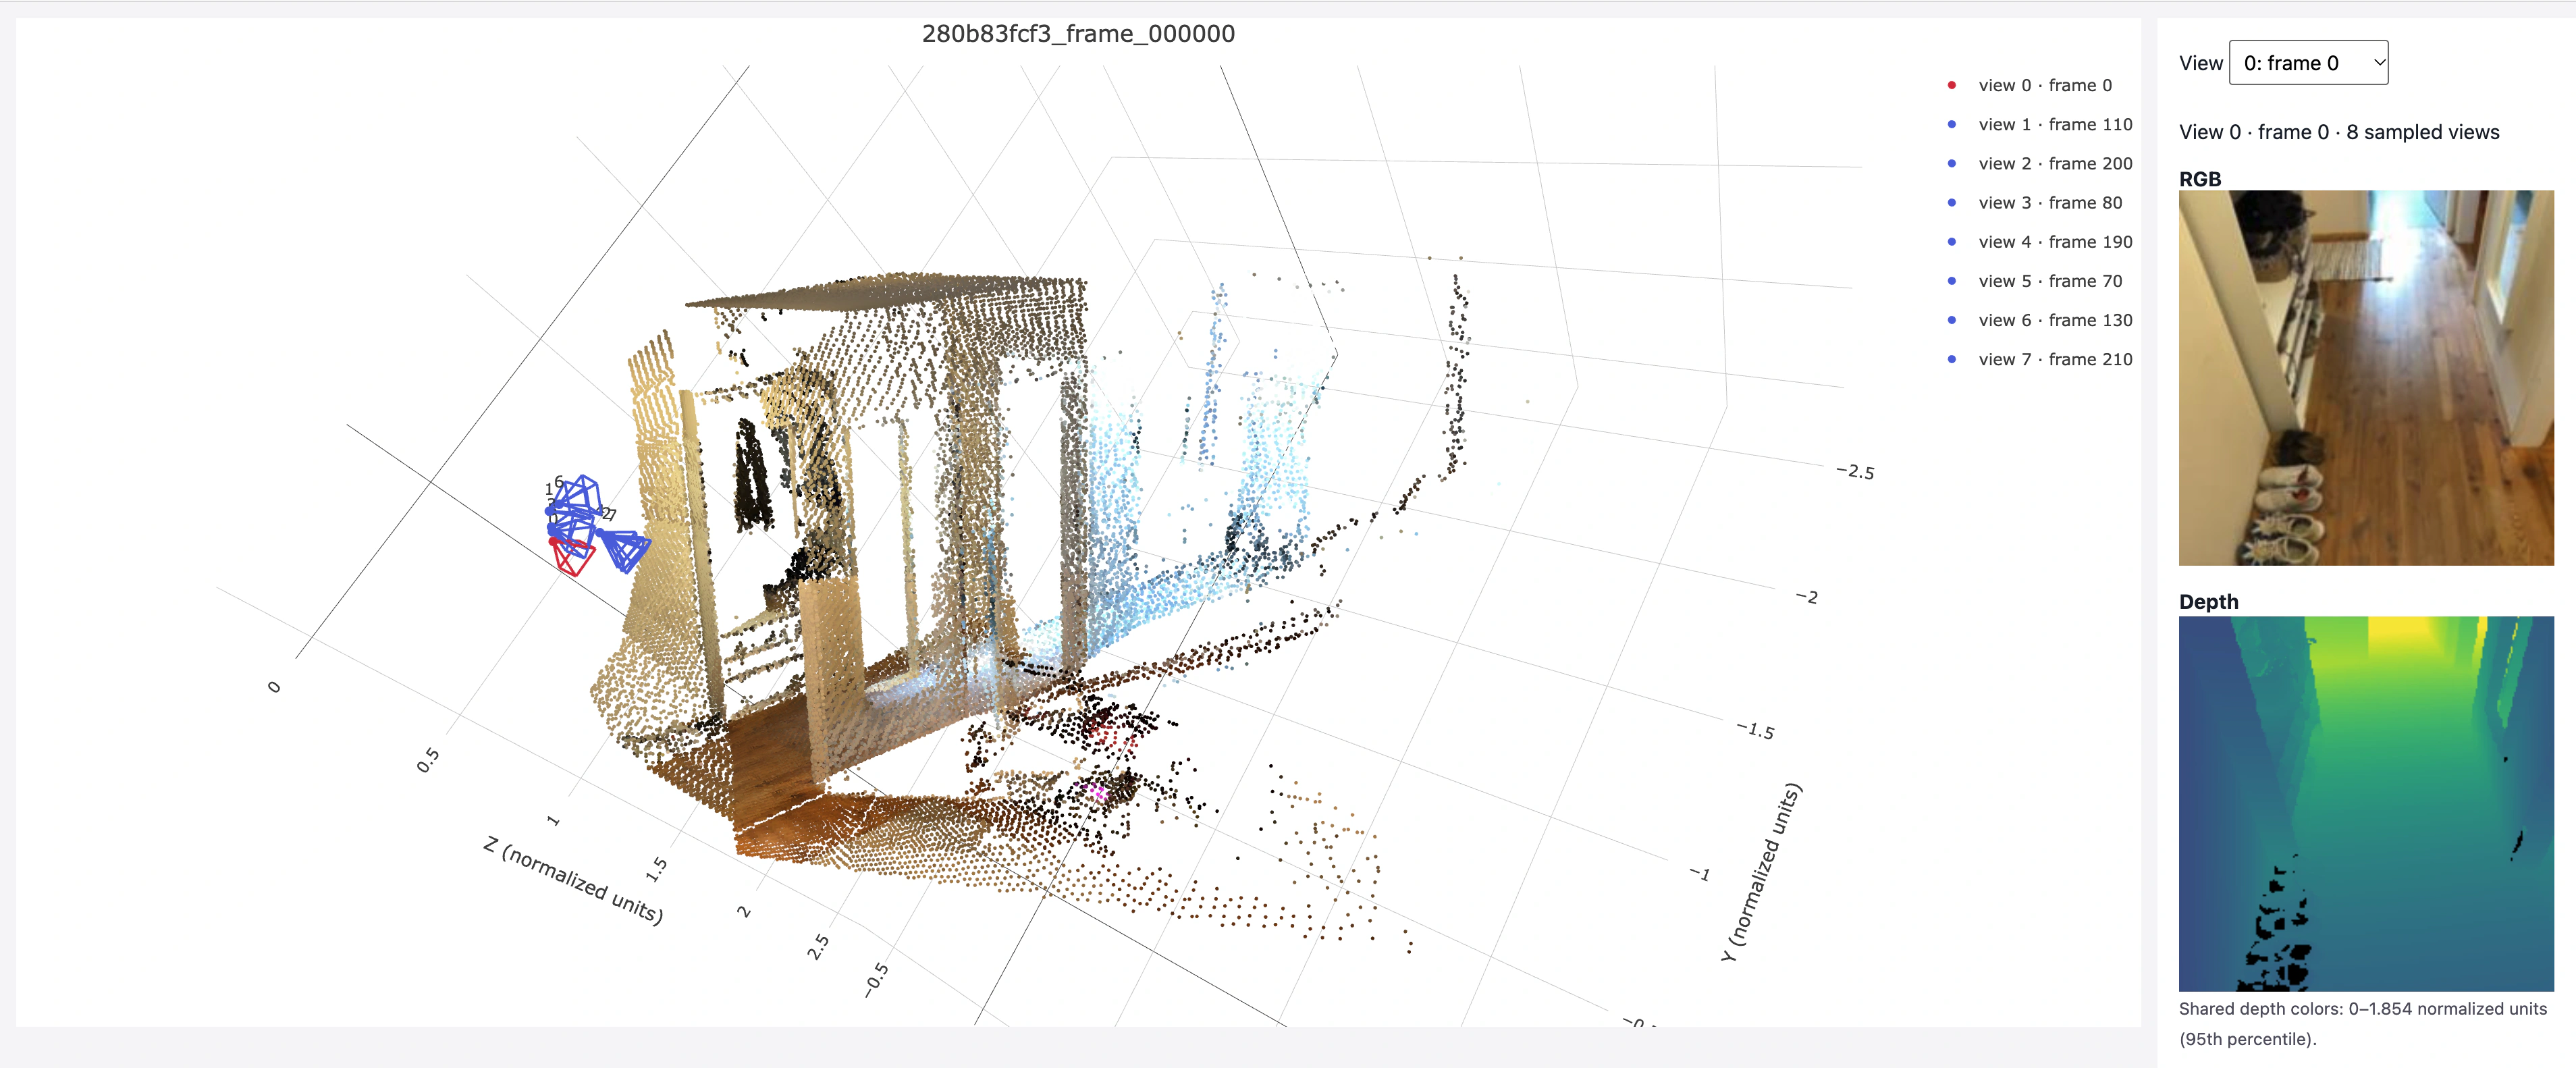
Predicted camera + depth:
Scene 4: 2b1dc6d6a5_frame_000000
Ground truth:
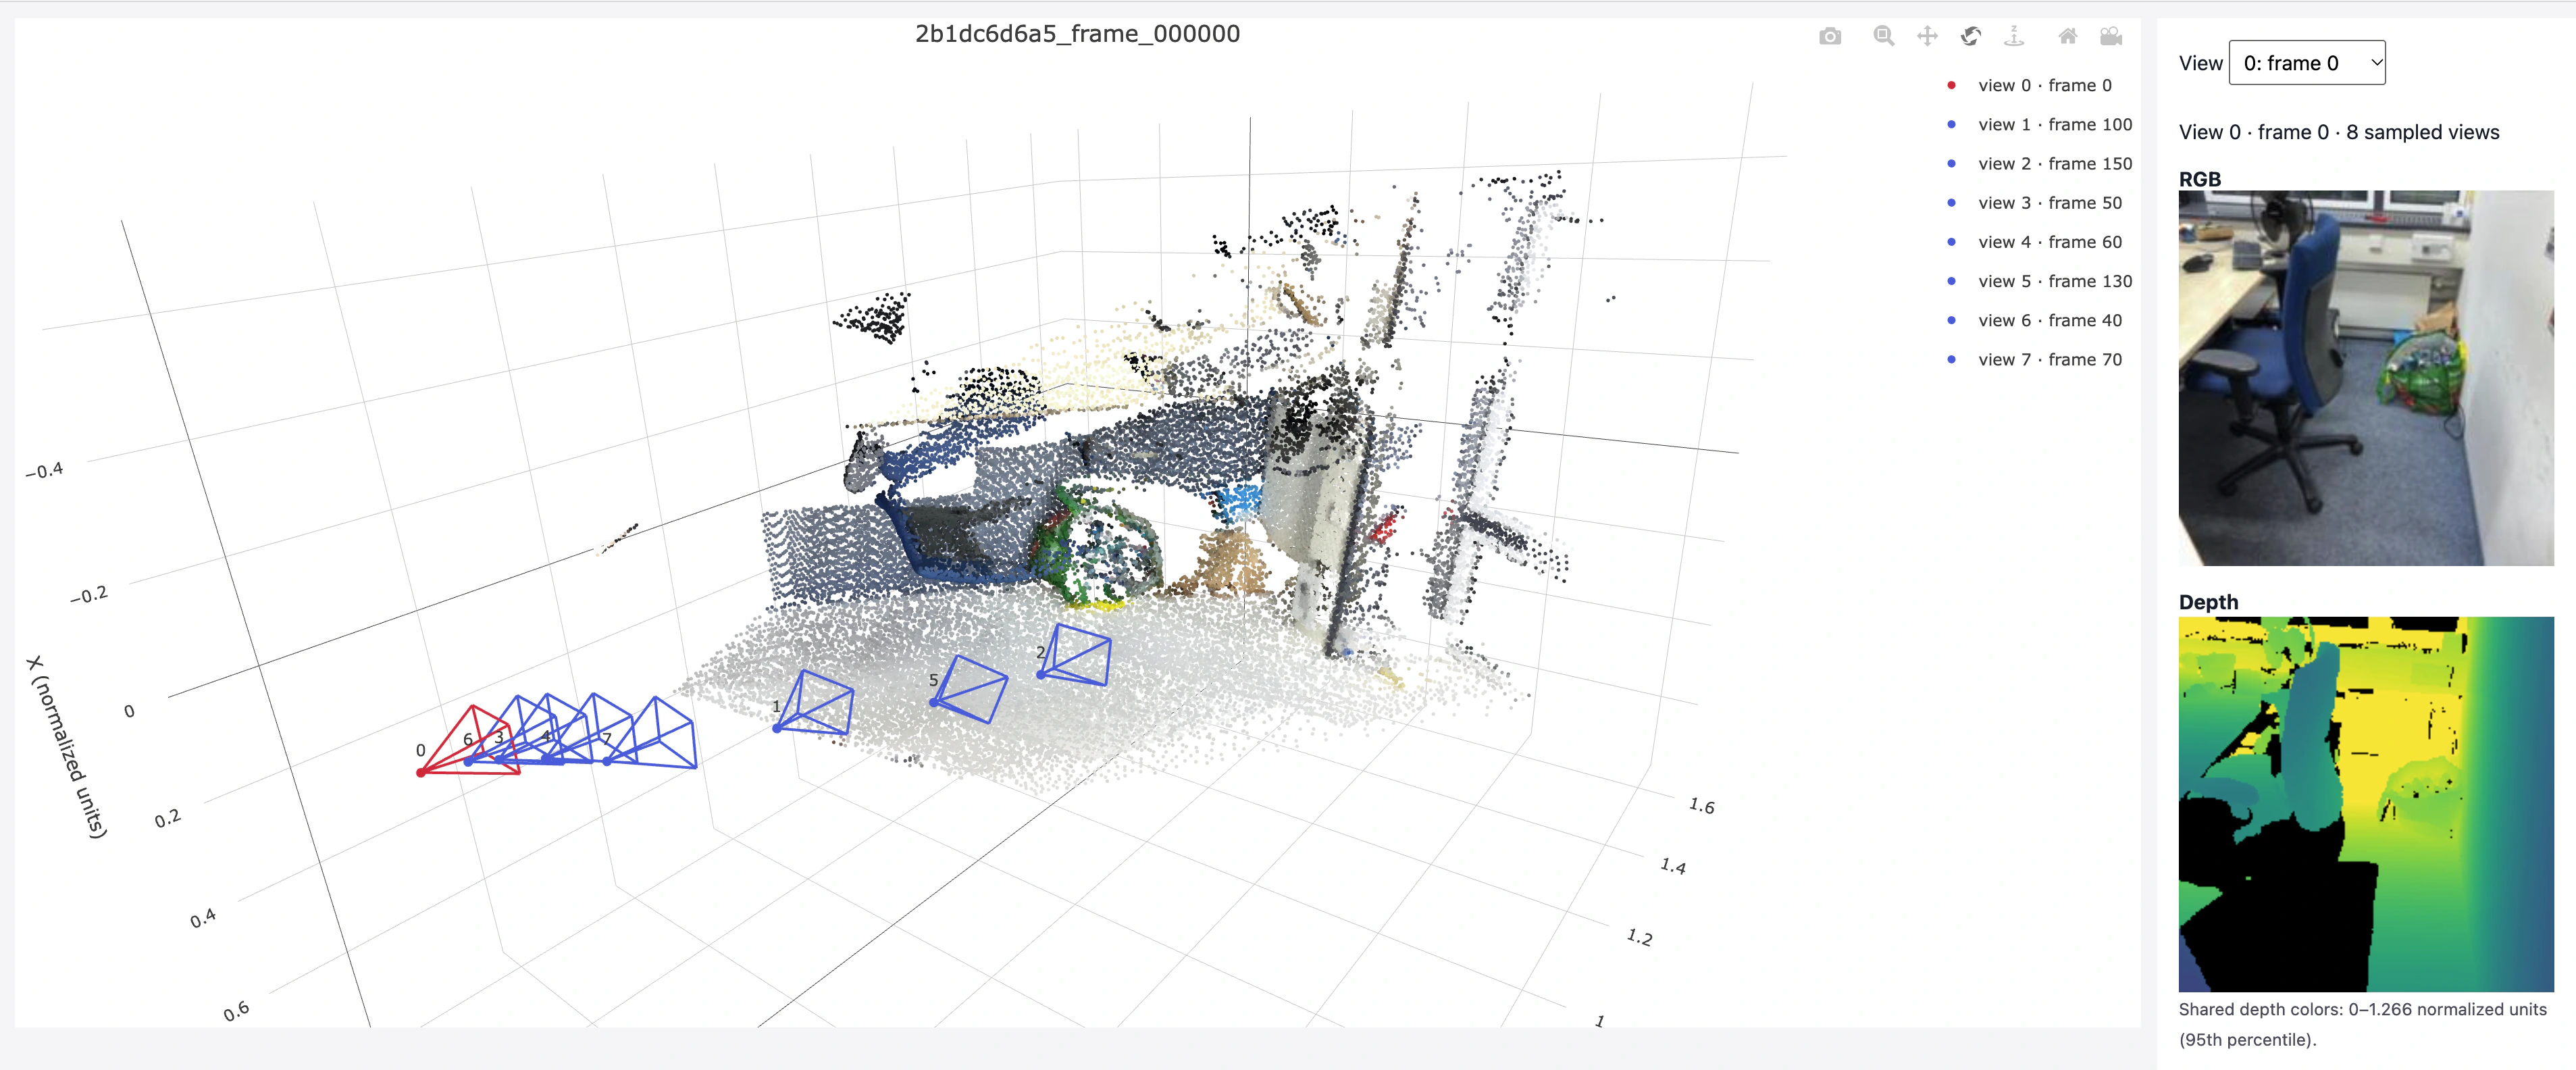
Predicted camera + depth:

Discussion: errors on held-out scenes
Depth error:
As shown in the screenshots, the predictions capture the overall scene structure, but depth boundaries and fine object details are less accurate.
These artifacts are consistent with depth errors and imperfect alignment across views. The depth error on the test set is slightly higher than on the validation set: AbsRel increases from 0.1406 to 0.1466, while δ1 decreases from 0.8336 to 0.8029.
Rotation, translation, and joint pose errors:
Question: How does the number of input views during training affect accuracy and runtime?
Experimental settings: Three VGGT models are trained with 2, 4, and 8 input views per sample. The 8-view baseline from Section 3.2 is reused. All runs use batch size 16, sampling range 32, image resolution 224 × 224, seed 825, and are trained for 1000 epochs. The model architecture and the optimizer settings are the same as Section 3.2. The DINOv2 encoder remains frozen.
The best checkpoint for each run is selected by its validation loss (using the corresponding training view count). All three best checkpoints are further evaluated with 8 input views on the same validation split (the same as Section 3.2). Evaluation uses the first 32 prepared frames. Training and validation runtime is measured by summing the per-epoch times in the logs.
Results:
Runtime includes training and validation over 1,000 epochs. All models are evaluated with 8 views.
| Training views | Depth AbsRel ↓ | Depth δ1 ↑ | Runtime (hours) |
|---|---|---|---|
| 2 | 0.1692 | 0.7726 | 1.22 |
| 4 | 0.1530 | 0.8186 | 1.98 |
| 8 | 0.1406 | 0.8336 | 3.46 |
| Training views | Metric | AUC@5° ↑ | AUC@15° ↑ | AUC@30° ↑ |
|---|---|---|---|---|
| 2 | Rotation | 0.0906 | 0.3372 | 0.5344 |
| 4 | Rotation | 0.2133 | 0.5259 | 0.7056 |
| 8 | Rotation | 0.1770 | 0.4963 | 0.6937 |
| 2 | Translation | 0.0084 | 0.0432 | 0.1111 |
| 4 | Translation | 0.0115 | 0.0740 | 0.1853 |
| 8 | Translation | 0.0110 | 0.0642 | 0.1793 |
| 2 | Joint pose | 0.0023 | 0.0270 | 0.0857 |
| 4 | Joint pose | 0.0054 | 0.0581 | 0.1653 |
| 8 | Joint pose | 0.0020 | 0.0461 | 0.1541 |
The model trained with 8 views achieves the best depth accuracy. The 4-view model performs slightly better than the 8-view model on rotation, translation, and joint pose AUCs.
Training time increases with the number of views: 1.22, 1.98, and 3.46 hours for 2, 4, and 8 views, respectively.
Scene: 09c1414f1b_frame_000000. All predictions use 8 evaluation views.
Ground truth:
Trained with 2 views:
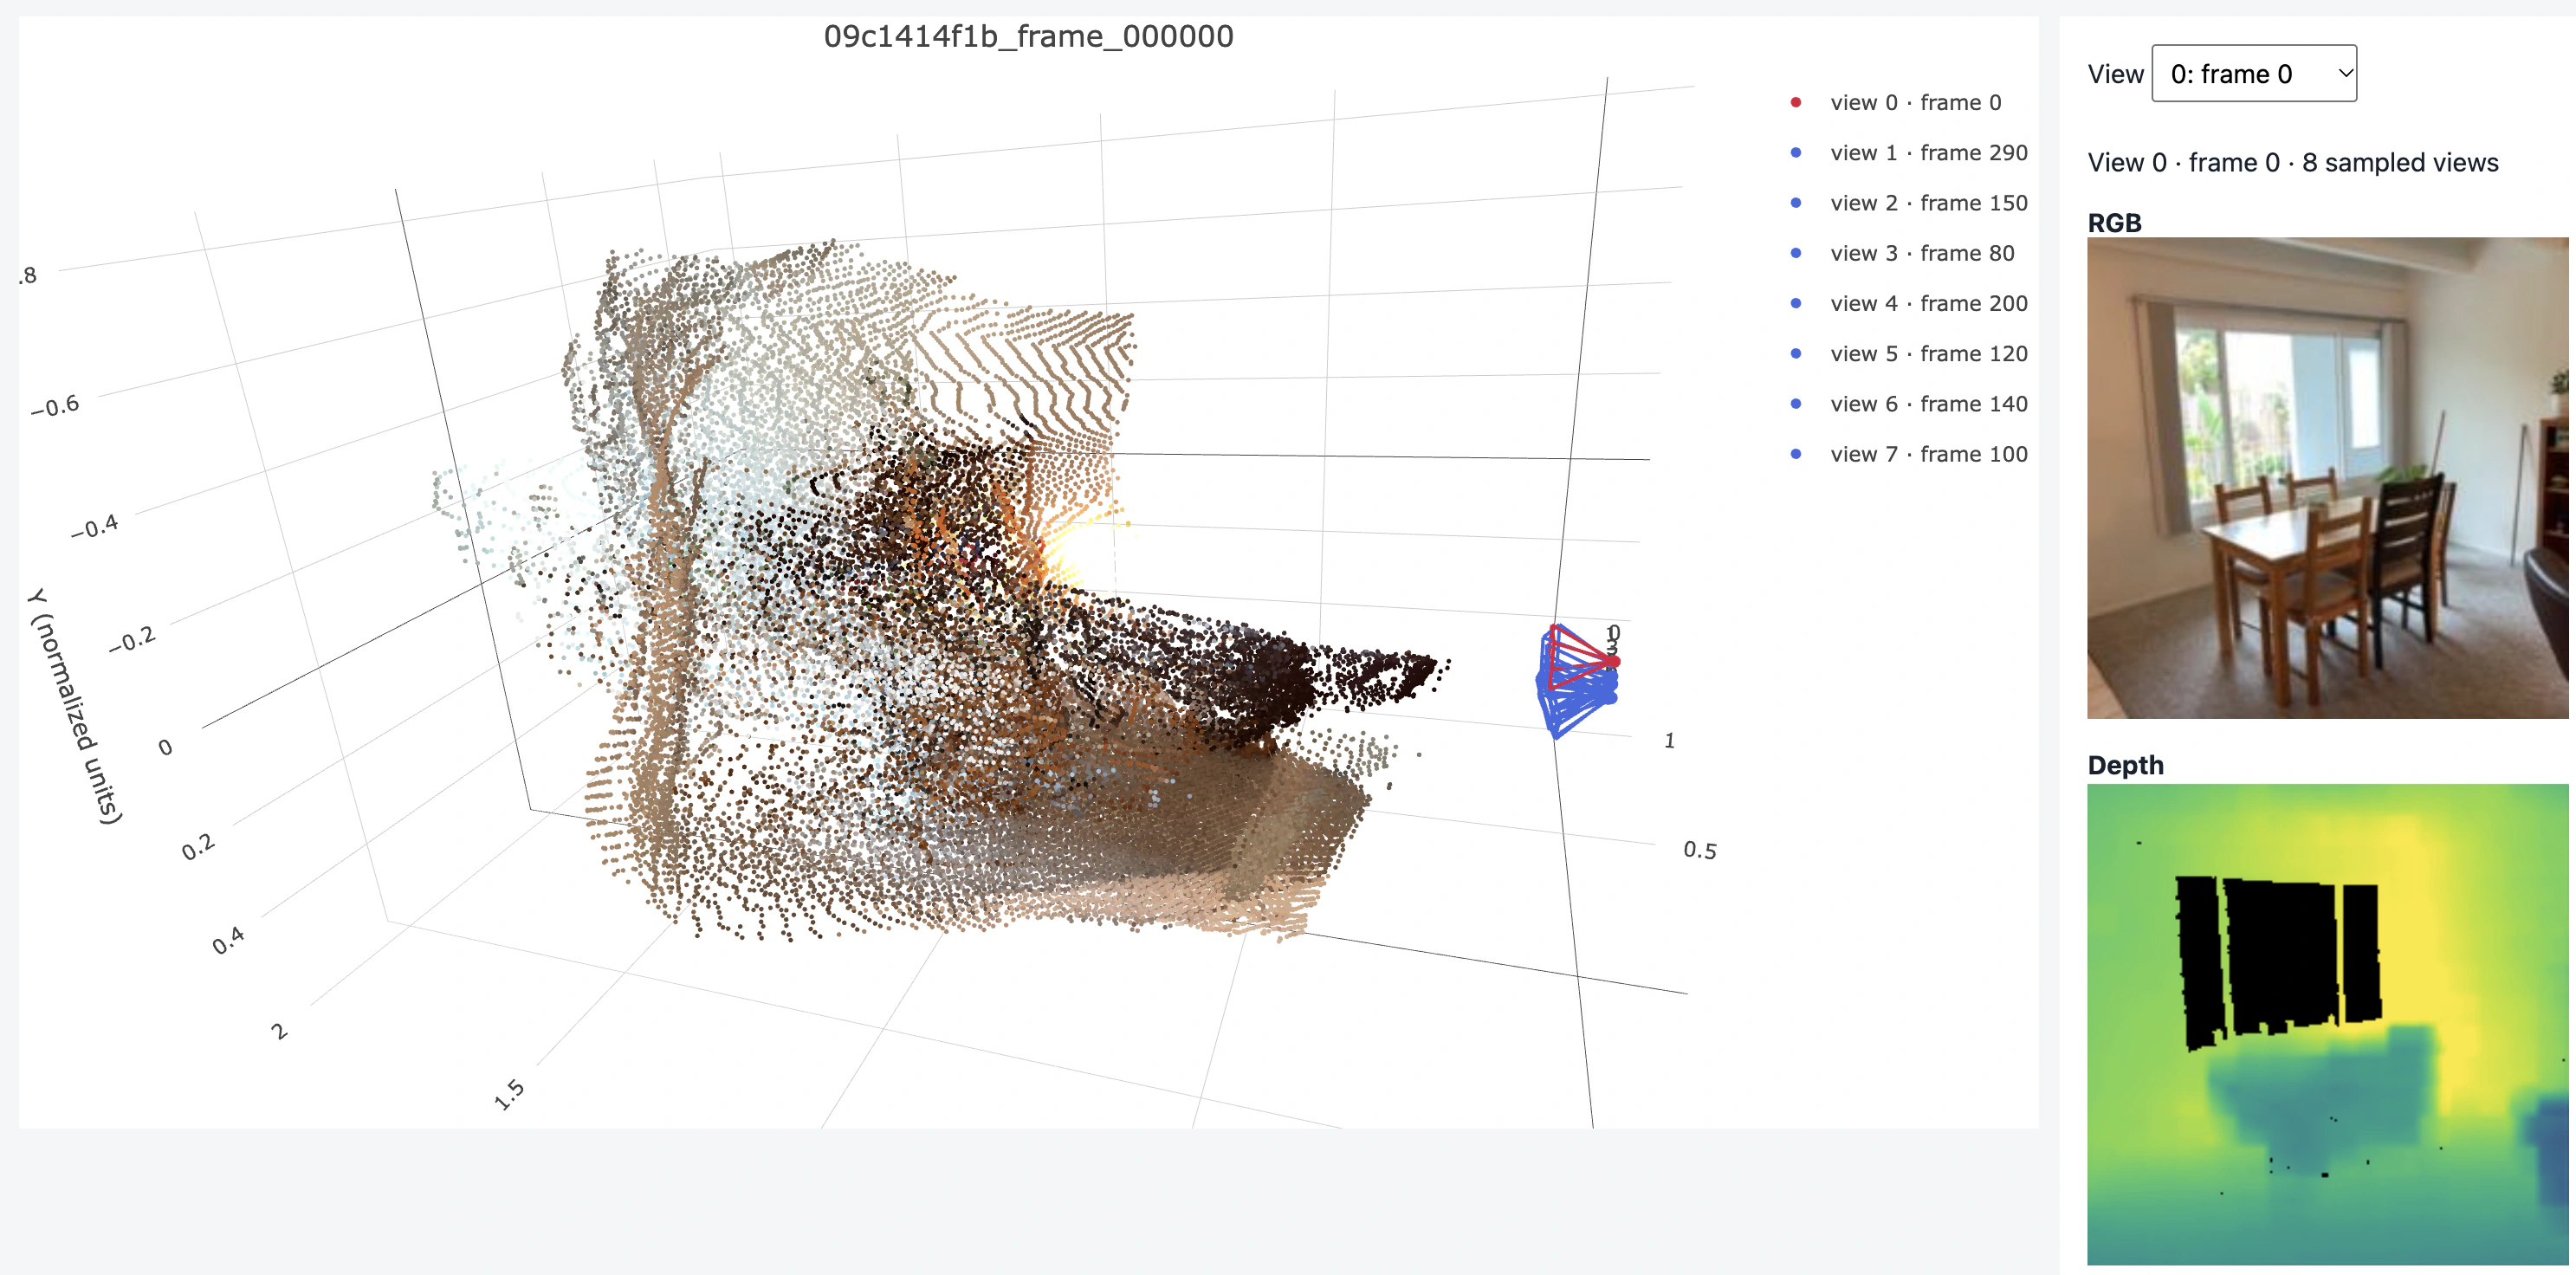
Trained with 4 views:
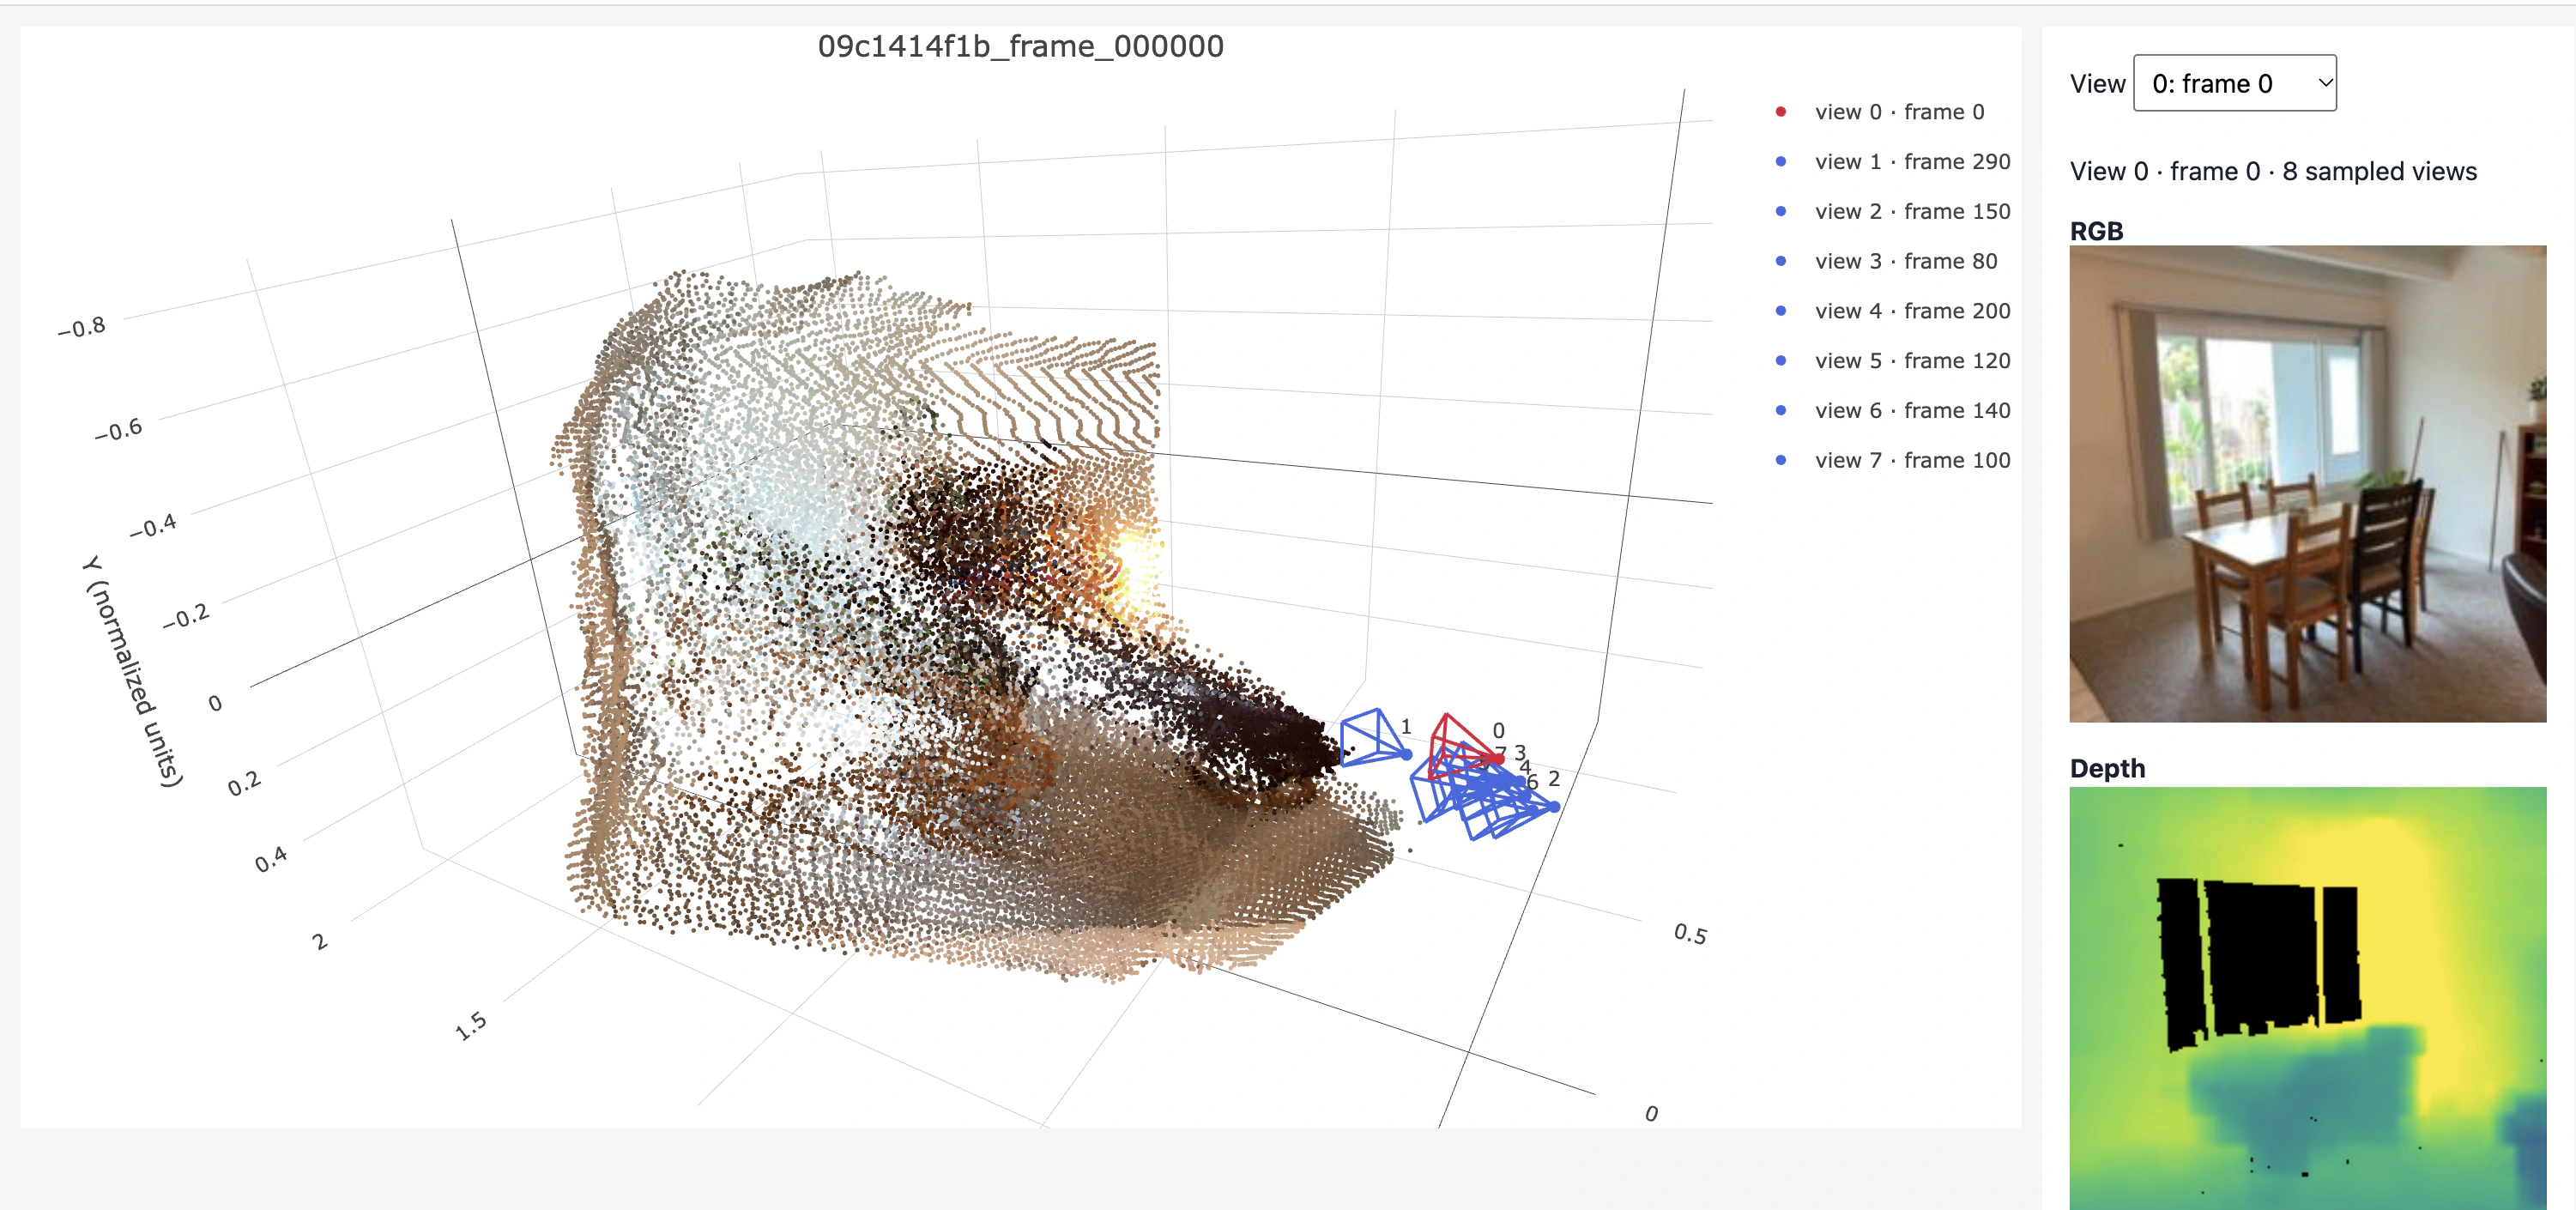
Trained with 8 views:
In this scene, increasing the number of training views produces a more recognizable scene structure, with fewer scattered points and less distorted surfaces. This is consistent with the improved depth accuracy. However, even the 8-view model still shows blurred object boundaries and imperfect alignment compared with GT.
Possible explanation: More views require more image processing and cross-view attention, which increases runtime. More training views provide additional geometric information, which may improve depth prediction. However, more views may also make cross-view aggregation harder, so pose accuracy may not necessarily improve.
Limitations: Each setting uses only one seed, so the small pose differences may reflect training variability. Checkpoints are selected using different validation view counts during training, which may not always align with 8 view evaluation.
Conclusion: In these experiments, increasing the number of training views improves depth accuracy, with 8 views achieving the best results. Training with 4 views gives slightly better pose AUCs than 8 views and takes less time. More training views therefore do not improve every metric and come at a higher runtime cost.