
Object #288
Chair → Chair
Predicted-class probability: 100.00%
The baseline is PointNet without transformation networks. Shared pointwise layers map XYZ coordinates to features, and max pooling produces one global descriptor. An MLP maps this descriptor to three class logits. The predicted class is the largest logit; softmax is used only for displayed probabilities.
The hidden layers use batch normalization and ReLU. The classification head uses dropout with probability 0.3 before its final layer.
| Ground-truth class | Correct / total | Test accuracy |
|---|---|---|
| chair | 617 / 617 | 100.00% |
| vase | 90 / 102 | 88.24% |
| lamp | 215 / 234 | 91.88% |
| Overall | 922 / 953 | 96.75% |
Five objects were sampled without replacement using a fixed seed. This selection includes an incorrect prediction; it was not filtered to show only successes.
Predicted-class probability: 100.00%

Predicted-class probability: 100.00%

Predicted-class probability: 100.00%

Predicted-class probability: 100.00%

Predicted-class probability: 79.57%

This vase has a tall, narrow body and a small top detail. Its elongated silhouette resembles a stem or pedestal, which may explain the lamp prediction. This is a visual hypothesis; the prediction alone does not identify the feature that caused the error.

This lamp has a broad, hollow-looking shade above a compact base. Without color or material cues, that rounded form resembles a container. The nearly 100% predicted probability shows that a confident prediction can still be incorrect.
No chair failure exists in this evaluation. All 617 test chairs are classified correctly. Therefore, I cannot show the requested misclassified chair for Q1. A lamp predicted as a chair would still be a lamp failure, not a chair failure.
The random lamp #944 is also mistaken for a vase. Its flared, bowl-like shape is consistent with the same lamp–vase ambiguity. Of the 31 total errors, 30 are between lamps and vases; the remaining error is a lamp predicted as a chair.
Rows are ground truth; columns are predictions.
| GT / prediction | Chair | Vase | Lamp |
|---|---|---|---|
| Chair | 617 | 0 | 0 |
| Vase | 0 | 90 | 12 |
| Lamp | 1 | 18 | 215 |
The segmentation model uses the same PointNet feature extractor. Each point's 64-channel local feature is concatenated with the repeated 1024-channel global descriptor. Shared layers predict six logits per point, preserving the original point order.
Test point accuracy: 90.04%, measured over all 617 test chairs and all 10,000 points per chair. Colors represent part IDs; the dataset does not supply semantic names for these IDs.
The two poor examples are the lowest-accuracy test objects. The three random objects were selected from the remaining test set. Each pair shows ground truth on the left and prediction on the right.


The model preserves the main cyan back, red seat region, and blue supports. At this view, most large regions agree with the ground truth; the remaining errors are less apparent in the overview than in the point accuracy.


The curved cyan back and thin blue legs are recovered well. The red seat remains distinct from the neighboring regions, showing that the baseline can handle this slender structure.


The tall cyan back, red seat, and blue base are mostly consistent with the labels. Small differences around the seat boundary remain, but the overall partition is close to the ground truth.


The lower portions of the yellow side panels are largely reassigned to blue. The model appears to extend the lower-support pattern to these continuous panels. This unusual enclosing geometry is a major failure despite the relatively recognizable upper regions.


Much of the yellow side region is predicted as red, while the magenta strip at the top is replaced by cyan. These errors merge distinct labeled parts into larger neighboring regions, producing only about 50% accuracy.
Both experiments reuse the trained Q1 and Q2 checkpoints without fine-tuning. They evaluate the full test splits and keep object identities fixed across conditions. The zero-rotation and 10,000-point baselines reproduce the original test accuracies.
Each point cloud is rotated by 0°, 15°, 30°, 60°, or 90° about the x axis. The data is Y-up, so these rotations tilt objects away from their upright orientation. The same rotation is applied to all points; segmentation labels remain attached to their points.
| Rotation | Classification | Change (pp) | Segmentation | Change (pp) |
|---|---|---|---|---|
| 0° | 96.75% | +0.00 | 90.04% | +0.00 |
| 15° | 95.28% | -1.47 | 83.16% | -6.88 |
| 30° | 79.22% | -17.52 | 70.15% | -19.89 |
| 60° | 31.06% | -65.69 | 49.57% | -40.47 |
| 90° | 26.55% | -70.20 | 28.27% | -61.77 |


Interpretation. At 30°, classification drops by 17.52 percentage points and segmentation by 19.89. At 90°, both tasks are below 30% accuracy. PointNet’s symmetric pooling handles point order, but it does not guarantee rotation invariance. The results are consistent with a reliance on the canonical training orientation.
Chair #479 switches to lamp at 60° and vase at 90°, while lamp #909 remains correct at every angle. Thus, robustness varies by shape. In segmentation, tilted backs are often recolored red and other regions change identity despite unchanged geometry; #309 falls from about 94.6% to 32.4% accuracy.
For each object, a seed-0 random permutation defines nested subsets of 10,000, 5,000, 2,500, and 1,250 points, sampled without replacement. The same indices select segmentation labels. Segmentation accuracy is measured only on the retained points, not on a reconstructed full cloud.
| Input points | Classification | Change (pp) | Segmentation | Change (pp) |
|---|---|---|---|---|
| 10000 | 96.75% | +0.00 | 90.04% | +0.00 |
| 5000 | 96.85% | +0.10 | 90.12% | +0.08 |
| 2500 | 96.64% | -0.10 | 90.08% | +0.04 |
| 1250 | 96.85% | +0.10 | 89.67% | -0.37 |
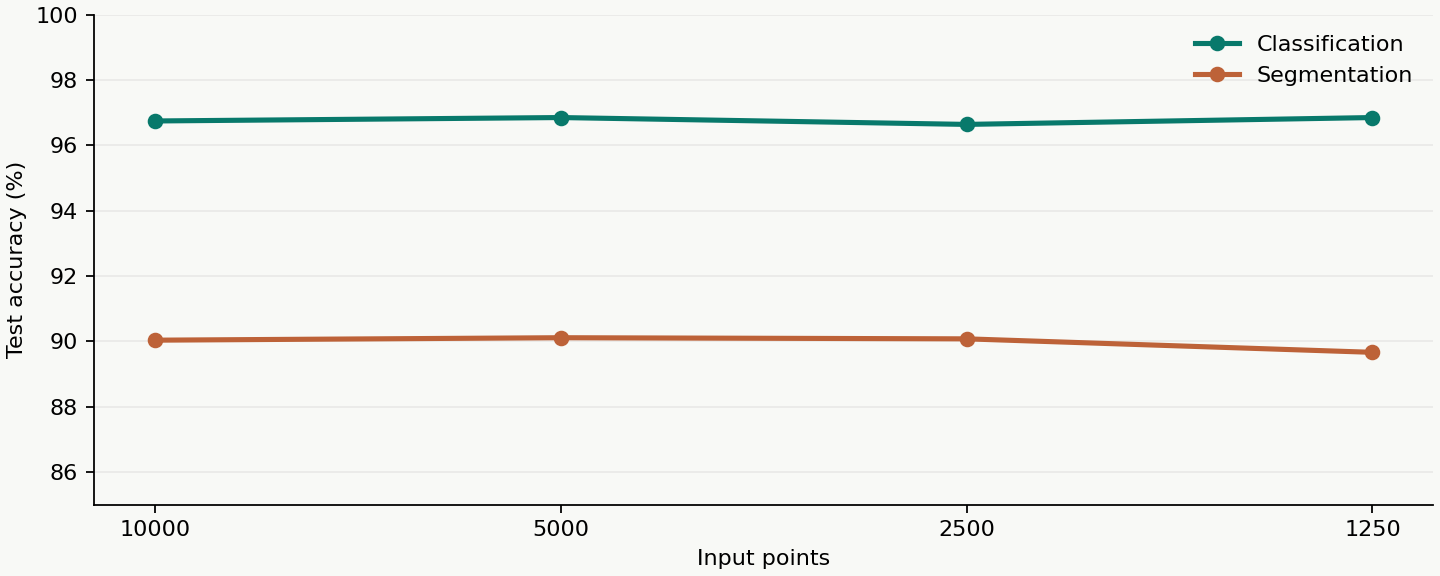
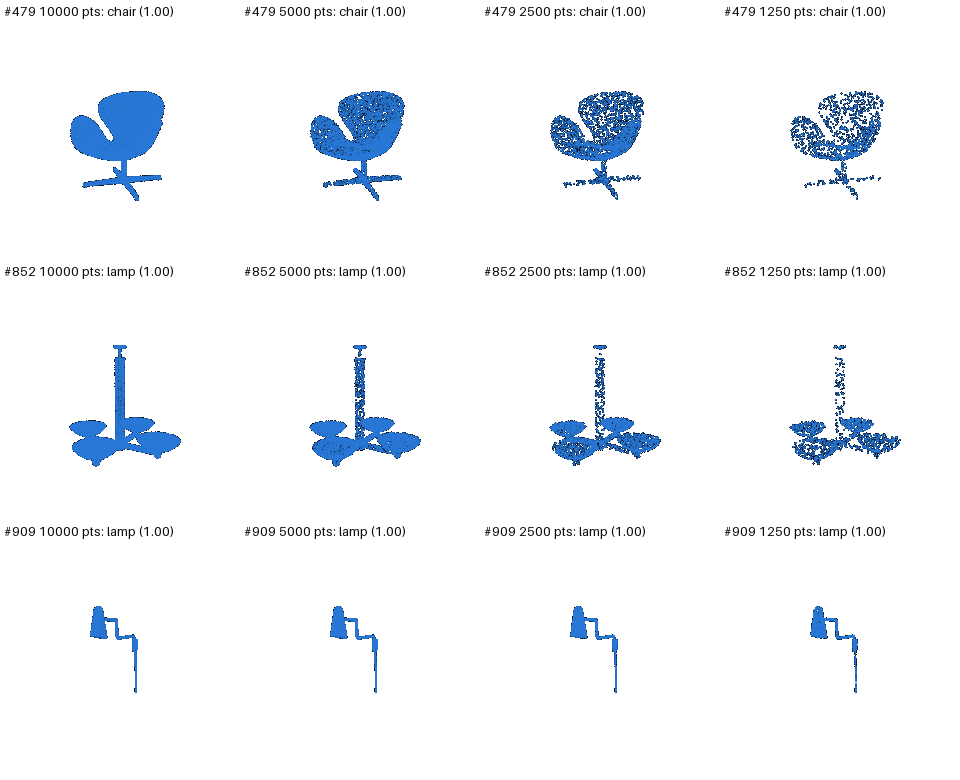
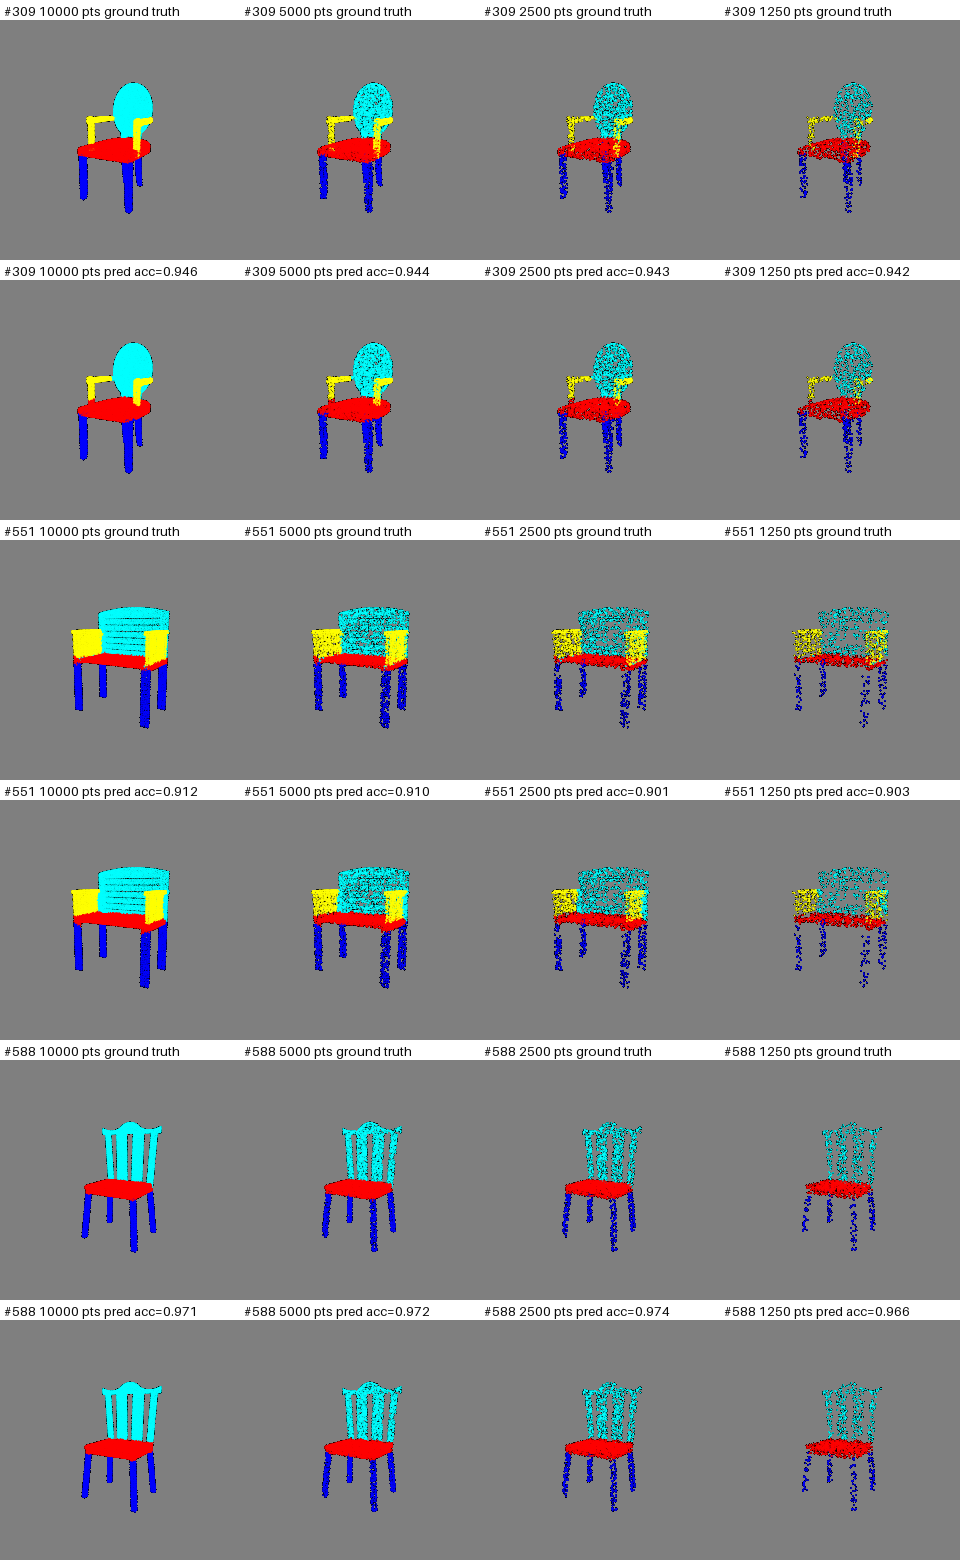
Interpretation. Removing 87.5% of the points changes classification accuracy by only +0.10 percentage points and segmentation by −0.37. The retained points still describe the overall shape and large part regions. The visualizations show increasingly sparse clouds but largely stable labels; for example, #588 remains above 96% accuracy.
The small increases at some point counts do not establish that fewer points improve the model. This is one deterministic sampling trial, and the segmentation evaluation set itself changes with the retained points. The experiment supports robustness to this degree of uniform subsampling, not to arbitrary missing regions or extreme sparsity.
I implemented a compact hierarchical Point Transformer and trained separate classification and segmentation models from scratch. No pretrained checkpoint is used. Unlike the baseline’s shared pointwise MLPs, each attention layer exchanges features within a 16-neighbor XYZ neighborhood.
| Encoder level | Points | Channels |
|---|---|---|
| 0 | 10,000 | 32 |
| 1 | 2,500 | 64 |
| 2 | 625 | 128 |
| 3 | 156 | 256 |
| 4 | 39 | 512 |
An initial Linear–BN–ReLU layer embeds XYZ into 32 channels. Each level contains one residual Point Transformer block. Between levels, farthest-point sampling reduces the number of points by approximately four. For each sampled center, a shared MLP processes its neighbors’ features together with relative coordinates, then max pooling produces the new feature.
Queries, keys, and values are learned linear projections. The position and attention MLPs have separate parameters. Attention weights are vectors: for each feature channel, the weights sum to one over the local neighbors. A residual connection combines the attention output with the input feature.
Classification: mean pooling over the final 39 points yields a 512-channel descriptor. The classification head is 512 → 256 → 128 → 3, with BN, ReLU, and dropout 0.5 in its hidden stages.
Segmentation: four decoder stages restore 39 → 156 → 625 → 2,500 → 10,000 points. Each stage projects coarse features to the finer channel width using Linear–BN–ReLU, interpolates them using inverse-distance weights from the three nearest coarse points, and adds a learned linear projection of the saved encoder features. Another local attention block refines this sum. A 32 → 32 → 6 pointwise head predicts the final labels.
The interpolation weights sum to one. If a fine point exactly coincides with a coarse point, it copies that point’s projected feature. Encoder skip connections preserve fine-scale information that would otherwise be lost during downsampling.
| Task | PointNet | Point Transformer | Change |
|---|---|---|---|
| Classification | 96.75% | 97.90% | +1.15 pp |
| Segmentation | 90.04% | 92.76% | +2.72 pp |
Both methods use the same train/validation splits, 10,000 points per object, and seed-0 evaluation ordering. Classification uses the same 953 objects; segmentation compares identical point indices on all 617 chairs. Although the evaluator calls this a “subset,” at 10,000 input points it includes every point of each stored test object.

Q4 corrects 24 Q1 mistakes but introduces 13 new mistakes, giving 11 more correct objects overall. Lamps #812 and #770, previously predicted as vases, are now classified correctly; their shade-and-base geometry is more evident than in the persistent failure #827. The random lamp #944 is also corrected.
The gains are not universal: vases #620 and #664 switch from correct Q1 predictions to lamps. Chair #445 is predicted as a vase, despite Q1 recognizing it correctly. Its pedestal form is visually unusual for a chair. These examples suggest that local shape cues can help disambiguate some objects while similar local geometry remains ambiguous across classes.
| Class | Q1 accuracy | Q4 accuracy |
|---|---|---|
| Chair | 100.00% | 99.68% |
| Vase | 88.24% | 91.18% |
| Lamp | 91.88% | 96.15% |
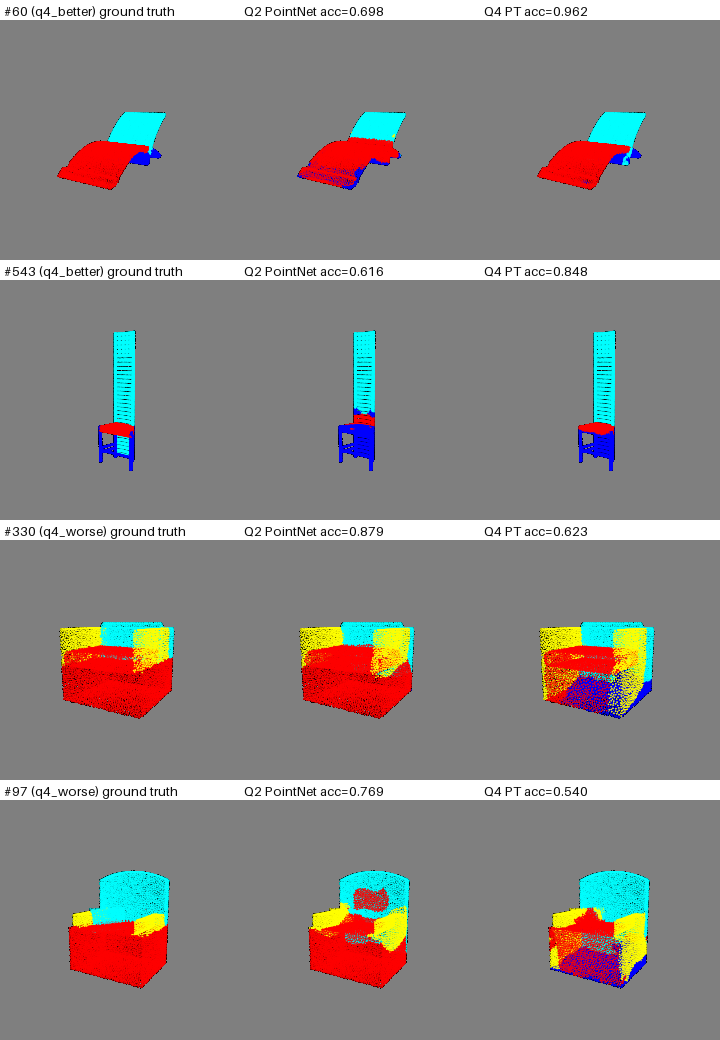
The first five objects below are exactly the Q2 selections. Each row shows ground truth, PointNet, and Point Transformer, using the same part colors and camera settings.


All five shared examples improve. On #26, Q4 restores much of the yellow side region, raising accuracy from 49.84% to 68.15%, although the magenta top remains missing. On #351, accuracy improves only from 46.20% to 50.57%; the incorrect blue labeling on the lower side panels largely persists.
| Object | PointNet | Point Transformer | Change (pp) |
|---|---|---|---|
| 60 | 69.75% | 96.24% | +26.49 |
| 543 | 61.59% | 84.82% | +23.23 |
| 330 | 87.94% | 62.28% | -25.66 |
| 97 | 76.86% | 54.02% | -22.84 |
For #60, Q4 removes much of the spurious blue region on the red surface. For the very tall chair #543, it recovers more of the cyan structure near the lower back. Conversely, on #330 and #97, Q4 introduces substantial blue regions where the ground truth is red. Overall, Q4 improves 504 of 617 chairs and performs worse on 113.
| Part ID | Color | Q2 recall / accuracy | Q4 recall / accuracy |
|---|---|---|---|
| 0 | white | 83.92% | 94.40% |
| 1 | magenta | 14.85% | 15.96% |
| 2 | cyan | 92.32% | 95.14% |
| 3 | yellow | 75.07% | 83.58% |
| 4 | blue | 89.14% | 93.04% |
| 5 | red | 92.50% | 93.05% |
These per-part values are the fraction of ground-truth points of that part predicted correctly. Part 1 remains difficult: Q4 reaches only 15.96%, despite 92.76% overall accuracy. It accounts for just 7,865 of the 6,170,000 test points, and most of its errors are predictions of part 2. Thus, the overall metric is dominated by more frequent parts.
Scope of the comparison. The result supports this compact Transformer as a stronger model on these test splits. It is not a controlled ablation of attention alone: the hierarchy, decoder, parameter count, pooling, and dropout also differ from PointNet. Only one training seed was evaluated, and Q3 robustness experiments were not repeated for Q4.
All four models were trained for 250 epochs with Adam (learning rate 0.001, β₁ = 0.9, β₂ = 0.999), batch size 32, and 10,000 points per object. Cross-entropy is applied to class logits or per-point part logits. Training uses seed 0 and a fixed 10% validation holdout; classification is stratified. Checkpoints are selected by validation accuracy, not test accuracy.
| Task | Training objects | Validation objects | Test objects |
|---|---|---|---|
| Classification | 6,106 | 678 | 953 |
| Segmentation | 4,040 | 449 | 617 |
| Model / task | Best epoch (zero-based) | Best validation accuracy | Test accuracy |
|---|---|---|---|
| PointNet / classification | 109 | 97.79% | 96.75% |
| PointNet / segmentation | 248 | 89.14% | 90.04% |
| Transformer / classification | 214 | 98.67% | 97.90% |
| Transformer / segmentation | 155 | 92.43% | 92.76% |
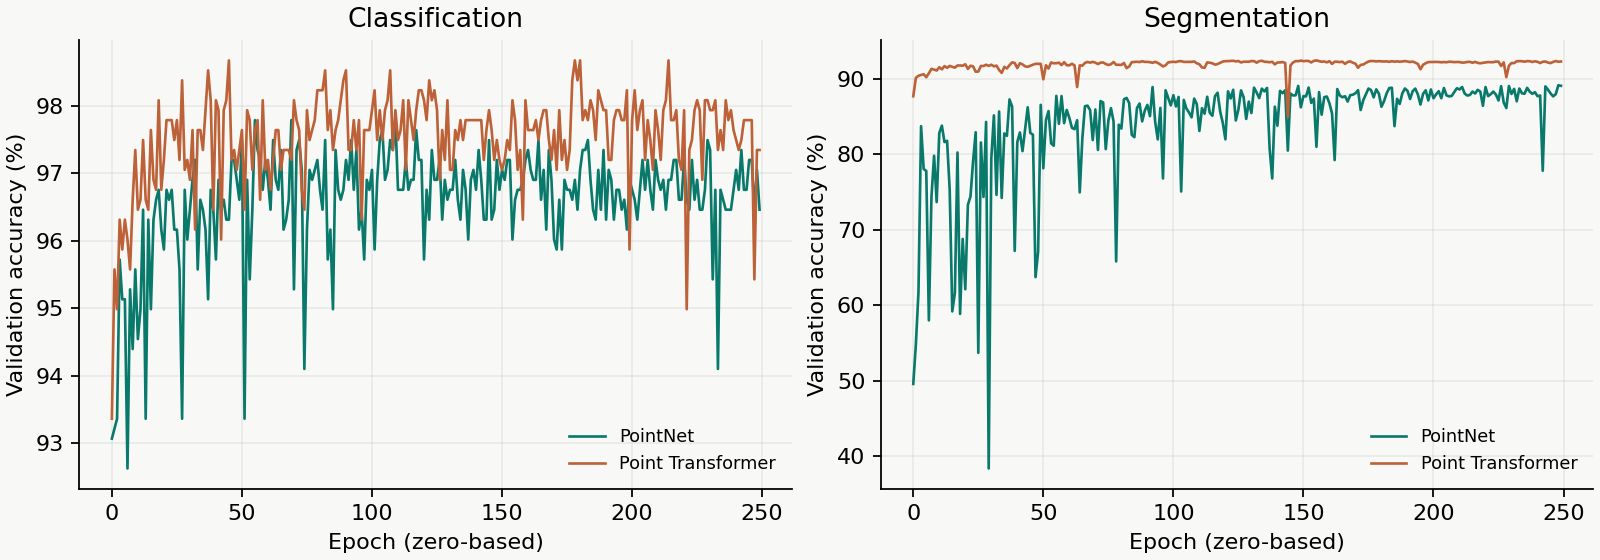
The Transformer segmentation run was interrupted and resumed; its saved history contains all 250 epochs. Q4 ran on an NVIDIA GB10 in the existing Docker environment (PyTorch 2.10.0+cu130, PyTorch3D 0.7.9). Its recorded epochs took approximately 136 seconds for classification and 161 seconds for segmentation. Evaluation uses model.eval() and the best saved checkpoint.