

Every model uses a ResNet18 encoder and a small decoder. All runs train for 10,001 iterations with batch size 32 and Adam at a learning rate of 0.0004. The mesh initialization ablation uses 5,001 iterations. Point cloud models use 5,000 points and the mesh model uses a smoothness weight of 0.001.


F1@0.05 = 62.2
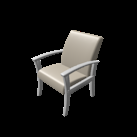
F1 above is the average over the whole test set. The three chairs shown (test indices 402, 2, 275, fixed input view 0) are the same ones used for every model in sections 2 and 3. Per-chair F1@0.05 = 98.9, 79.4, 79.1.


F1@0.05 = 87.4


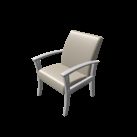


F1@0.05 = 74.5




| Representation | F1@0.05 (test set) |
|---|---|
| Voxel grid (32^3) | 62.2 |
| Point cloud | 87.4 |
| Mesh | 74.5 |
Point clouds (87.4) can cover thin legs and armrests without maintaining connected faces. Meshes (74.5) retain sphere connectivity, while smoothing can suppress fine detail. The 32^3 voxel grid (62.2) can merge or miss thin parts, as seen in chairs 2 and 275. F1 measures surface proximity, so diffuse points and folded meshes can still score well. Individual rankings vary: voxels outperform meshes on chairs 402 and 2.
The same three chairs, every representation side by side (per-chair F1@0.05 under each prediction).
| Input | Voxel grid | Point cloud | Mesh | Ground truth |
|---|---|---|---|---|
Chair 402 | F1 98.9 | F1 99.4 | F1 87.7 | |
Chair 2 | F1 79.4 | F1 94.2 | F1 73.1 | |
Chair 275 | F1 79.1 | F1 97.8 | F1 91.6 | |
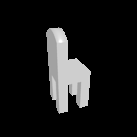
Hyperparameter varied: the initial mesh shape, with three templates: an ico-sphere (ico4), a stretched sphere (stretch, y scaled by 1.5) and a cube-like shape (cube, sphere vertices projected onto a cube). Each was trained for 5,001 iterations.
After 5,001 iterations the average F1@0.05 over the test set is 73.2 for ico4, 71.2 for stretch and 72.8 for cube. The same three chairs as the rest of the page are shown, with per-chair F1@0.05 under each prediction.
| Input | ico4 (F1 73.2) | stretch (F1 71.2) | cube (F1 72.8) | Ground truth |
|---|---|---|---|---|
| Starting shape |  | 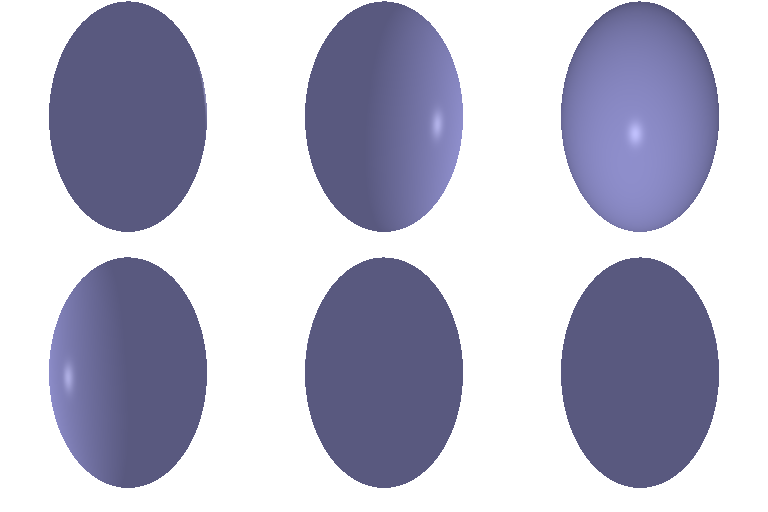 | 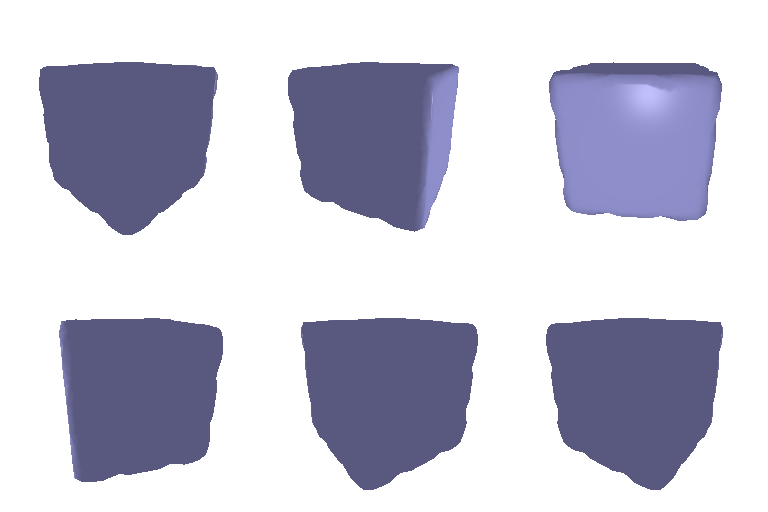 | |
Chair 402 |  F1 82.1 |  F1 88.2 | 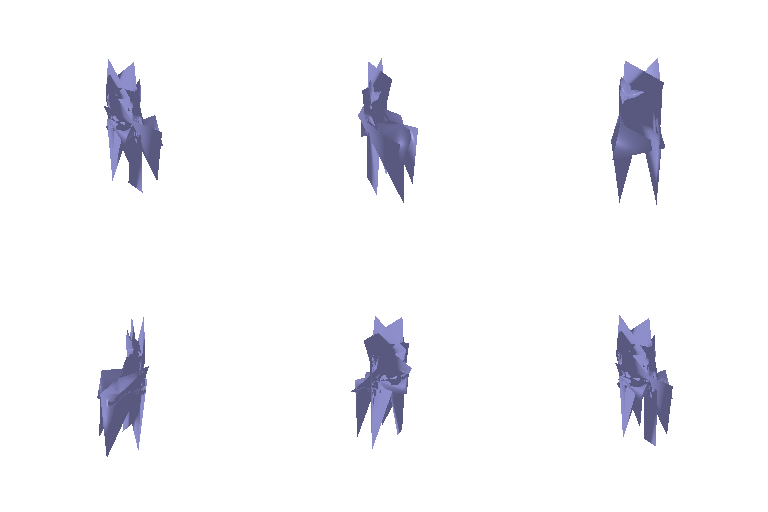 F1 86.2 | |
Chair 2 |  F1 80.4 |  F1 78.8 | 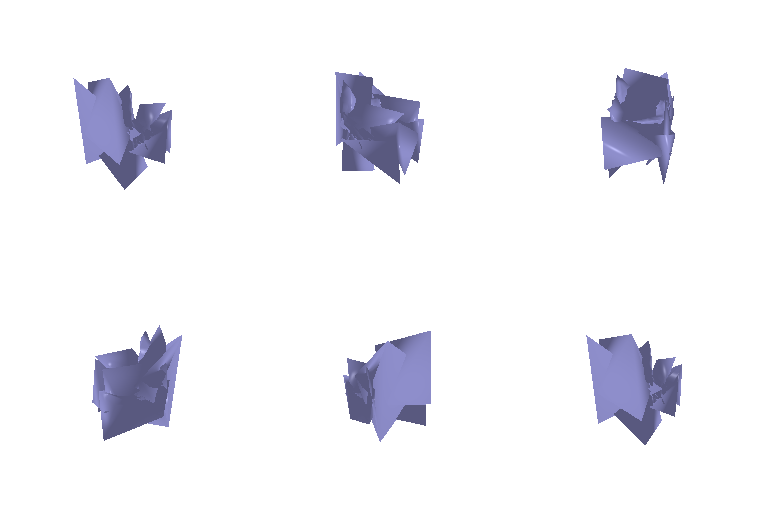 F1 83.1 | |
Chair 275 |  F1 90.6 |  F1 81.1 | 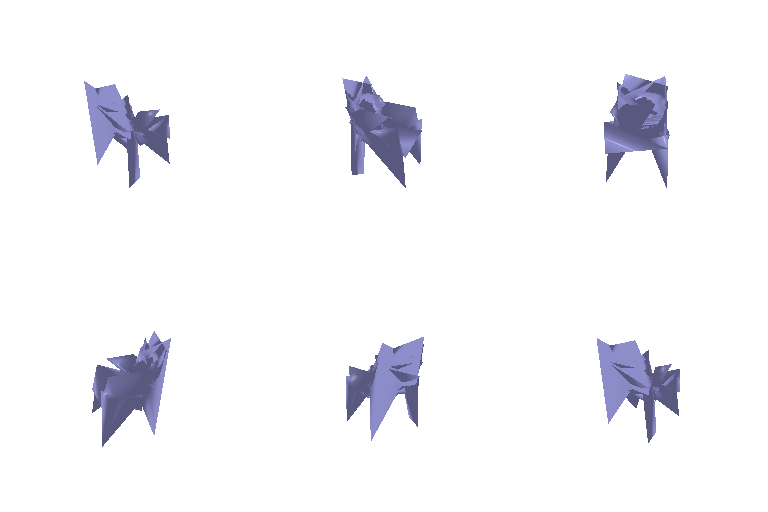 F1 83.2 | |
Conclusion. The ico4 template gives the best average F1@0.05 at 73.2, followed by cube at 72.8 and stretch at 71.2. The preferred initialization also appears related to chair proportions. The tall, narrow chair 402 favours stretch at 88.2, while the bulky, boxy chair 2 favours cube at 83.1. Chair 275 has more balanced proportions and an open frame, and performs best with ico4 at 90.6, which preserves a clearer seat and backrest. All three still show folds, spikes and distorted legs. Since the templates share the same vertex count and connectivity, initialization changes the starting vertex positions and the deformations the network must learn. These examples suggest that broad shape compatibility can help individual chairs, although they do not establish a universal rule.
Occlusion sensitivity is measured by sliding a black patch over the input image and we record how much the prediction moves and the change in loss against the ground truth. Warm colours indicate relatively greater output shifts or loss changes within each map. Shown for chairs 402 and 0.
A 64×64 patch with stride 32 sweeps the image. Each frame shows the occluded input, the clean prediction and the prediction under occlusion.


Heatmaps from a finer sweep with a 24×24 patch and stride 12 show output movement on the left and changes in loss against the ground truth in the middle.

A 64×64 patch with stride 32 sweeps the image. Each frame shows the occluded input, the clean prediction and the prediction under occlusion.


Heatmaps from a finer sweep with a 24×24 patch and stride 12 show output movement on the left and changes in loss against the ground truth in the middle.

Observations. Black fill removes most background responses. On chair 402, voxels respond around the upper backrest and rightmost visible leg. Points show the largest output shifts near the feet, but their loss changes peak around the seat and backrest junction. Meshes mainly respond to the upper backrest. On chair 0, all three loss maps emphasize the upper red back panel, with voxel responses near the centre, point responses farther right and mesh responses farther left. Hiding the lower part of chair 402 can eliminate the voxel prediction. Colours are normalized separately, preventing comparisons of overall sensitivity. The green background in the mesh loss map for chair 402 may represent zero change between positive and negative values. Mesh loss is measured using vertices and only approximates surface quality.
F1@0.05 = 44.2. The decoder is an MLP that takes the image feature and an (x,y,z) point and outputs an occupancy logit. It is queried on a 32^3 grid in (−1,1)^3.
F1 above is the average over the whole test set. The three chairs shown (test indices 402, 2, 275, fixed input view 0) are the same ones used for every model in sections 2 and 3. Per-chair F1@0.05 = 96.6, 80.0, 88.3.
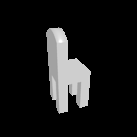
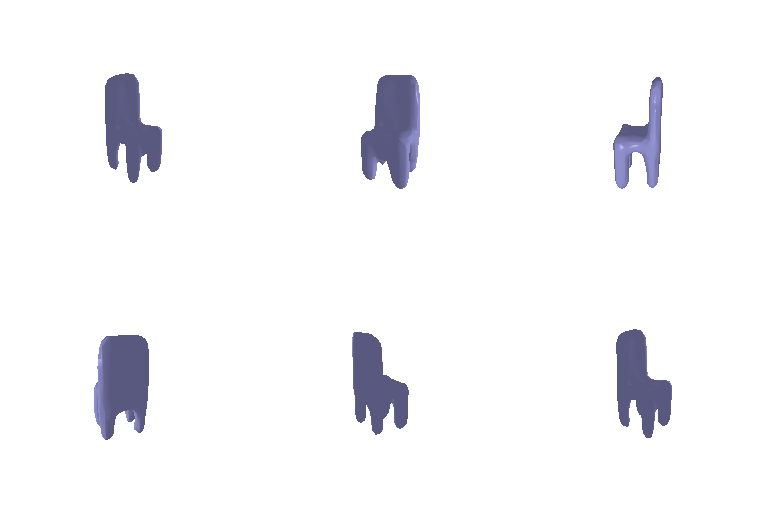

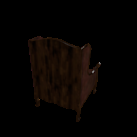
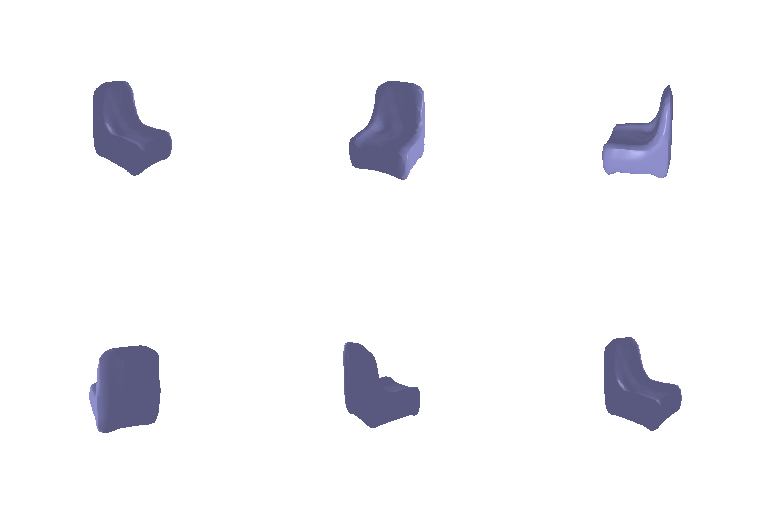

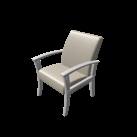
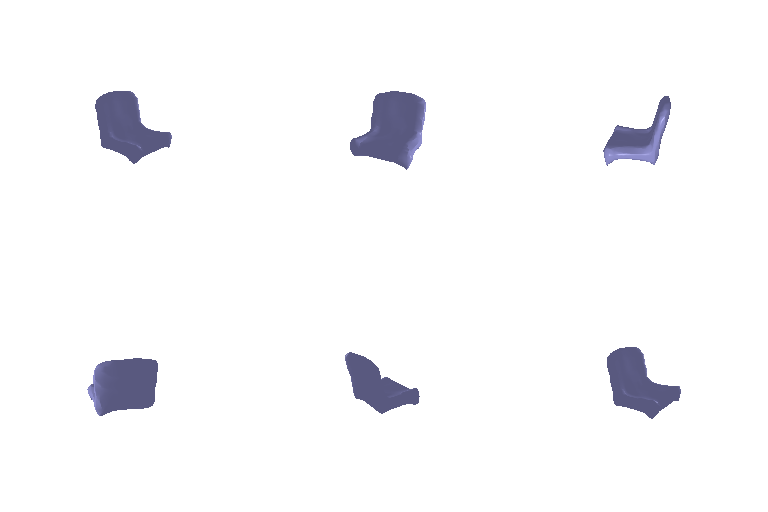
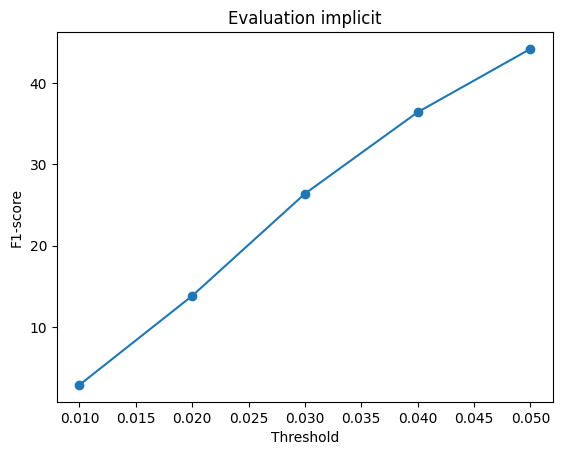
Discussion. The implicit decoder describes a shape through a continuous occupancy field, allowing geometry to be represented independently of mesh connectivity. It scores 44.2 compared with 62.2 for the voxel decoder. The successful examples recover the broad silhouette but lose thin legs and gaps. The evaluation also records 103 of 678 test predictions with no surface at the occupancy threshold of 0.5, which helps explain the gap between the displayed examples and the average score. Surface extraction uses a 32³ grid, so the continuous representation still faces coarse sampling when reconstructing small features.
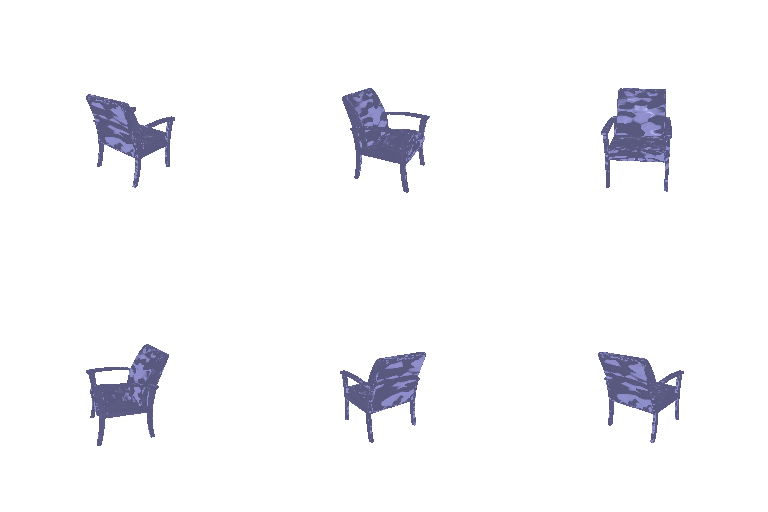
F1@0.05 = 83.3. The decoder is an MLP that takes the image feature and a sampled (u,v) point and outputs a 3D point (AtlasNet style, 1 patch, 5,000 points).
F1 above is the average over the whole test set. The three chairs shown (test indices 402, 2, 275, fixed input view 0) are the same ones used for every model in sections 2 and 3. Per-chair F1@0.05 = 94.5, 92.7, 96.5.
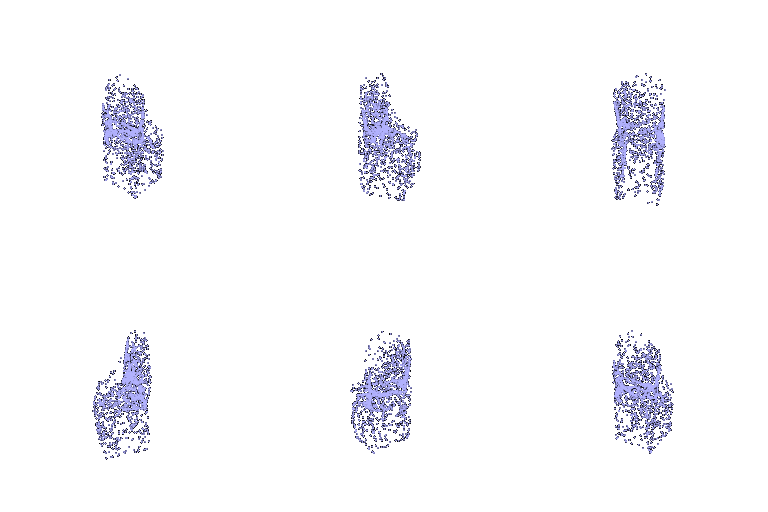

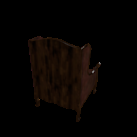


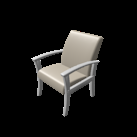
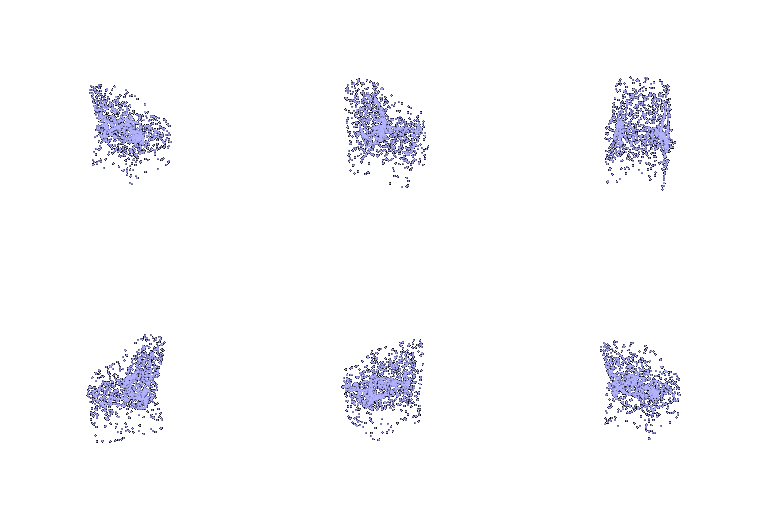

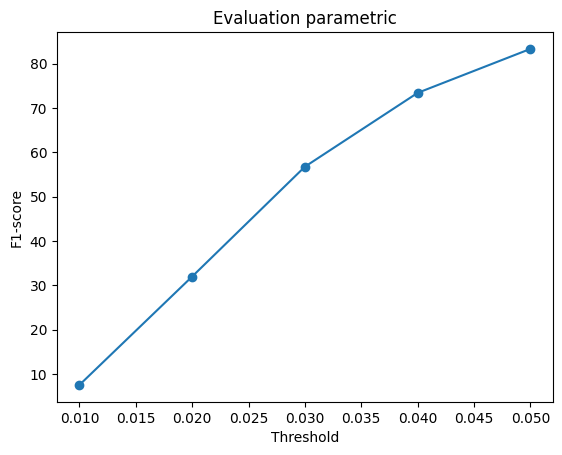
Discussion. The parametric decoder scores 83.3, above voxels at 62.2 and meshes at 74.5, while trailing direct point prediction at 87.4. It learns a shared mapping from a 2D patch to the chair surface, so the same decoder can generate different numbers of surface samples. The reconstructions capture the overall chair shape but remain diffuse around thin structures. Using one patch couples the placement of points across the seat, backrest, legs and armrests. This constraint can make uniform coverage of thin parts harder than independent point placement and is a plausible contributor to the score gap.
The voxel model from 2.1 is trained again on all three classes with the same settings and the same 10,000 steps. The chair train and test sets are exactly the ones used in 2.1. The training set has 6,100 chairs, 3,640 planes and 3,146 cars. Every test below uses input view 0, so both models see the same images.
| Model | Test set | F1@0.05 |
|---|---|---|
| Chair only (2.1) | Chairs (678) | 61.9 |
| Three classes | Chairs (678) | 45.0 |
| Three classes | Planes (405) | 83.5 |
| Three classes | Cars (368) | 32.2 |

| Input | Chair only model | Three class model | Ground truth |
|---|---|---|---|
 Chair 402 |  F1 99.8 |  F1 95.4 |  |
 Chair 2 |  F1 78.1 |  F1 84.5 |  |
 Chair 275 |  F1 85.7 |  F1 89.8 |  |
| Input | Prediction | Ground truth |
|---|---|---|
 Plane 2 |  F1 99.6 |  |
 Plane 3 |  F1 98.2 |  |
 Car 4 |  F1 54.0 |  |
Analysis. Training on three classes reduces chair F1 from 61.9 to 45.0, a drop of 16.9 points on the same test images. Empty chair predictions also increase from 14 to 56. A likely contributor is reduced chair exposure. Chairs account for about 47 percent of the combined training set, so the same training budget provides roughly half as many chair examples. The shared model also has to represent more varied geometry, which may reduce its specialization in chairs.
The plane predictions preserve the main body, wings and tail, while the car appears flattened with indistinct wheels. Chairs 2 and 275 score higher but look more similar, and chair 275 loses its armrest openings. Higher F1 therefore does not always mean better geometric detail.