16-825 Assignment 2: Single View to 3D
Goals: In this assignment, you will explore the types of loss and decoder functions for regressing to voxels, point clouds, and mesh representation from single view RGB input.
Table of Contents
1. Exploring loss functions (10 points)
This section will involve defining a loss function, for fitting voxels, point clouds and meshes.
1.1. Fitting a voxel grid (4 points)
In this subsection, we will define binary cross entropy loss that can help us fit a 3D binary voxel grid.
Define the loss functions voxel_loss in losses.py file.
For this you can use the pre-defined losses in pytorch library.
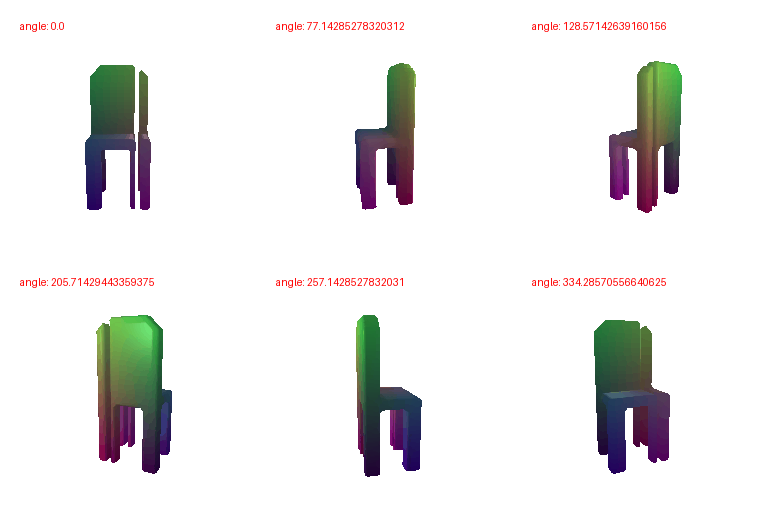
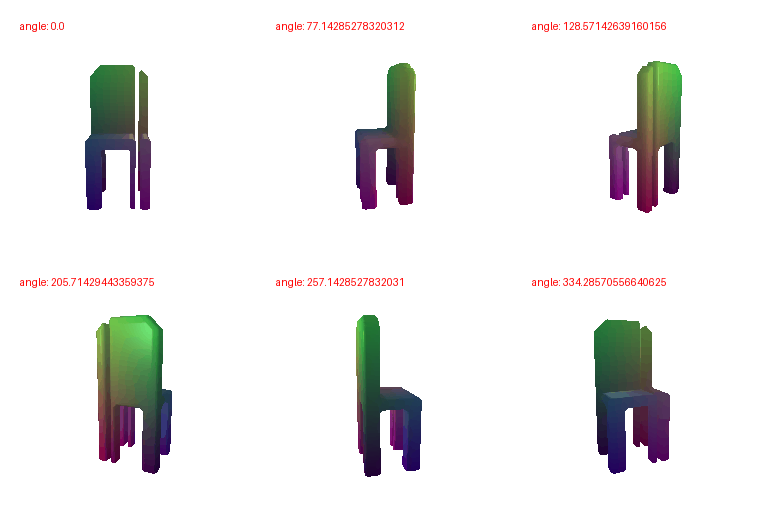
Run the file python fit_data.py --type 'vox', to fit the source voxel grid to the target voxel grid.
Visualize the optimized voxel grid along-side the ground truth voxel grid using the tools learnt in previous section.
On the left side is the optimized voxel, and on the right side is the ground truth voxel.
1.2. Fitting a point cloud (3 points)
In this subsection, we will define chamfer loss that can help us fit a 3D point cloud .
Define the loss functions chamfer_loss in losses.py file.
We expect you to write your own code for this and not use any pytorch3d utilities. You are allowed to use functions inside pytorch3d.ops.knn such as knn_gather or knn_points
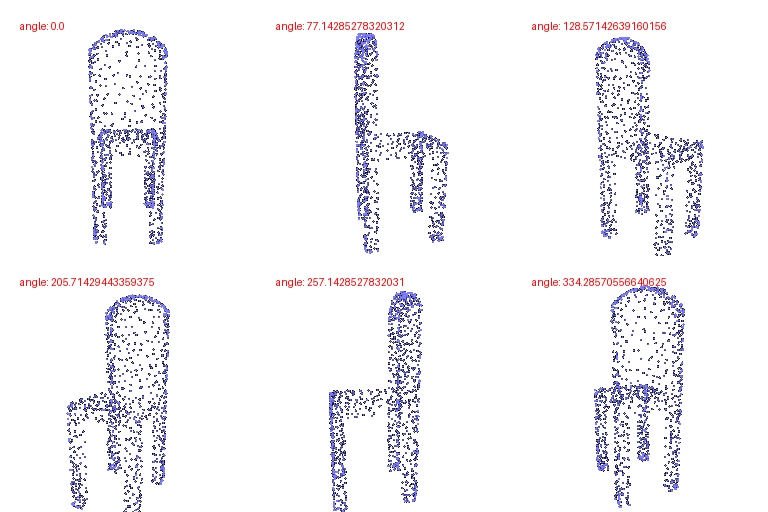
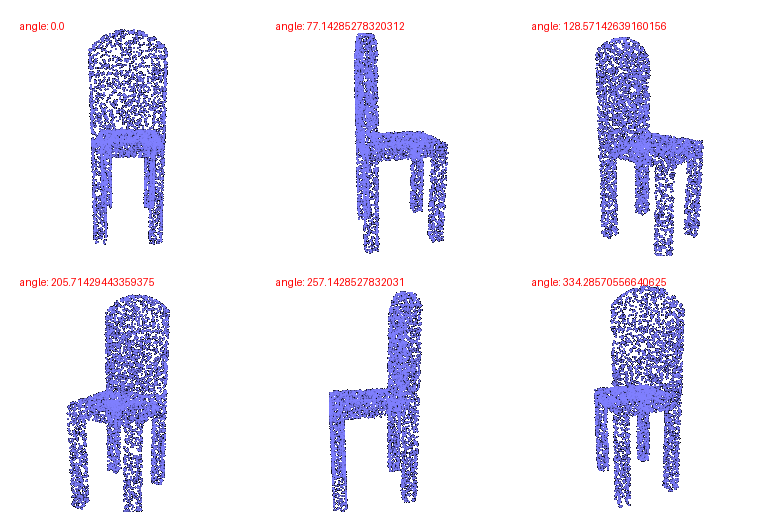
Run the file python fit_data.py --type 'point', to fit the source point cloud to the target point cloud.
Visualize the optimized point cloud along-side the ground truth point cloud using the tools learnt in previous section.
On the left side is the optimized point cloud, and on the right side is the ground truth point cloud.
1.3. Fitting a mesh (3 points)
In this subsection, we will define an additional smoothening loss that can help us fit a mesh.
Define the loss functions smoothness_loss in losses.py file.
For this you can use the pre-defined losses in pytorch library.
Run the file python fit_data.py --type 'mesh', to fit the source mesh to the target mesh.
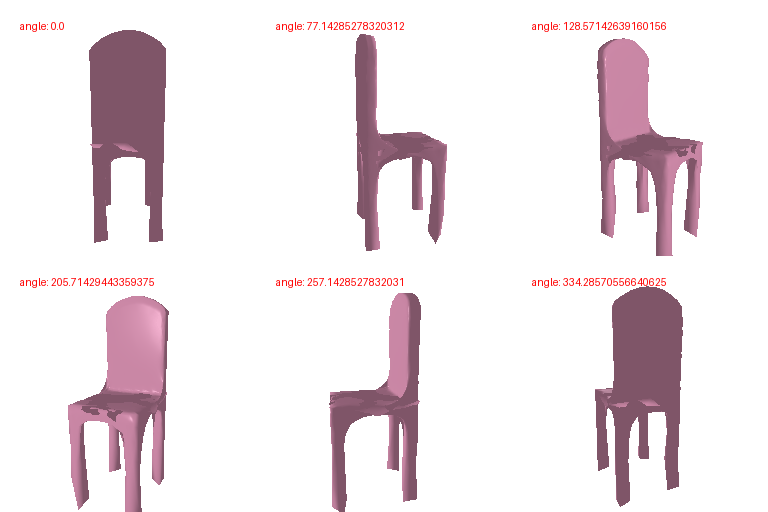
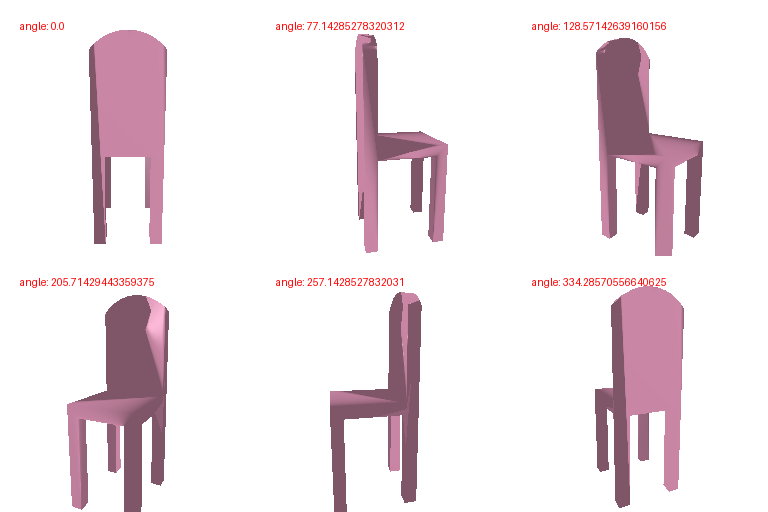
Visualize the optimized mesh along-side the ground truth mesh using the tools learnt in previous section.
On the left side is the optimized mesh, and on the right side is the ground truth mesh.
2. Reconstructing 3D from single view (80 points)
In this part, I trained on an 8 GB RTX 3070 Ti Laptop GPU, so --load_feat was not used for any training.
2.1. Image to voxel grid (20 points)
GIFs of examples
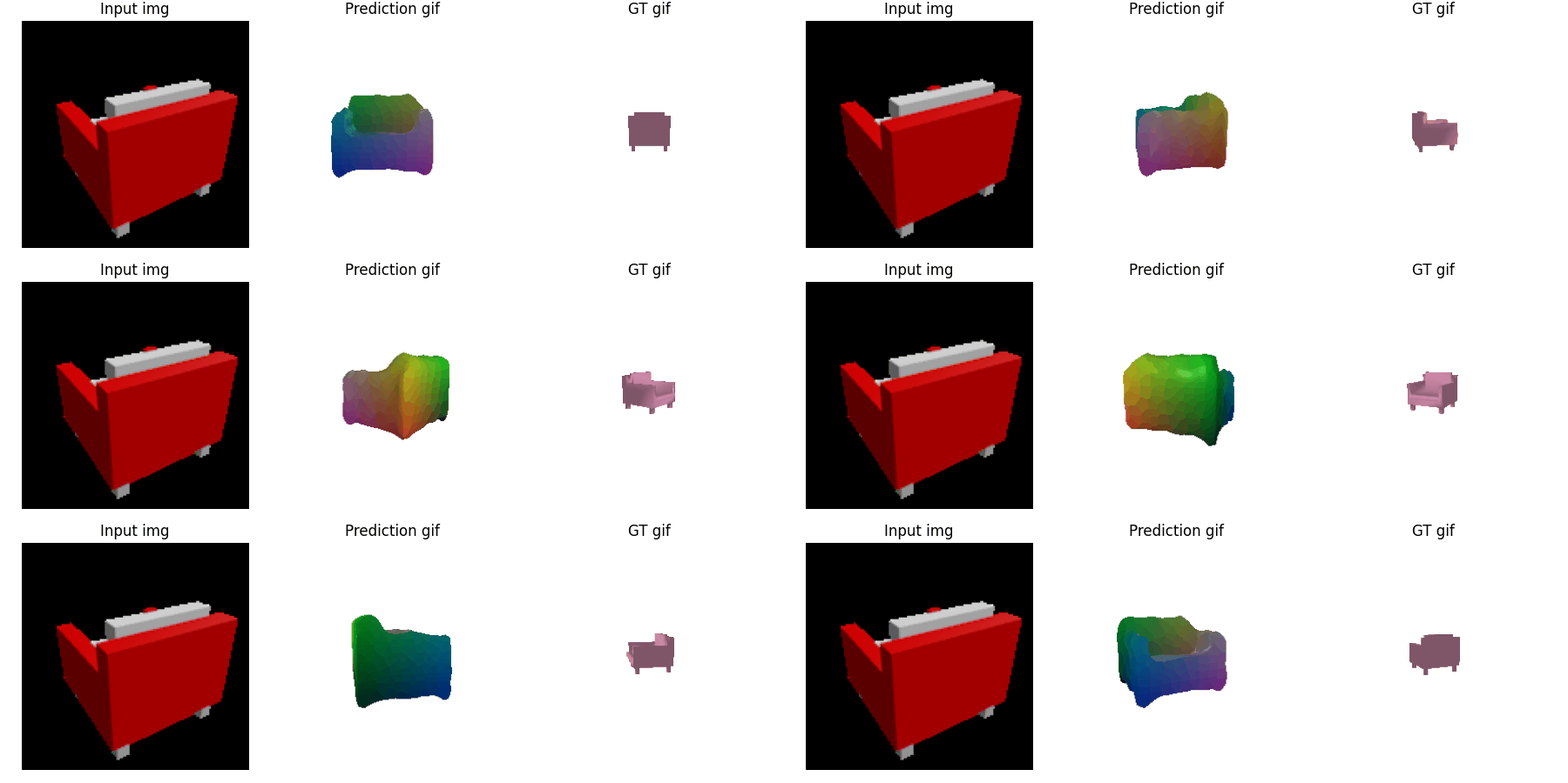
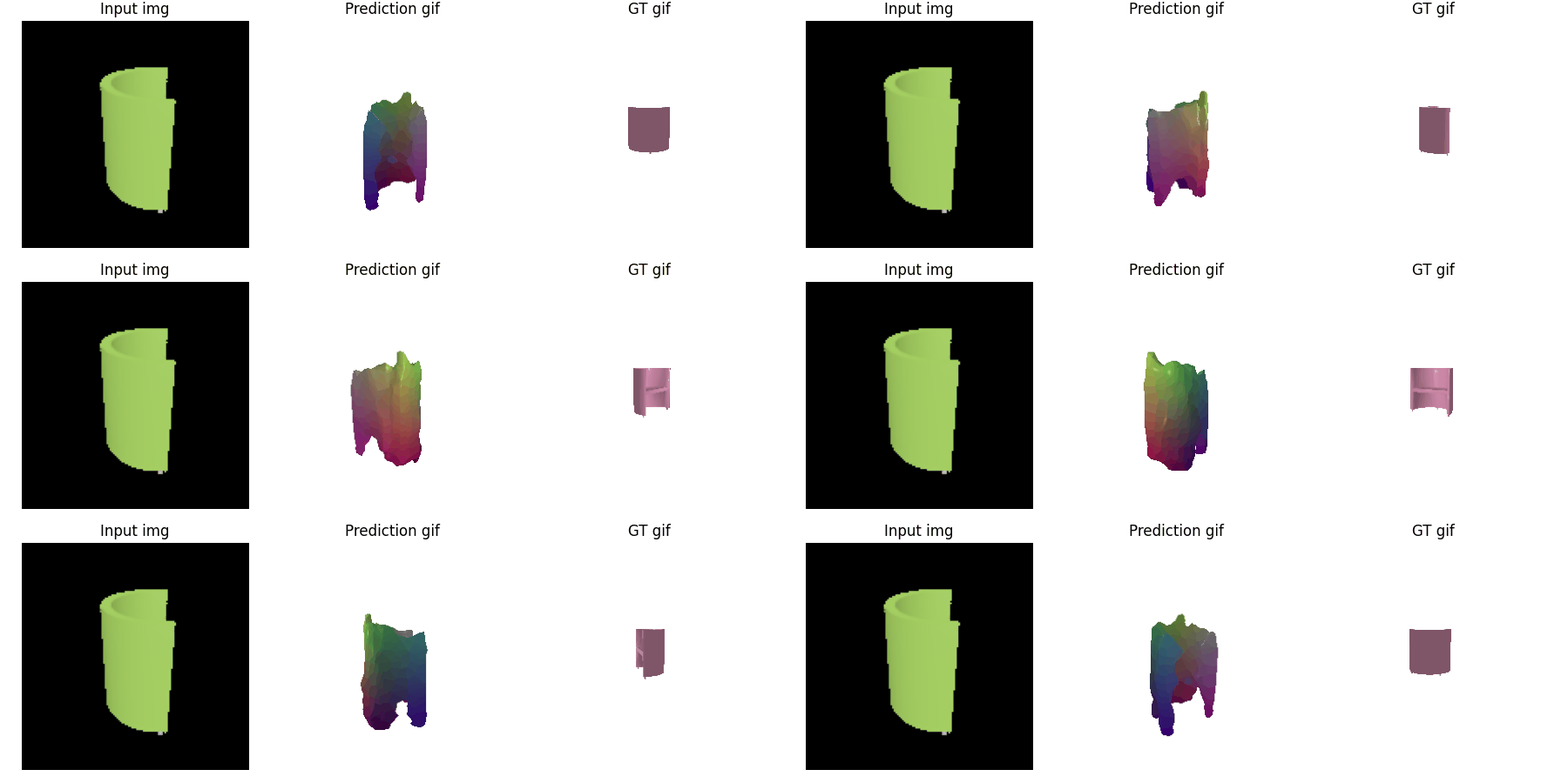
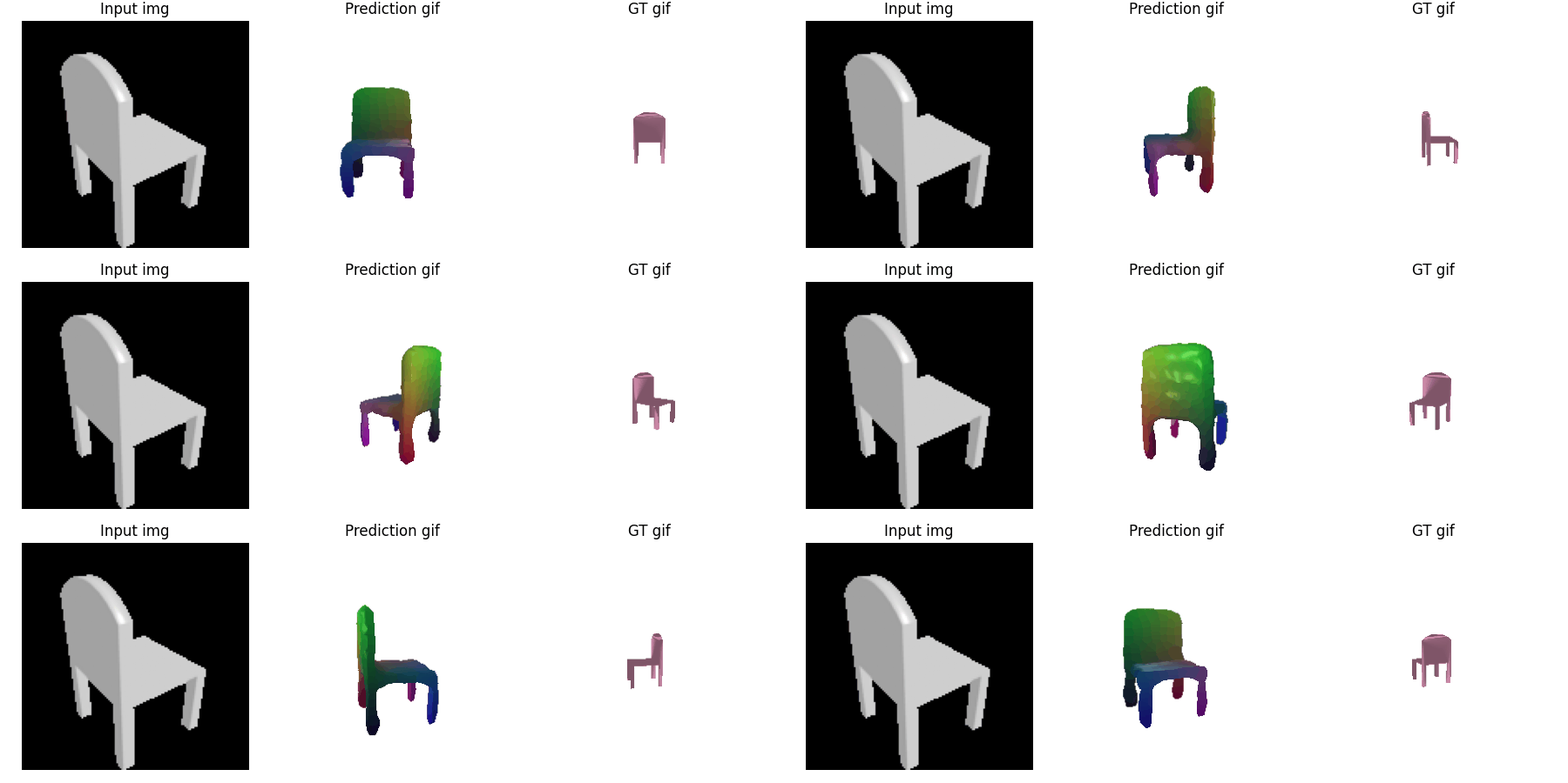
F1 @0.05 score: 72.562
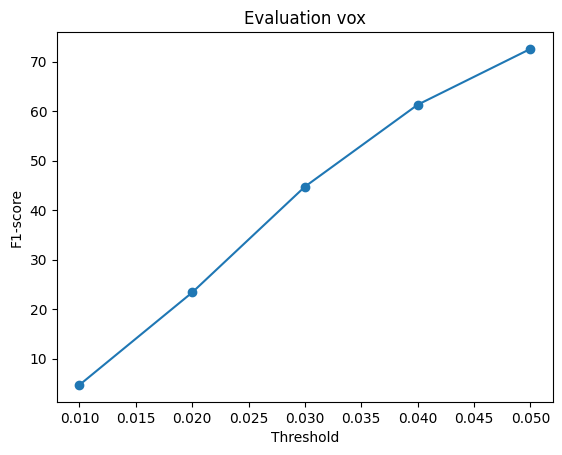
Finding
In this case, the network can predict sofa and chair like items really well, but the hollow half cylinder cannot be reconstructed really well. The prediction of voxel is likely to be bumpy. It's likely because the shape is rare.
2.2. Image to point cloud (20 points)
GIFs of examples
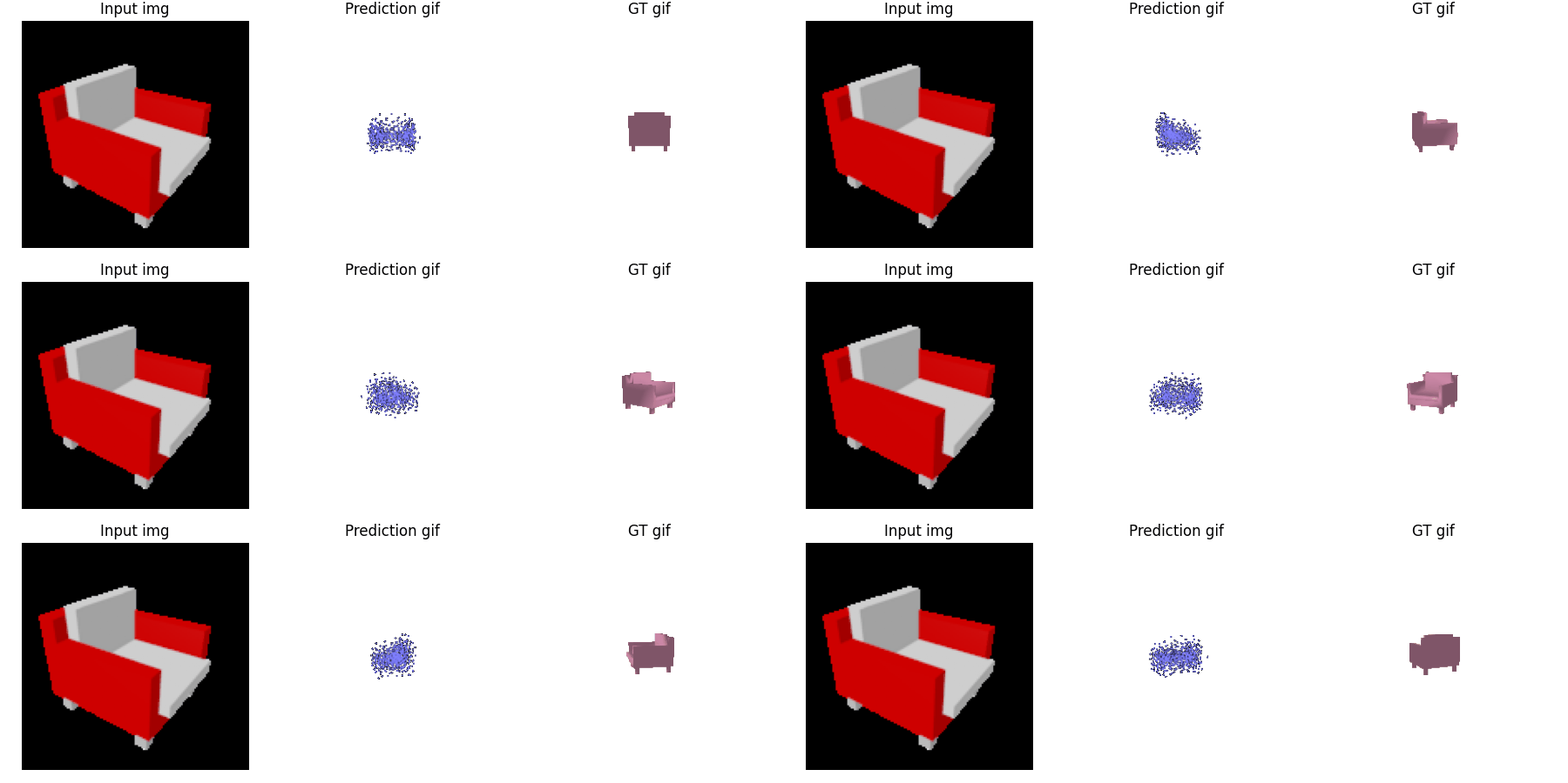
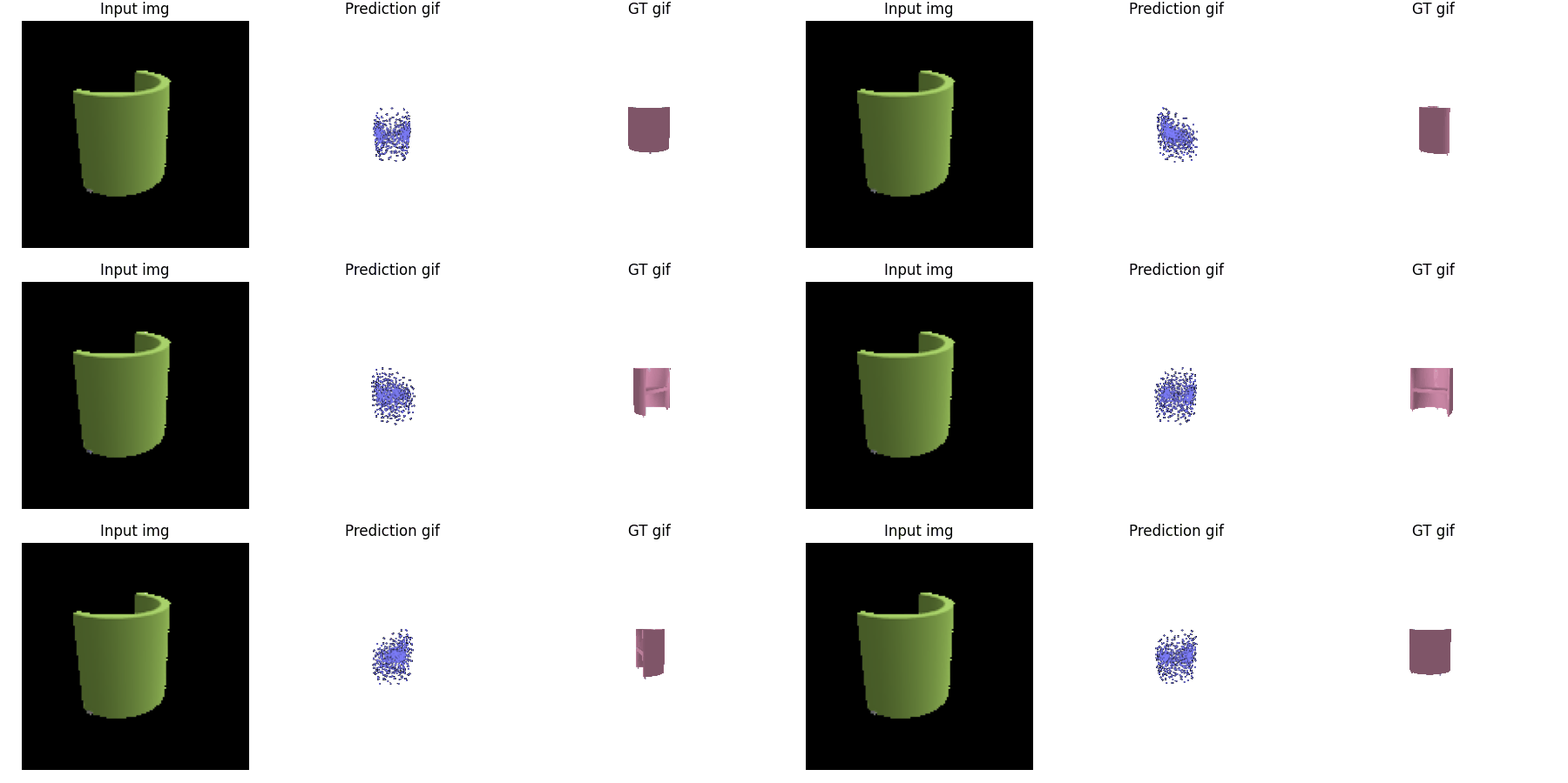
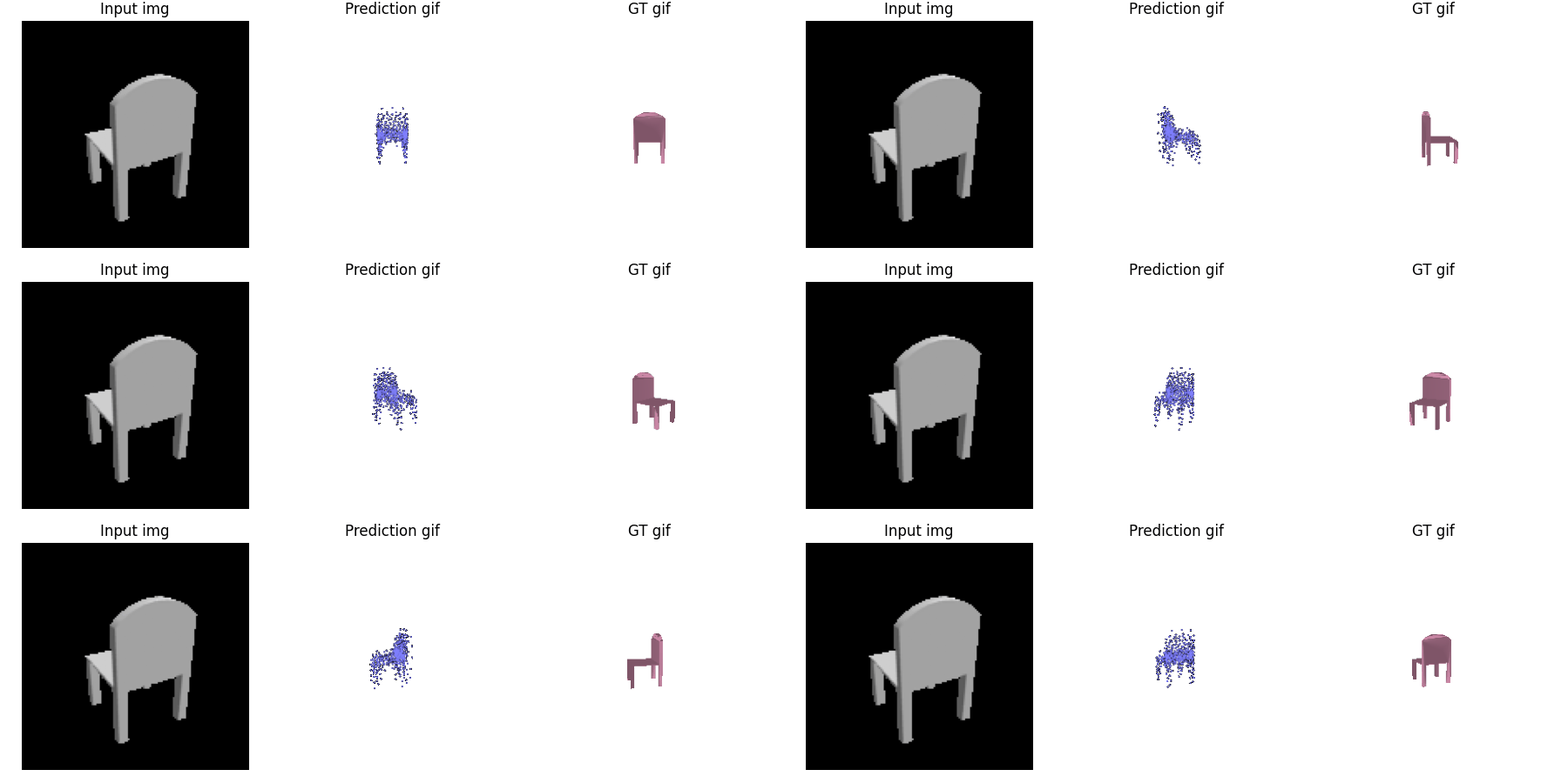
F1 @0.05 score: 78.069
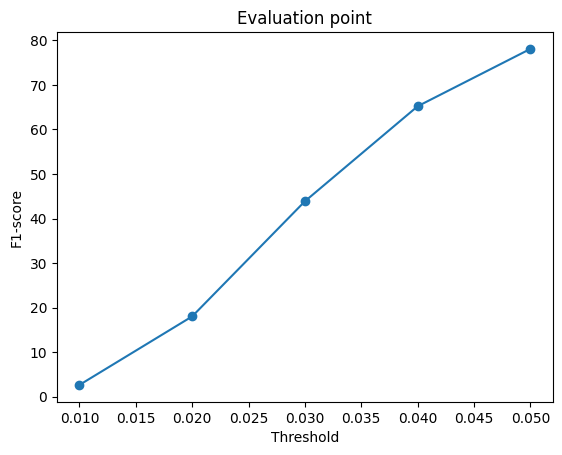
Finding
In this case, the network can predict the second case not really bumpy, seems to be better but it's still sofa-like. Point cloud is discrete and in the middle the density is less.
2.3. Image to mesh (20 points)
GIFs of examples
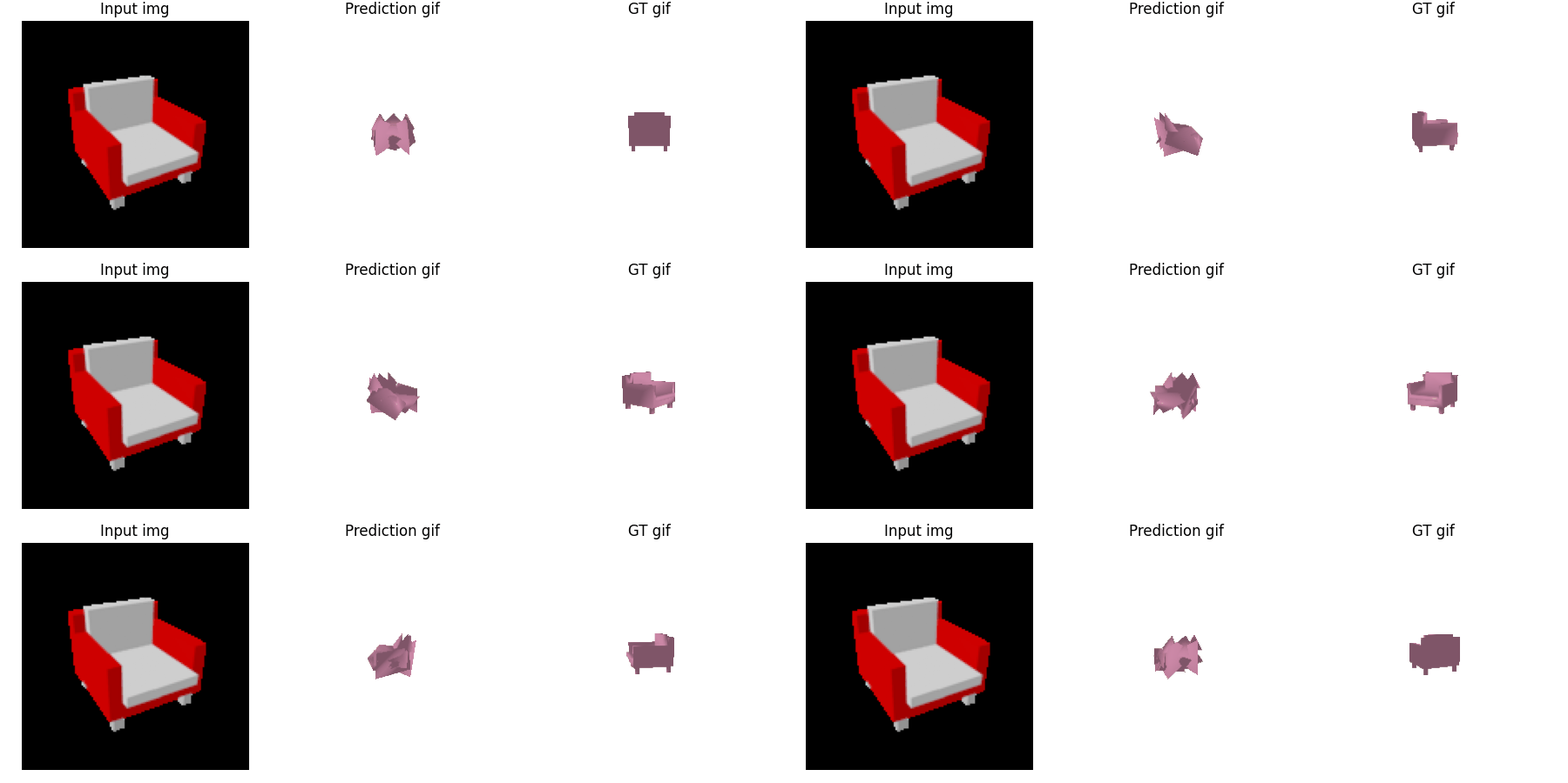
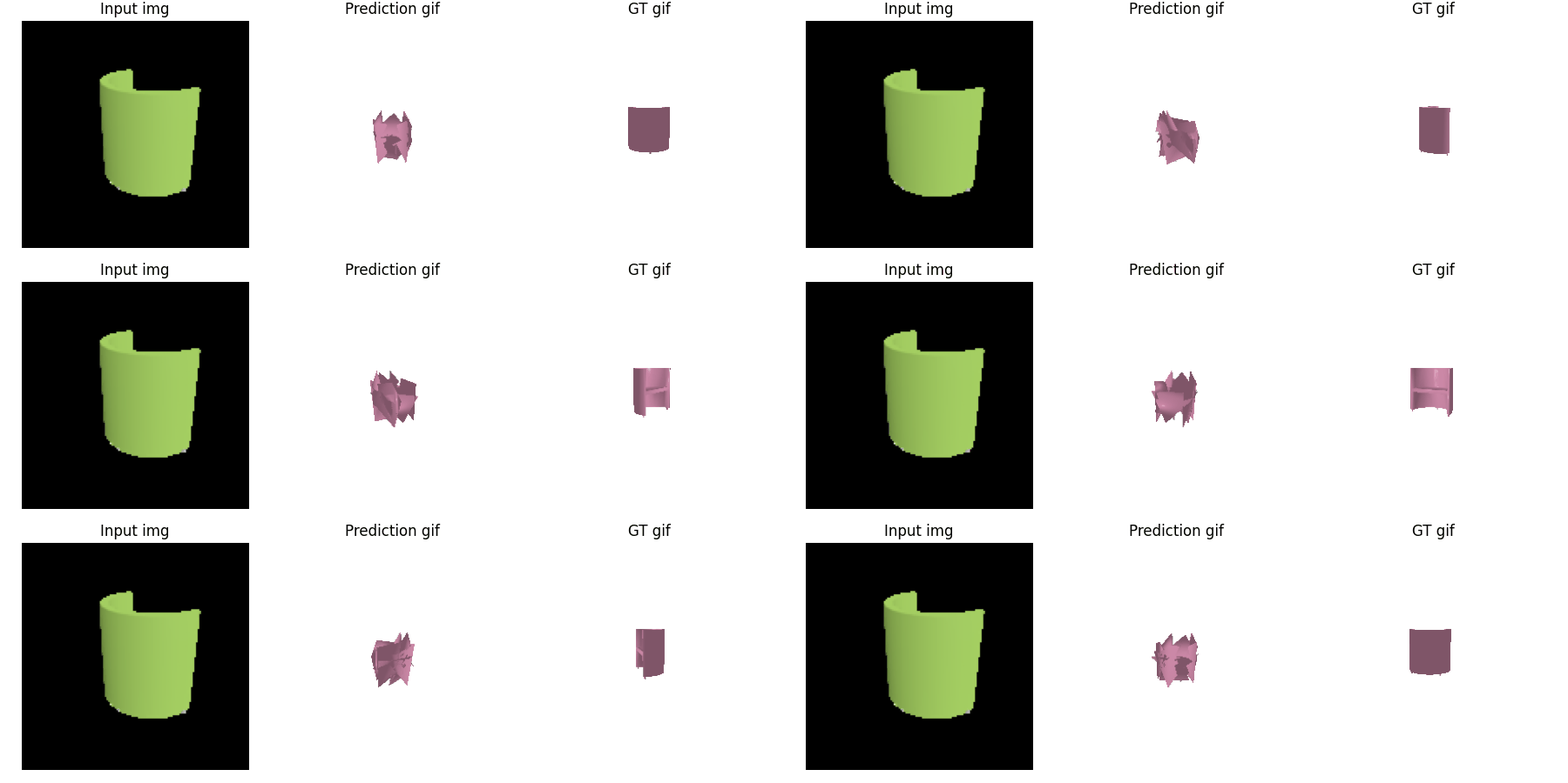
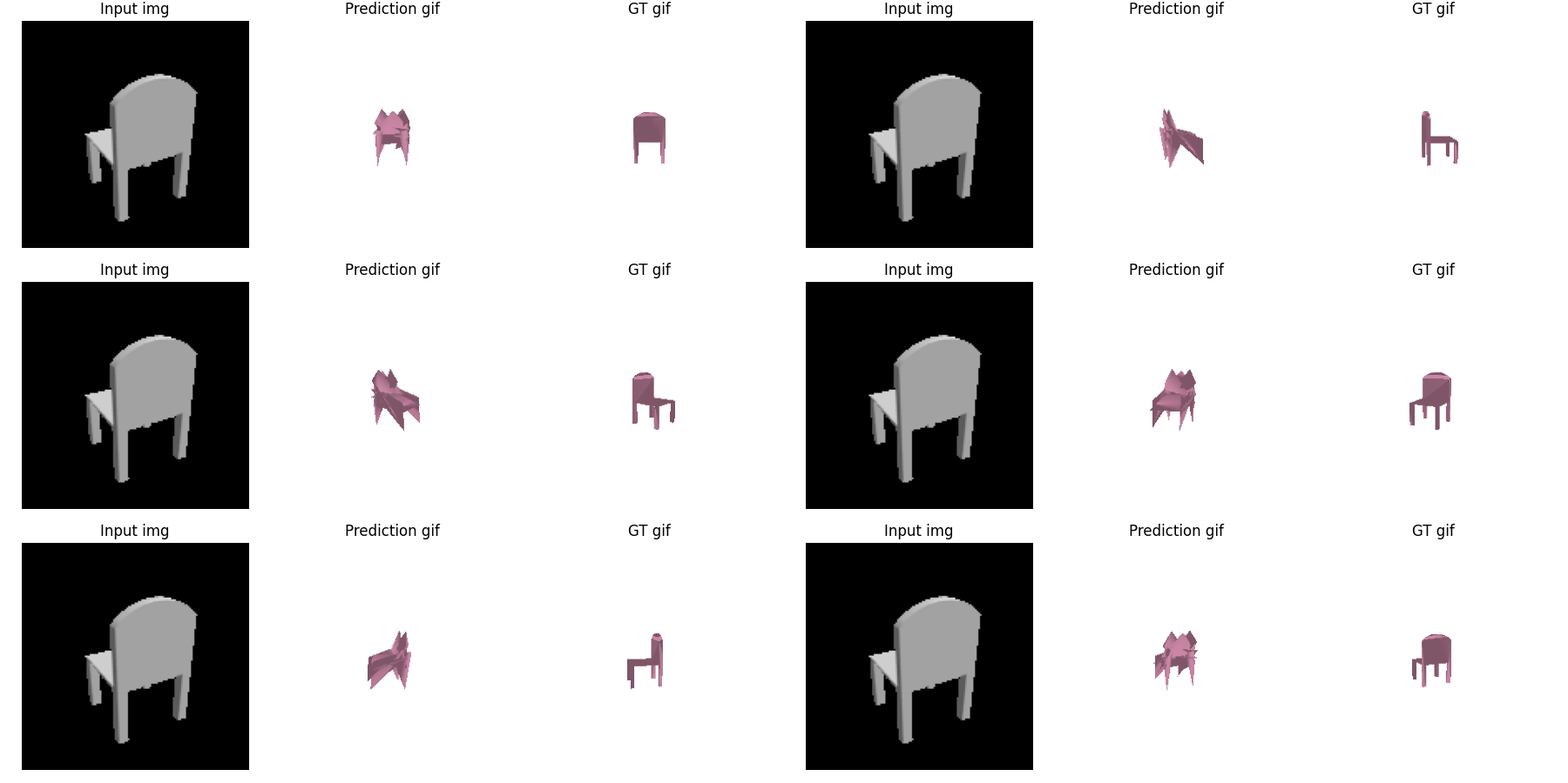
F1 @0.05 score: 71.478
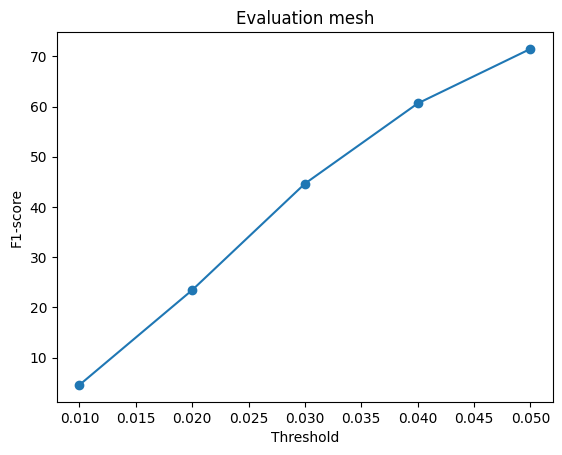
Finding
In this case, the network of mesh predict this as the worse. It's not only bumpy but also chair like. And the empty middle was never shown in the reconstruction result.
Comparing
| iter = 50000 | F1@0.05 score | Training time |
|---|---|---|
| Voxel | 72.562 | 31008 |
| Point cloud | 78.069 | 31005 |
| Mesh | 71.478 | 70735 |
| Parameter | 71.804 | 31228 |
For the F1 score under iteration of 50000,
Why the result:
Mesh highly rely on topology and initial mesh. What's more, the Laplacian loss restricts it's movement towards extreme directions.
Points and voxel are easier to predict because they have less constraint, points and points, voxels and voxels are not relly related to each other.
Even though voxels need to use marching cubes to turn into meshes, voxels has more freedom in positions of predictions. Voxels needn't obey the initial topolgy and can deal easier with holes.
Why point is the best: F1 score is similar to Chamfer, they are all calculating the closest points between prediction and ground truth.
Why voxel isn't better than point: Marching cubes can lead to slight different (we can regard as error) between the actual voxel prediction and the final mesh.
2.4. Analyse effects of hyperparams variations (10 points)
Mesh ico_num for initial mesh: 3 vs 5 in 10000 iters
| iters = 10000 | F1@Score |
|---|---|
| ico_num = 3 | 58.701 |
| ico_num = 5 | 65.544 |
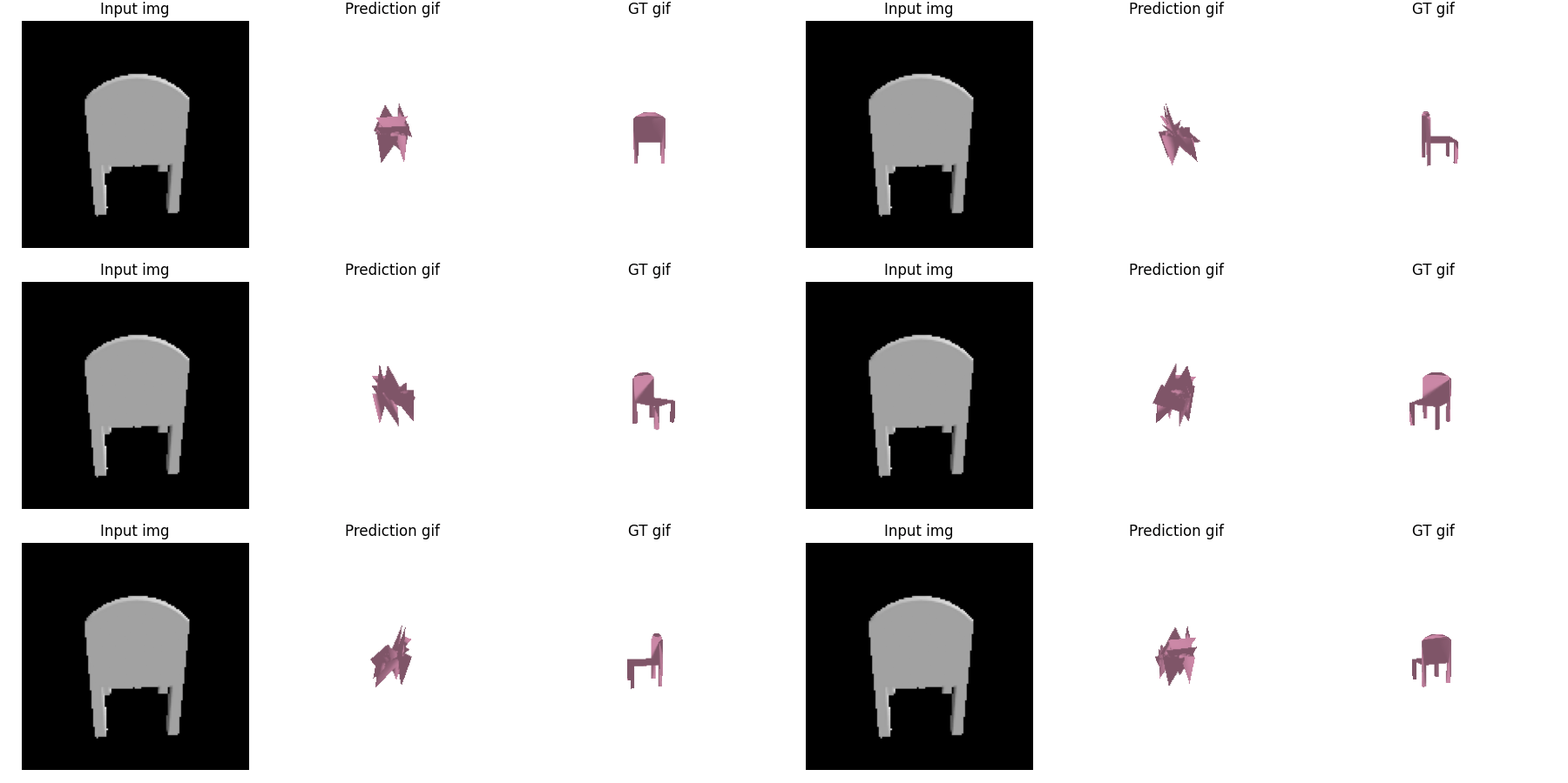
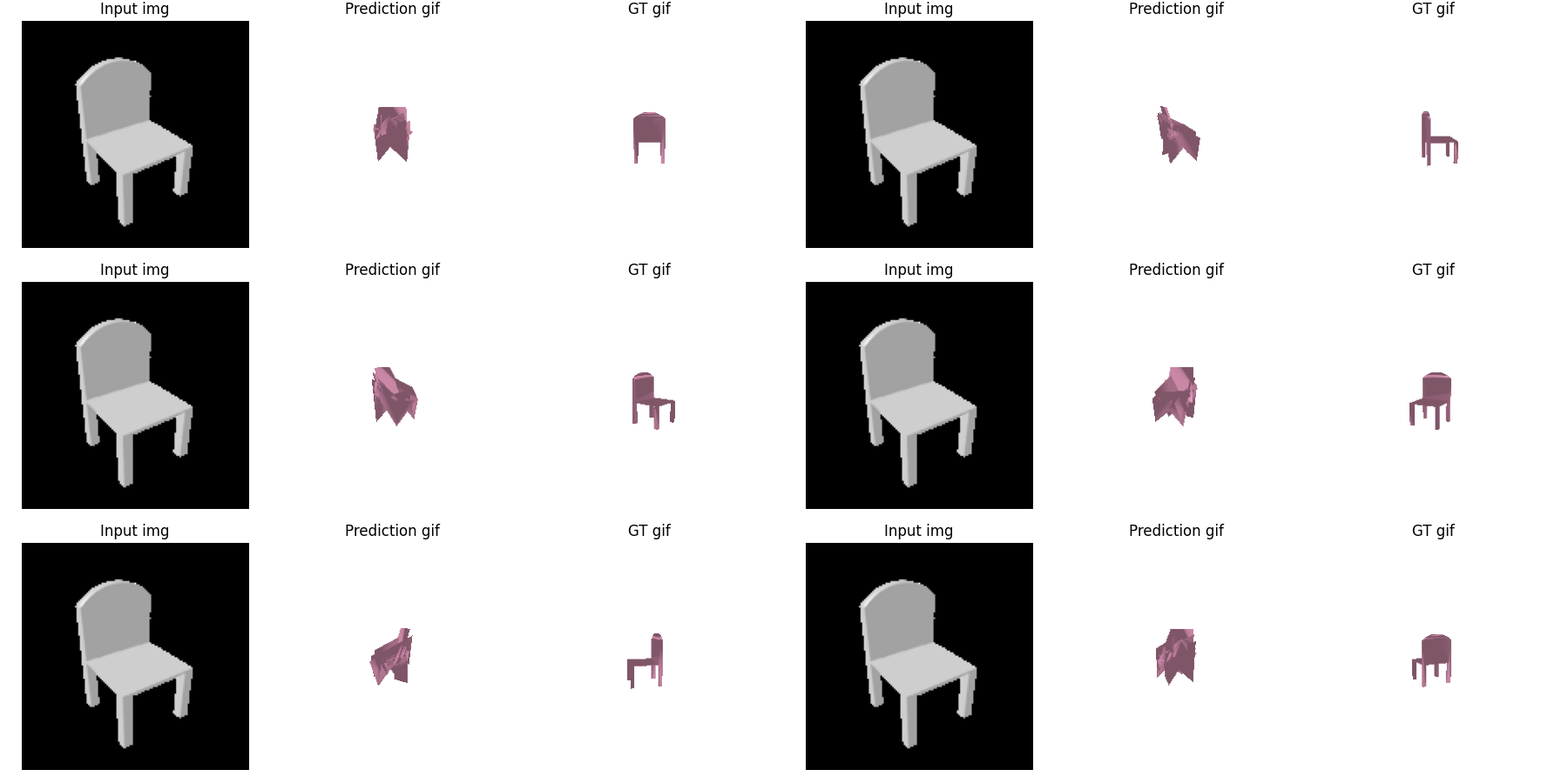
Analysis:
The more the initial mesh ico_num number is, the smoother the mesh prediction will be.
Under the same iteration number, more mesh vertices can make the prediction more precise, and the F1 score higher.
Point number n_points for point: 1000 vs 5000 in 5000 iters
| iters = 5000 | F1@Score |
|---|---|
| n_points = 1000 | 66.798 |
| n_points = 5000 | 56.466 |
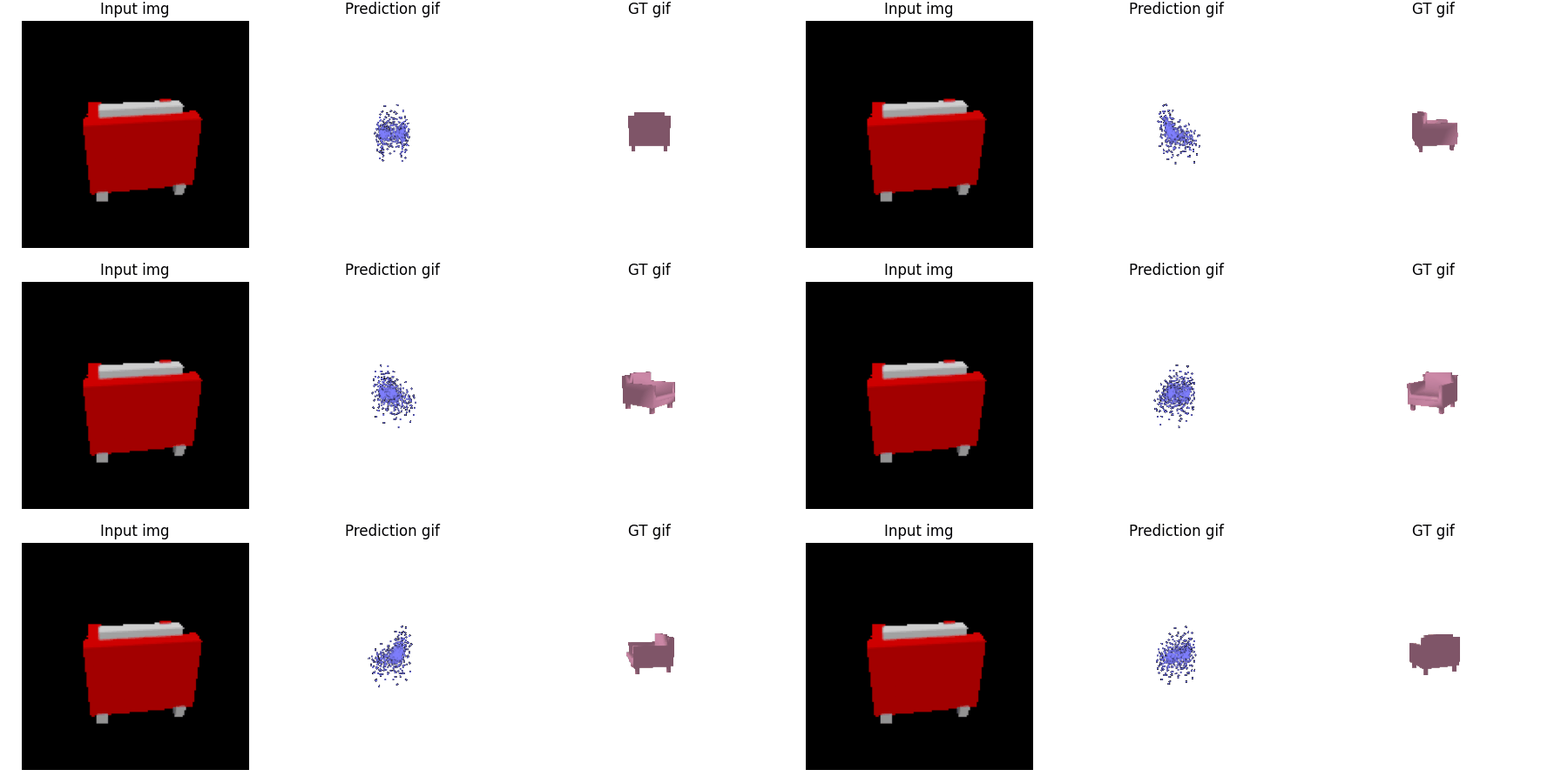
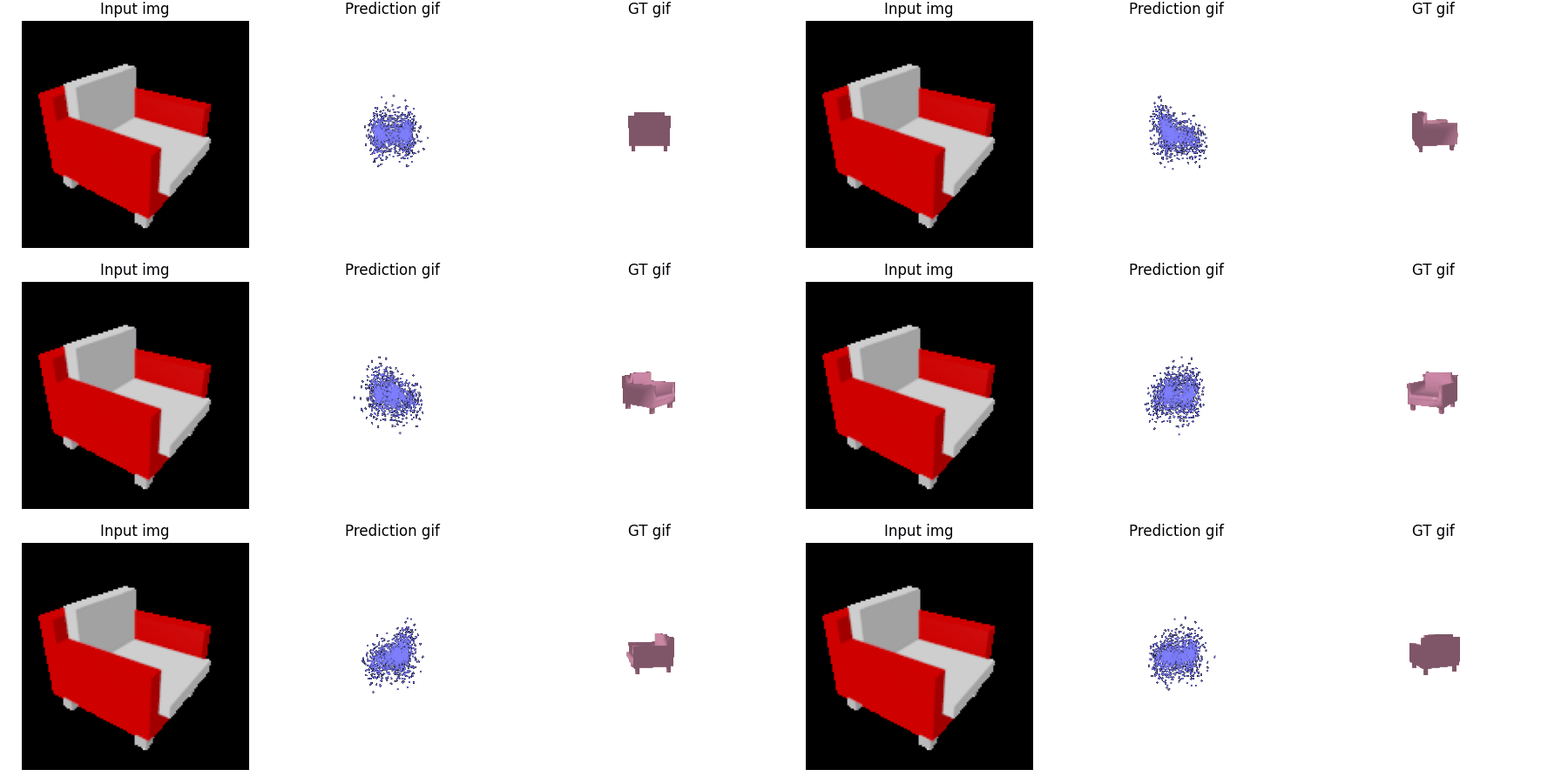
Analysis:
In this case, due to the iteration number is only 5000, it's really restricted times of iteration. I think it's not enough for the model to learn throughly, as we know the more the points is, the more the parameter need to learn.
Looking at the visualization, the points with n=5000 has more density, and the shape is more distinctive.
2.5. Interpret your model (10 points)
Having the listed visualization above, we can notice that the model mainly learns a chair or sofa like shape. As a result, I wanted to output the mean shape of each prediction based on evaluation dataset.
And below is the visualization I've done to validate my guess.
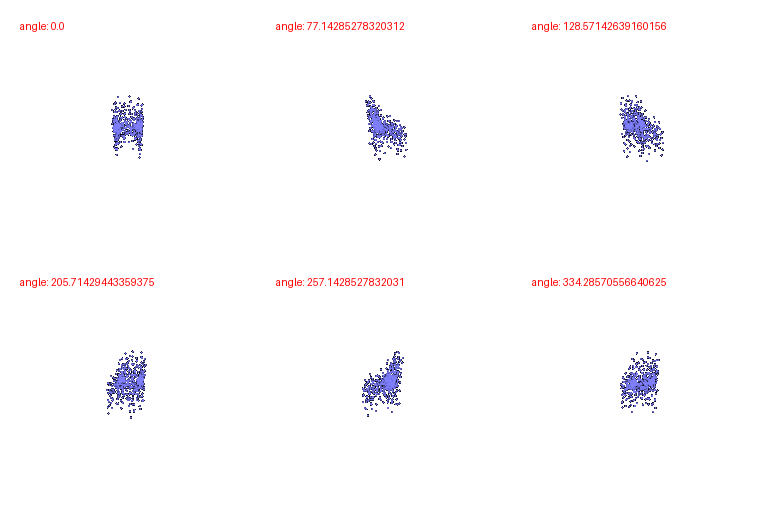
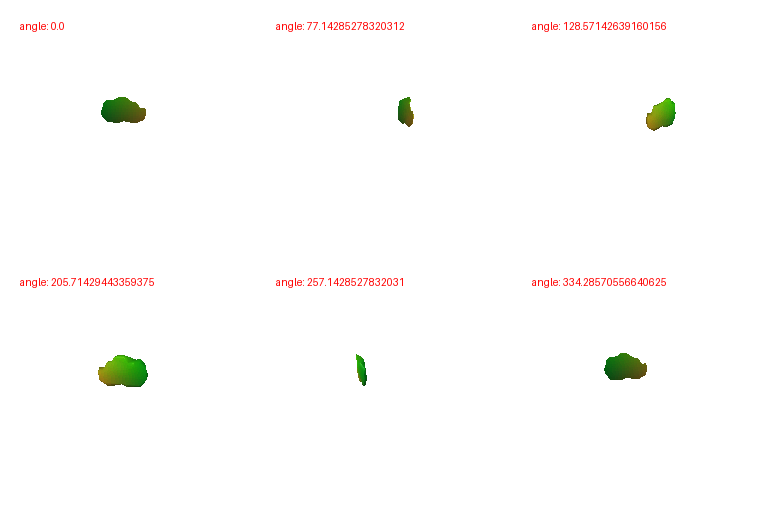
Looking at the mean point and mean voxel predict, it's clear that the point shape is mainly a chair, which corresponds to my intuitive guess.
But the mean voxel vizualization is not apparently anything, it's because the mean voxel is the occupancy probability, to it's easy to be less than the threshold 0.5, but there's also a mean shape output instead of nothing, meaning that there's common features along with most of the voxel predictions.
Mesh mean is more complicated to calculate, so I just put point and voxel as an example.
3. Exploring other architectures / datasets. (Choose at least one! More than one is extra credit)
3.2 Parametric network (10 points)
Implement a parametric function that takes in as input sampled 2D points and outputs their respective 3D points.
GIFs of examples
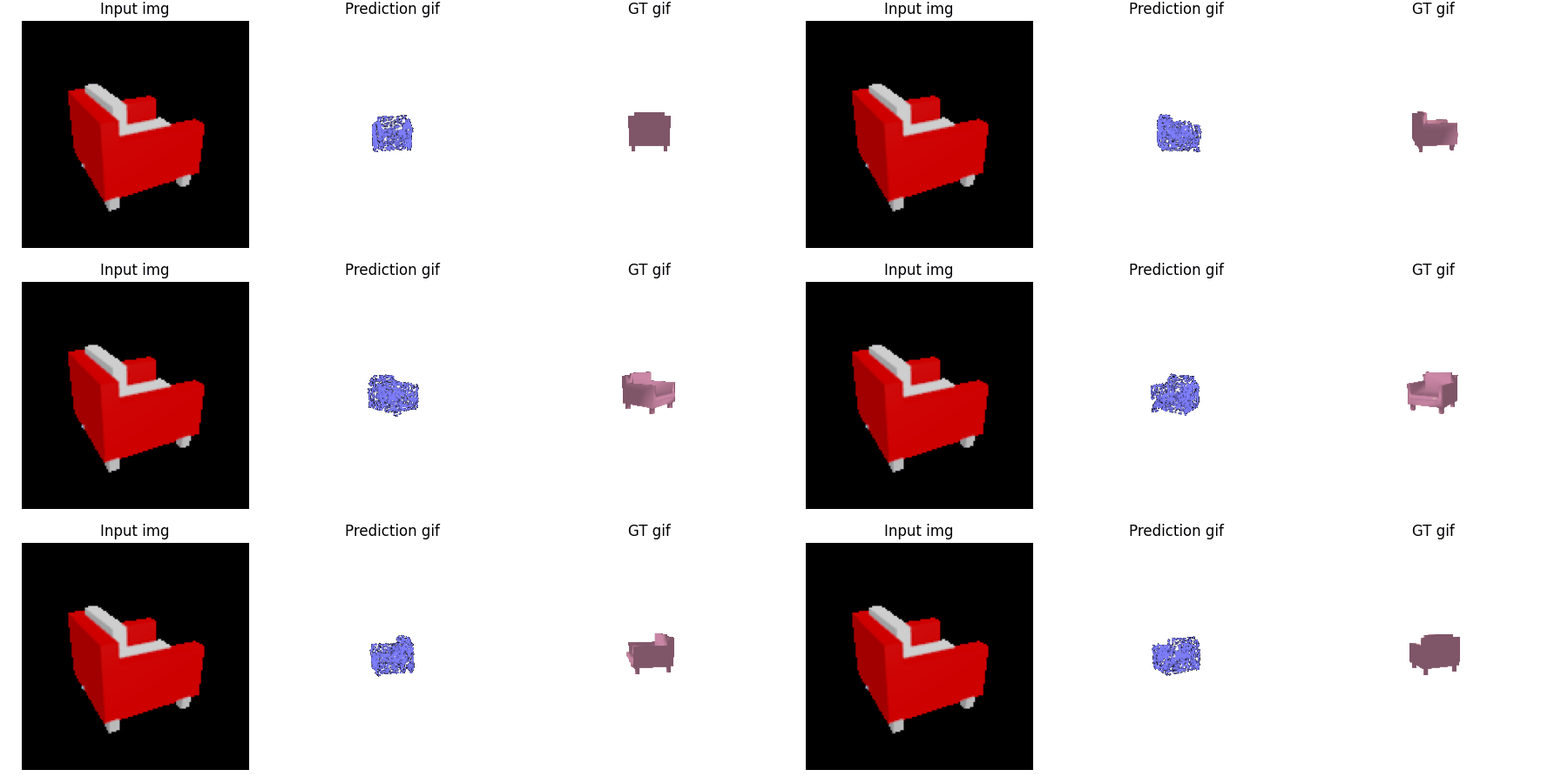
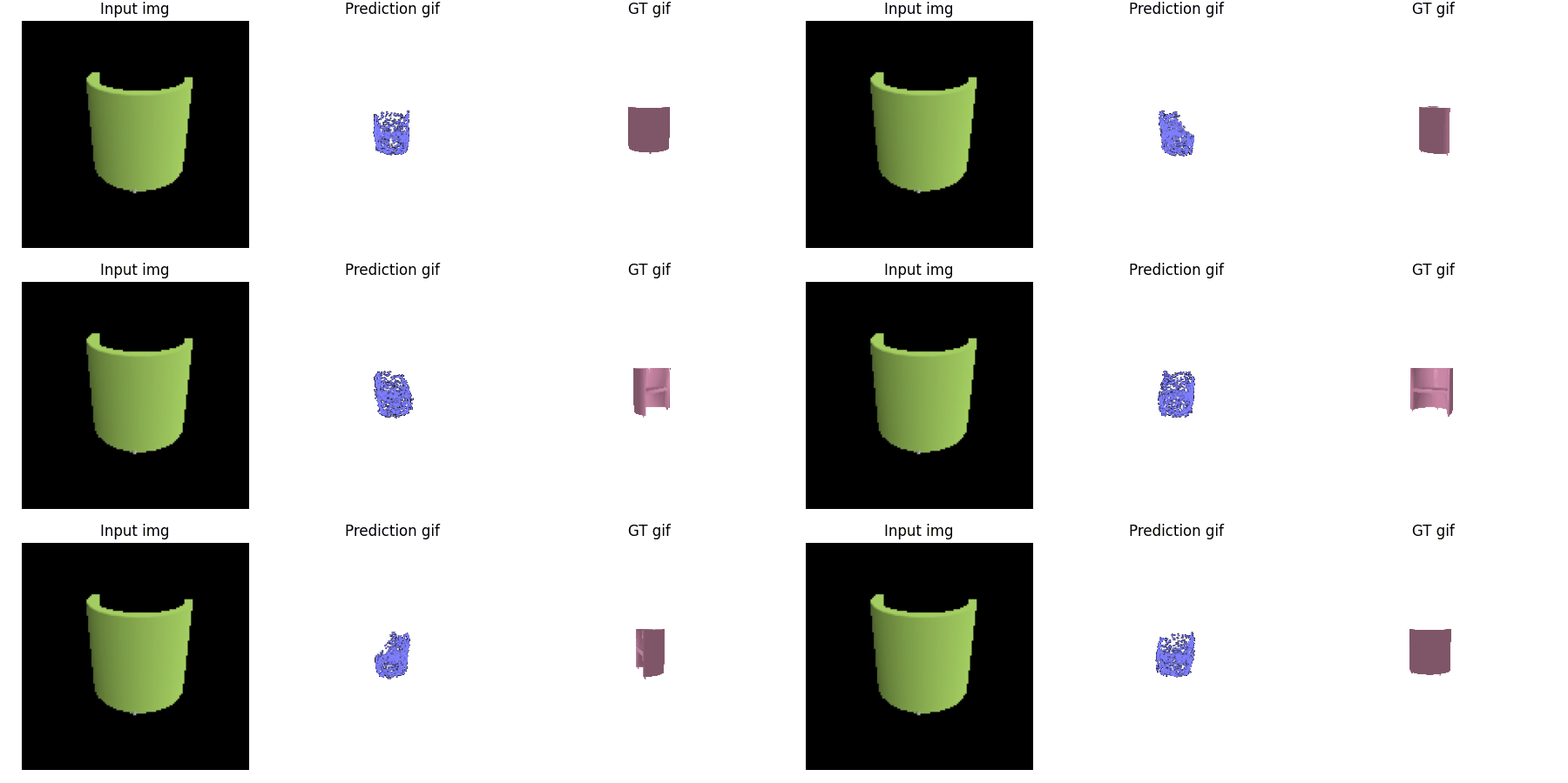
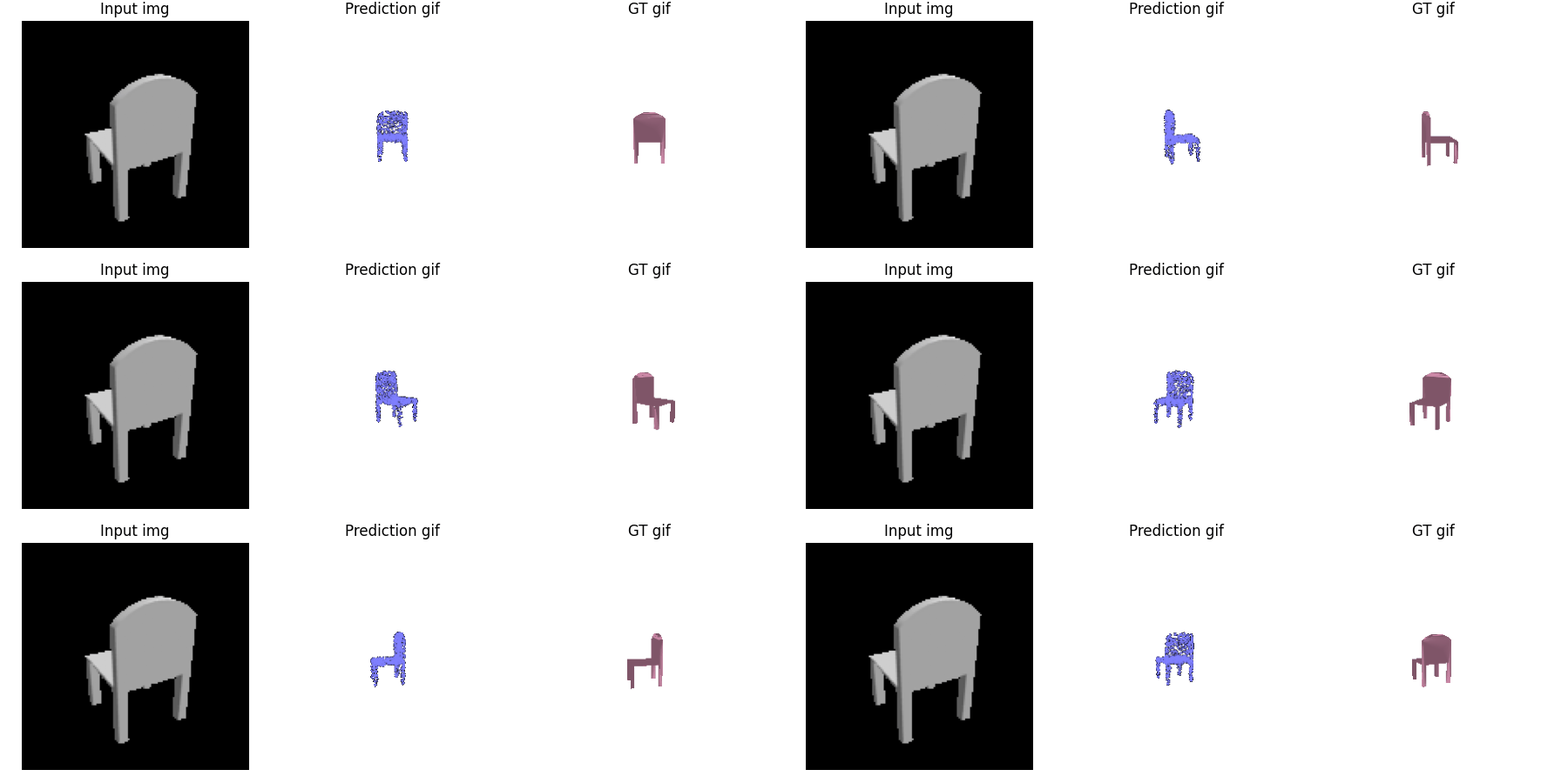
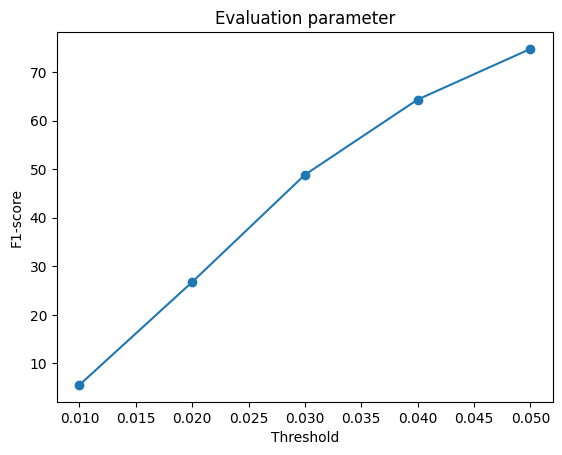
F1 @0.05 score: 71.804
Findings
We can notice in this part that the parametic highly depends on sampling (u,v). As I only chose 1000 points for the network, it's a little bit sparse and have empty blocks.