Andrew ID: robertre

Left: optimized voxel grid. Right: ground truth.

Left: optimized point cloud. Right: ground truth.

Left: optimized mesh. Right: ground truth.
All Part 2 and Part 3 models use the ResNet18 encoder, batch size 32 and learning rate 4e-4, and are evaluated at the step-8000 checkpoint. --load_feat was not used.
Each image: input RGB, predicted voxel grid, ground-truth mesh.


F1@0.05: 50.5

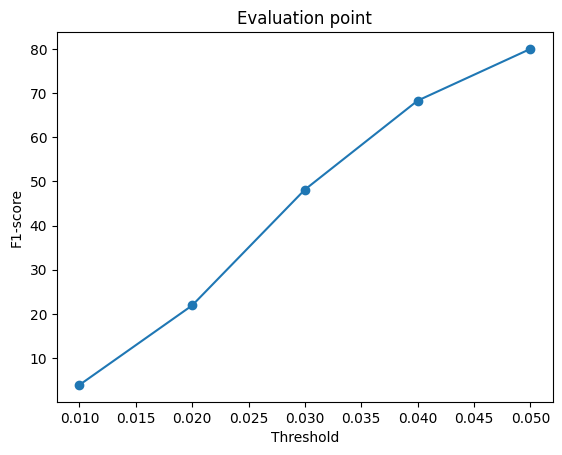
Each image: input RGB, predicted point cloud, ground-truth mesh.


F1@0.05: 80.0
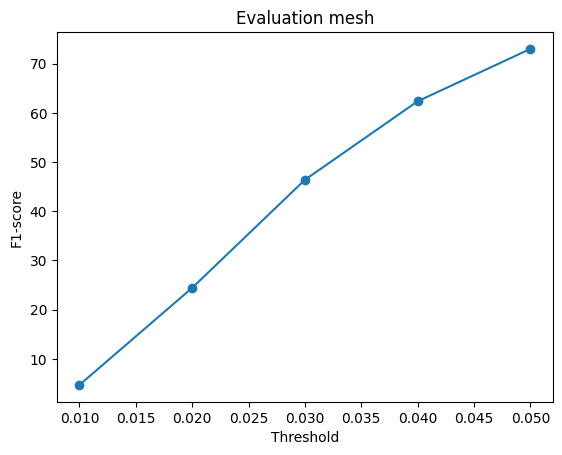
Each image: input RGB, predicted mesh, ground-truth mesh.


F1@0.05: 73.0
| Representation | F1@0.05 |
|---|---|
| Voxel grid | 50.5 |
| Point cloud | 80.0 |
| Mesh | 73.0 |
The point cloud decoder performs better than the mesh decoder, and the voxel decoder performs the worst. The point decoder performed well because it was trained with Chamfer loss, which is closely aligned with the F1 score since both are based on nearest-neighbour distances. Additionally, since the points have no connectivity constraint, they are free to be placed anywhere, which makes challenging cases like modeling thin structures easier. The mesh decoder deforms a sphere, which has no holes, so it cannot represent gaps such as the space between chair legs and instead stretches faces across them. It also cannot model thin structures very nicely because there are terms such as the smoothness loss encouraging a smoother reconstruction. The voxel decoder is the worst among the 3 decoders likely because the 32^3 resolution is not high enough for modeling thin parts such as legs, which are only one or two voxels wide. In addition, about 96% of the voxels are empty, so the BCE loss biases the decoder toward predicting empty space.
The mesh model from 2.3 retrained with different smoothness weights w_smooth; everything else is identical.
| w_smooth | F1@0.05 |
|---|---|
| 0 | 75.9 |
| 0.1 (default, 2.3) | 73.0 |
| 1 | 69.6 |
| 10 | 56.0 |
The same test example for each value (input RGB, predicted mesh, ground-truth mesh):
w_smooth = 0

w_smooth = 0.1
w_smooth = 1

w_smooth = 10

The F1 score decreases as w_smooth increases. When the smoothing weight is small, the mesh appears to have many spikes. However, when the smoothing weight is too high, we start to lose actual structures as thin structures could be over penalized. The is because smoothness loss pulls each vertex towards the average of its neighbours. Therefore, there is a trade-off between the F1 score and the quality of the mesh. In this case, w_smooth=0.1 seems to give the best tradeoff of smoothness and completeness.
Predicted points colored by their distance to the ground-truth surface: blue is on the surface, red is 0.1 or more away (twice the F1 threshold). Each image: input RGB, colored prediction, ground-truth mesh.


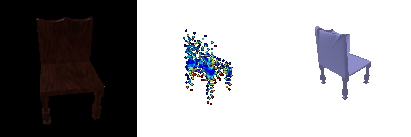
The error maps show that most of the predicted points on large surfaces such as the seat and the back are blue, which means the model has learned the overall shape of the chairs well. The errors are mostly at the bottom of the chairs and where the thin structures are. This is because thin structures only takes up a small portion of the entire surface so they contribute little to the Chamfer loss.
For the implicit network, I concatenate the 512-dimensional image feature with the xyz coordinate of a query points and pass it through a 3-layer MLP (515 → 256 → 128 → 1) that predicts the occupancy logit of the point. To get the full output, I create a 32^3 meshgrid in the normalized coordinates and evaluate every point of the grid, which gives an occupancy grid. The model is trained with BCE loss.
Each image is0: input RGB, predicted occupancy (surface at 0.5), ground-truth mesh.


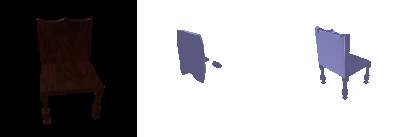
F1@0.05: 41.9 (voxel decoder from 2.1: 50.5)
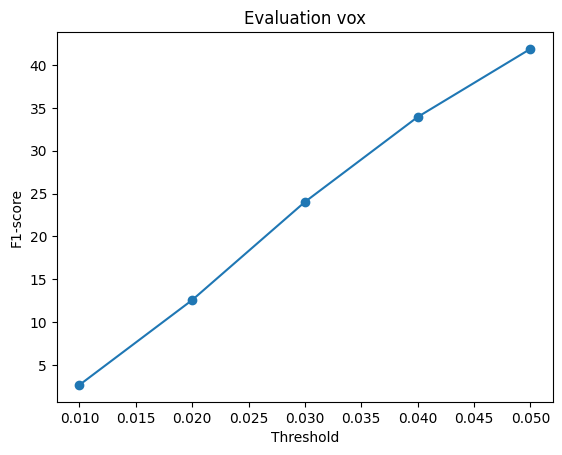
The implicit decoder performs worse than the voxel decoder from 2.1. Visually, it reconstructs the chair but misses the thin structures. Additionally, it predicts an empty grid for the folding chair and only part of the back for the wooden chair. This is likely because the implicit decoder underfits as it has only 0.17M parameters compared to 4.86M for the voxel decoder. Additionally, a small MLP that takes raw coordinates without high frequency information (like in NeRFs) as input tends to learn smooth functions, making it hard to represent complex parts and thin structures.
For the parametric network, I sample random 2D points from the unit square and concatenate each of them with the 512-dimensional image feature. The concatenated vector is passed through a 3-layer MLP (514 → 256 → 128 → 3) with a tanh activation at the end, which maps every 2D point to a 3D point on the surface of the chair. The model is trained with the same Chamfer loss as in 2.2.
Each image: input RGB, predicted point cloud, ground-truth mesh.



F1@0.05: 69.7 (point decoder from 2.2: 80.0)
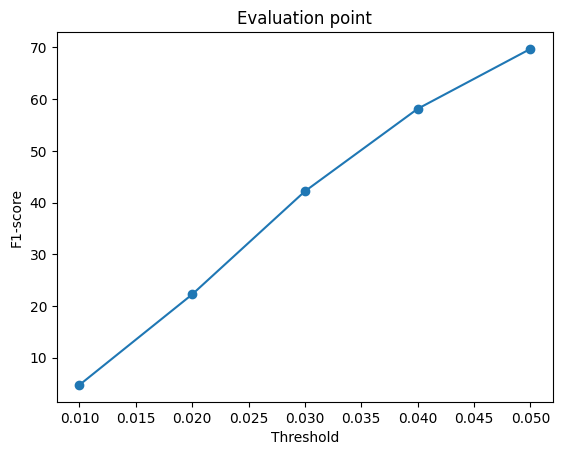
The parametric decoder performs worse than the point decoder. Visually, its points lie on a more connected surface, but it models thin structures less well as the point decoder. This is likely because the decoder is a continuous function of the 2D point, so it maps the unit square onto a single deformed set of 3D coordinates, which has to stretch to cover a chair with several separate parts. Additionally, the model is probably underfitted because it has less than 1M parameters.
The point model from 2.2 retrained on chairs, cars and planes, then evaluated on the same 678 chair test images.
| Training data | F1@0.05 on chair test set |
|---|---|
| Chairs only (2.2) | 80.0 |
| Chairs, cars and planes | 79.7 |
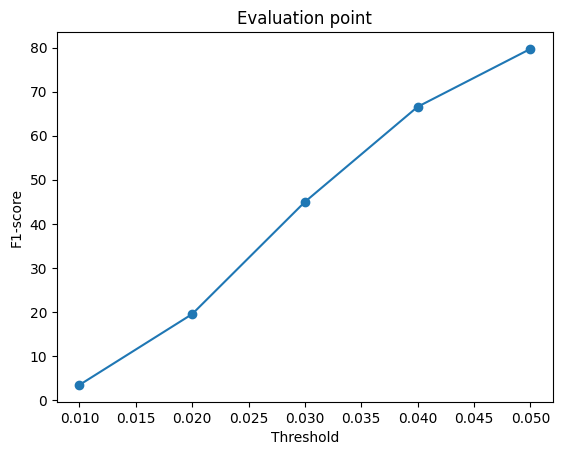
The same test chairs, trained on chairs only (top of each pair) and on three classes (bottom of each pair):


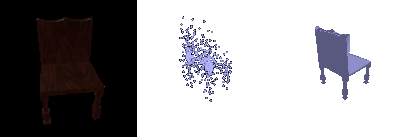
Training on three classes doesn't really affect the F1 score on the chair test set. Visually, the generation quality are also similar. This is likely because that the three classes are distinct enough for the encoder to distinguish.