Due to limited GPU resources, I used the provided pretrained ResNet18
image features using the --load_feat argument. The
reconstruction decoders were trained and evaluated on CPU.


F1@0.05 = 44.136

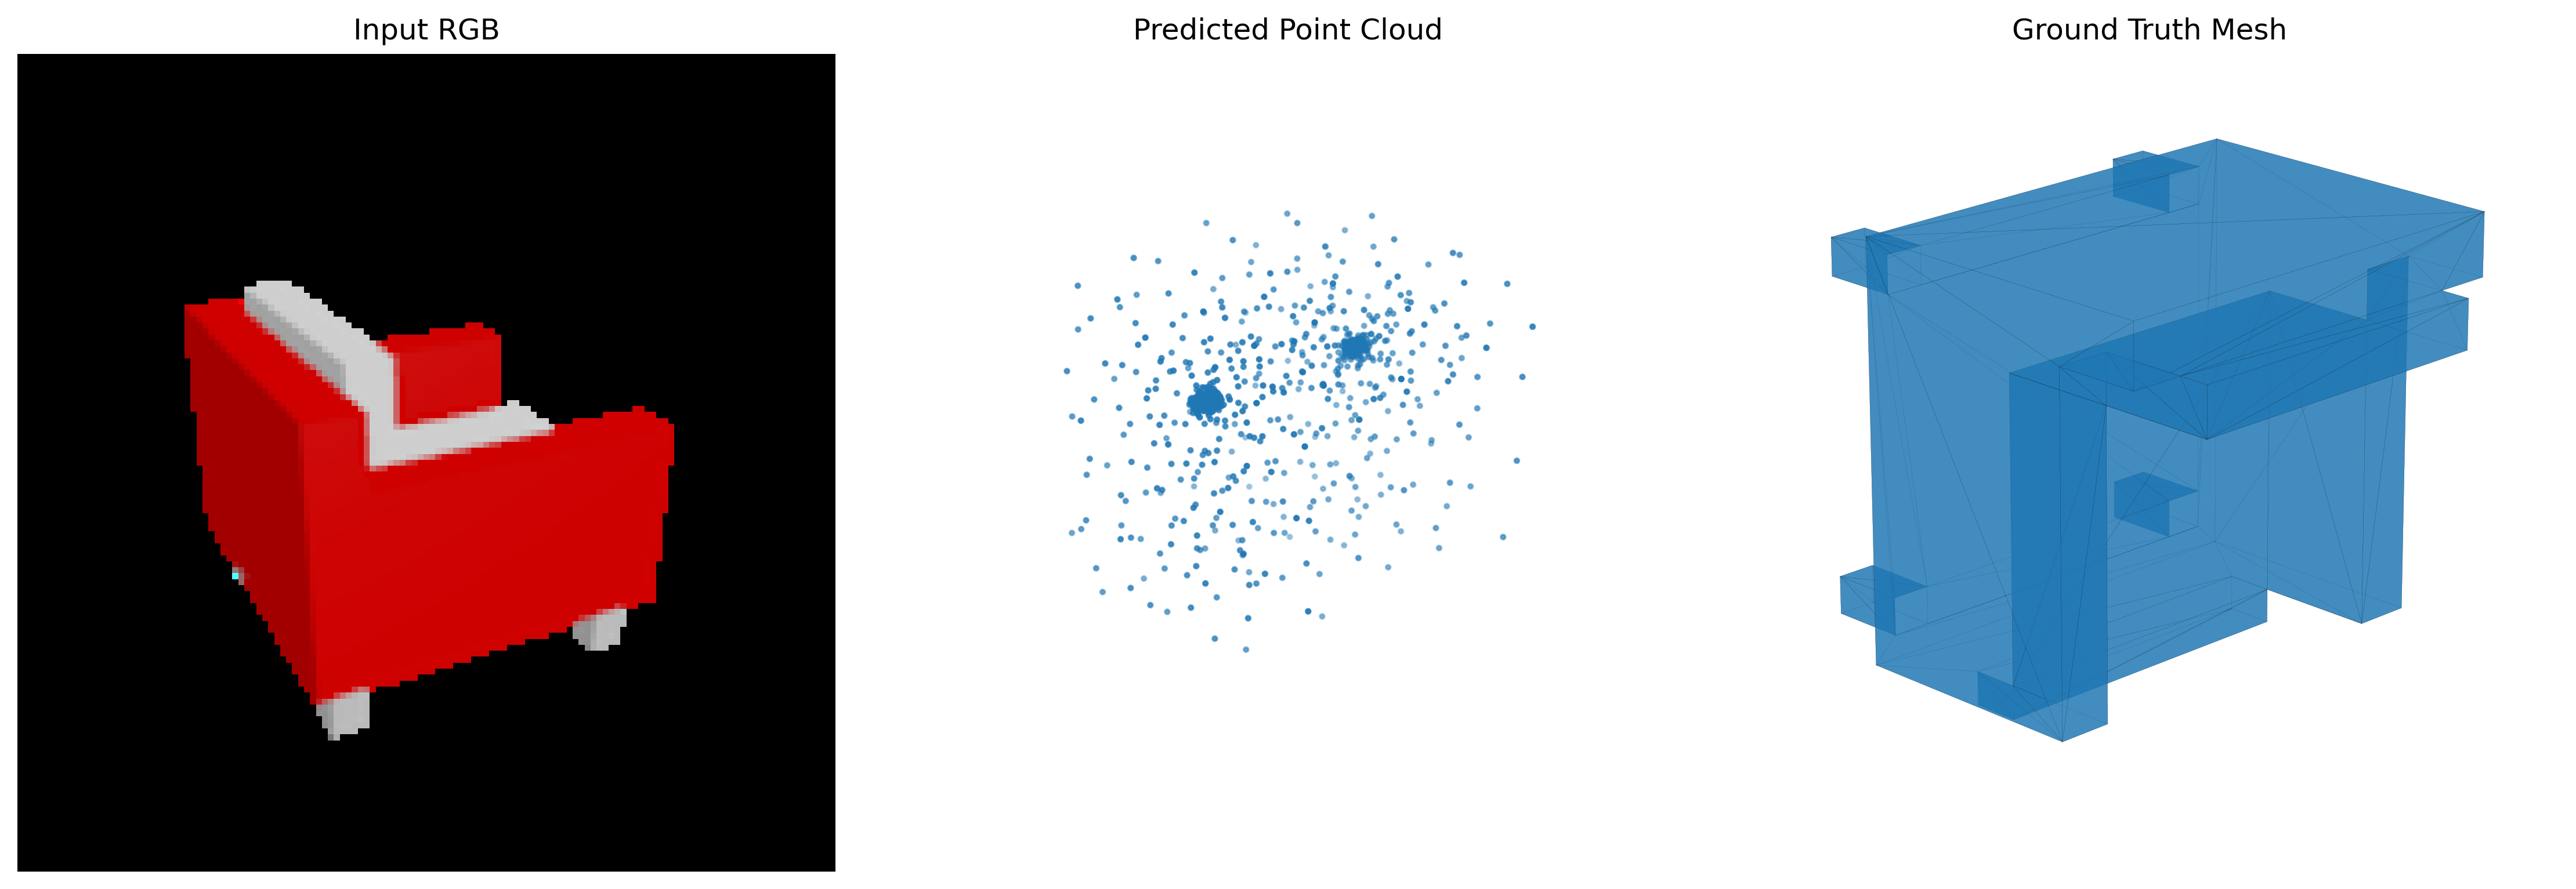
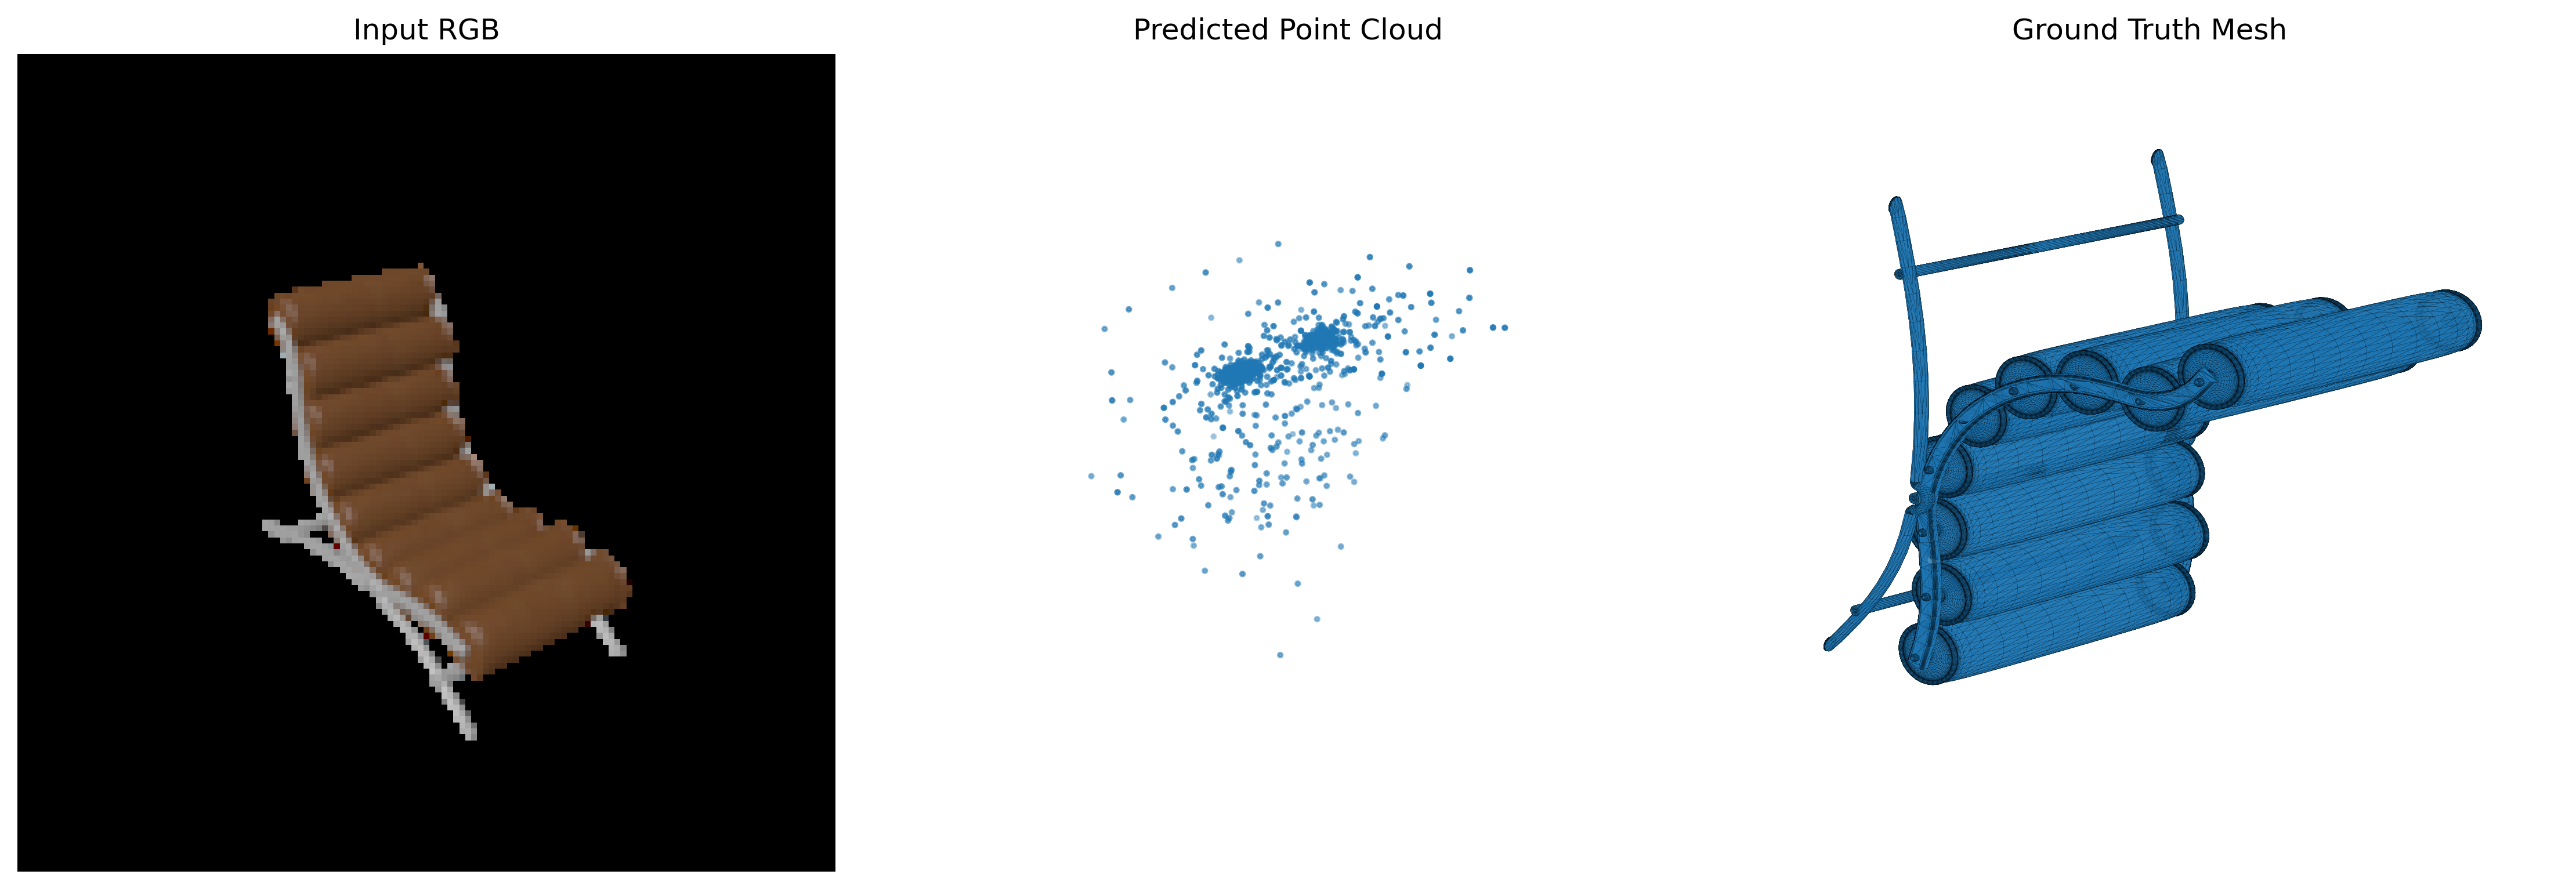
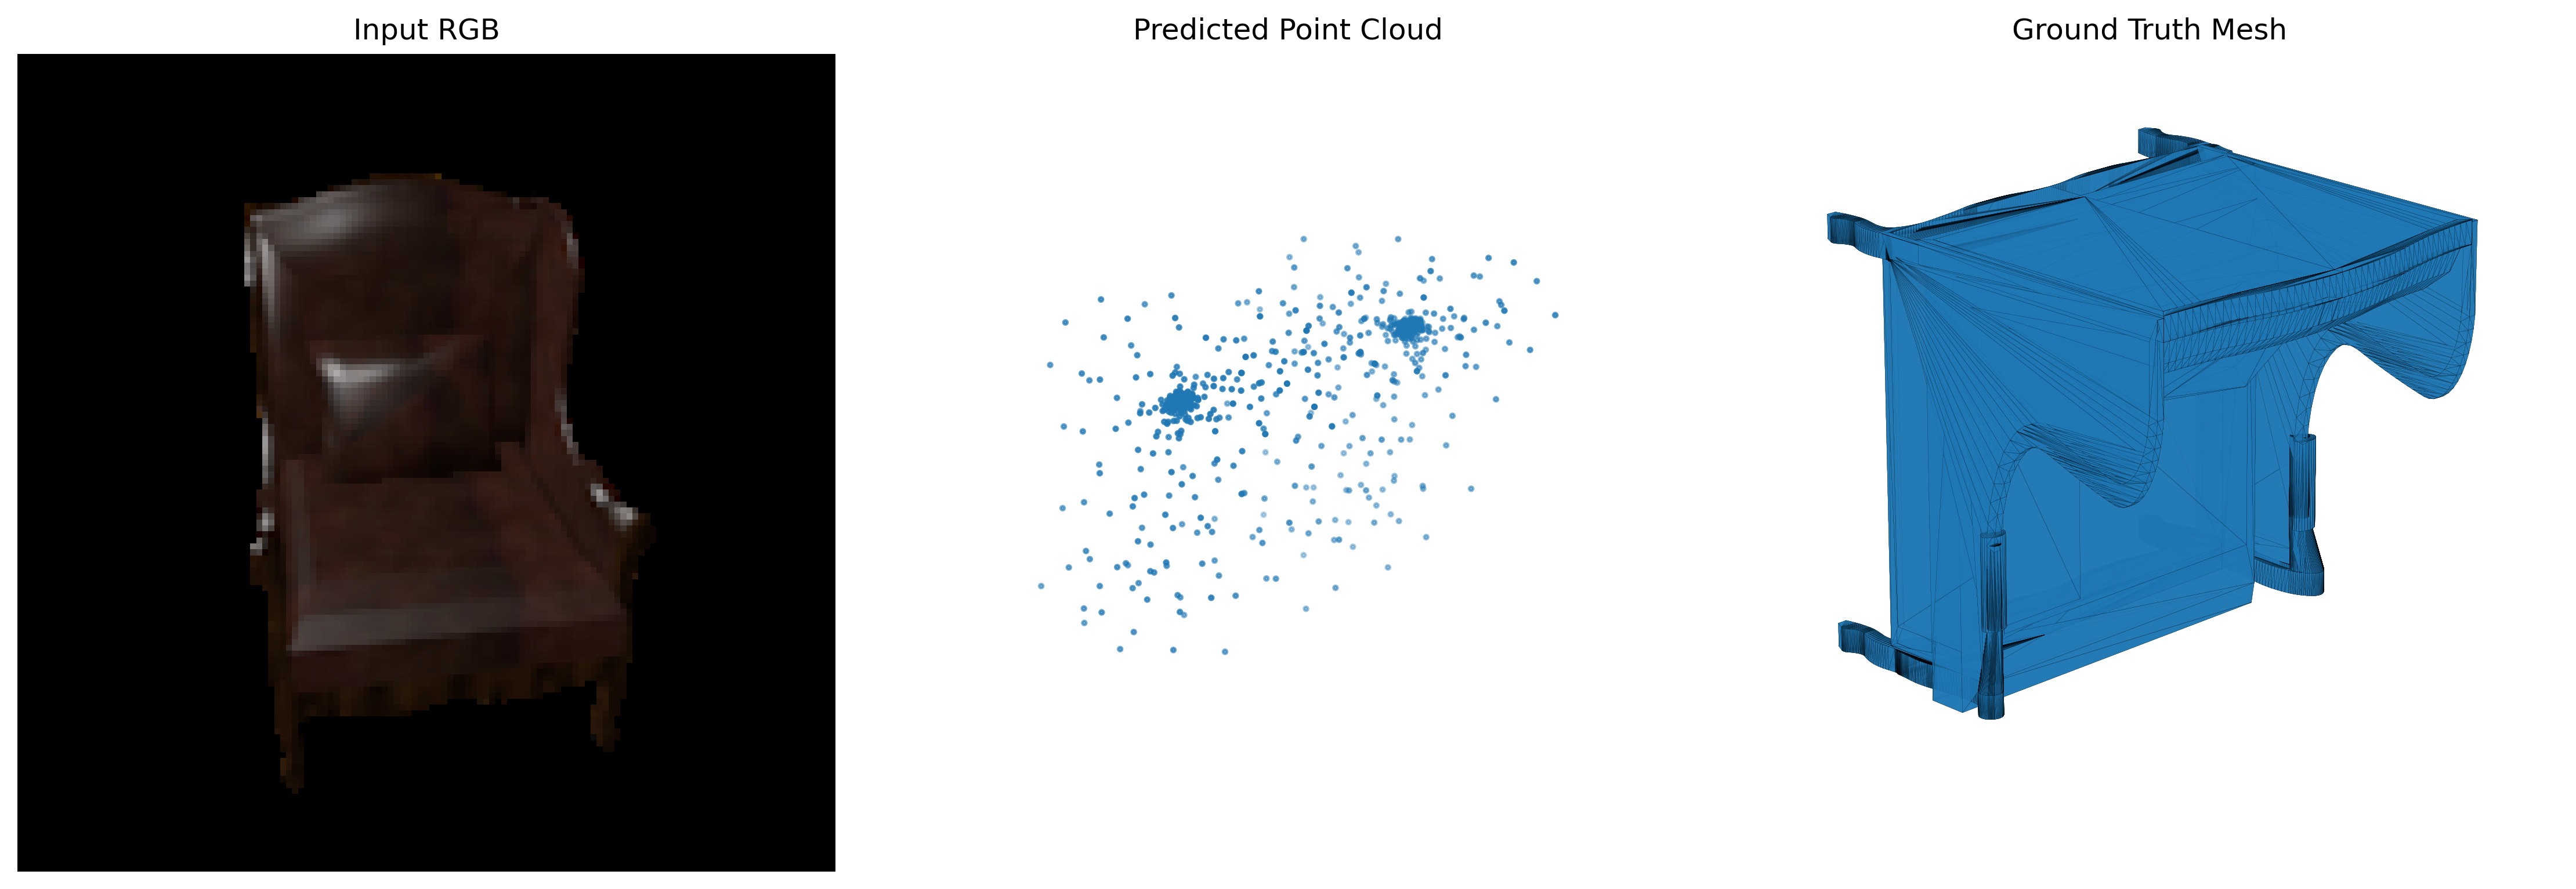
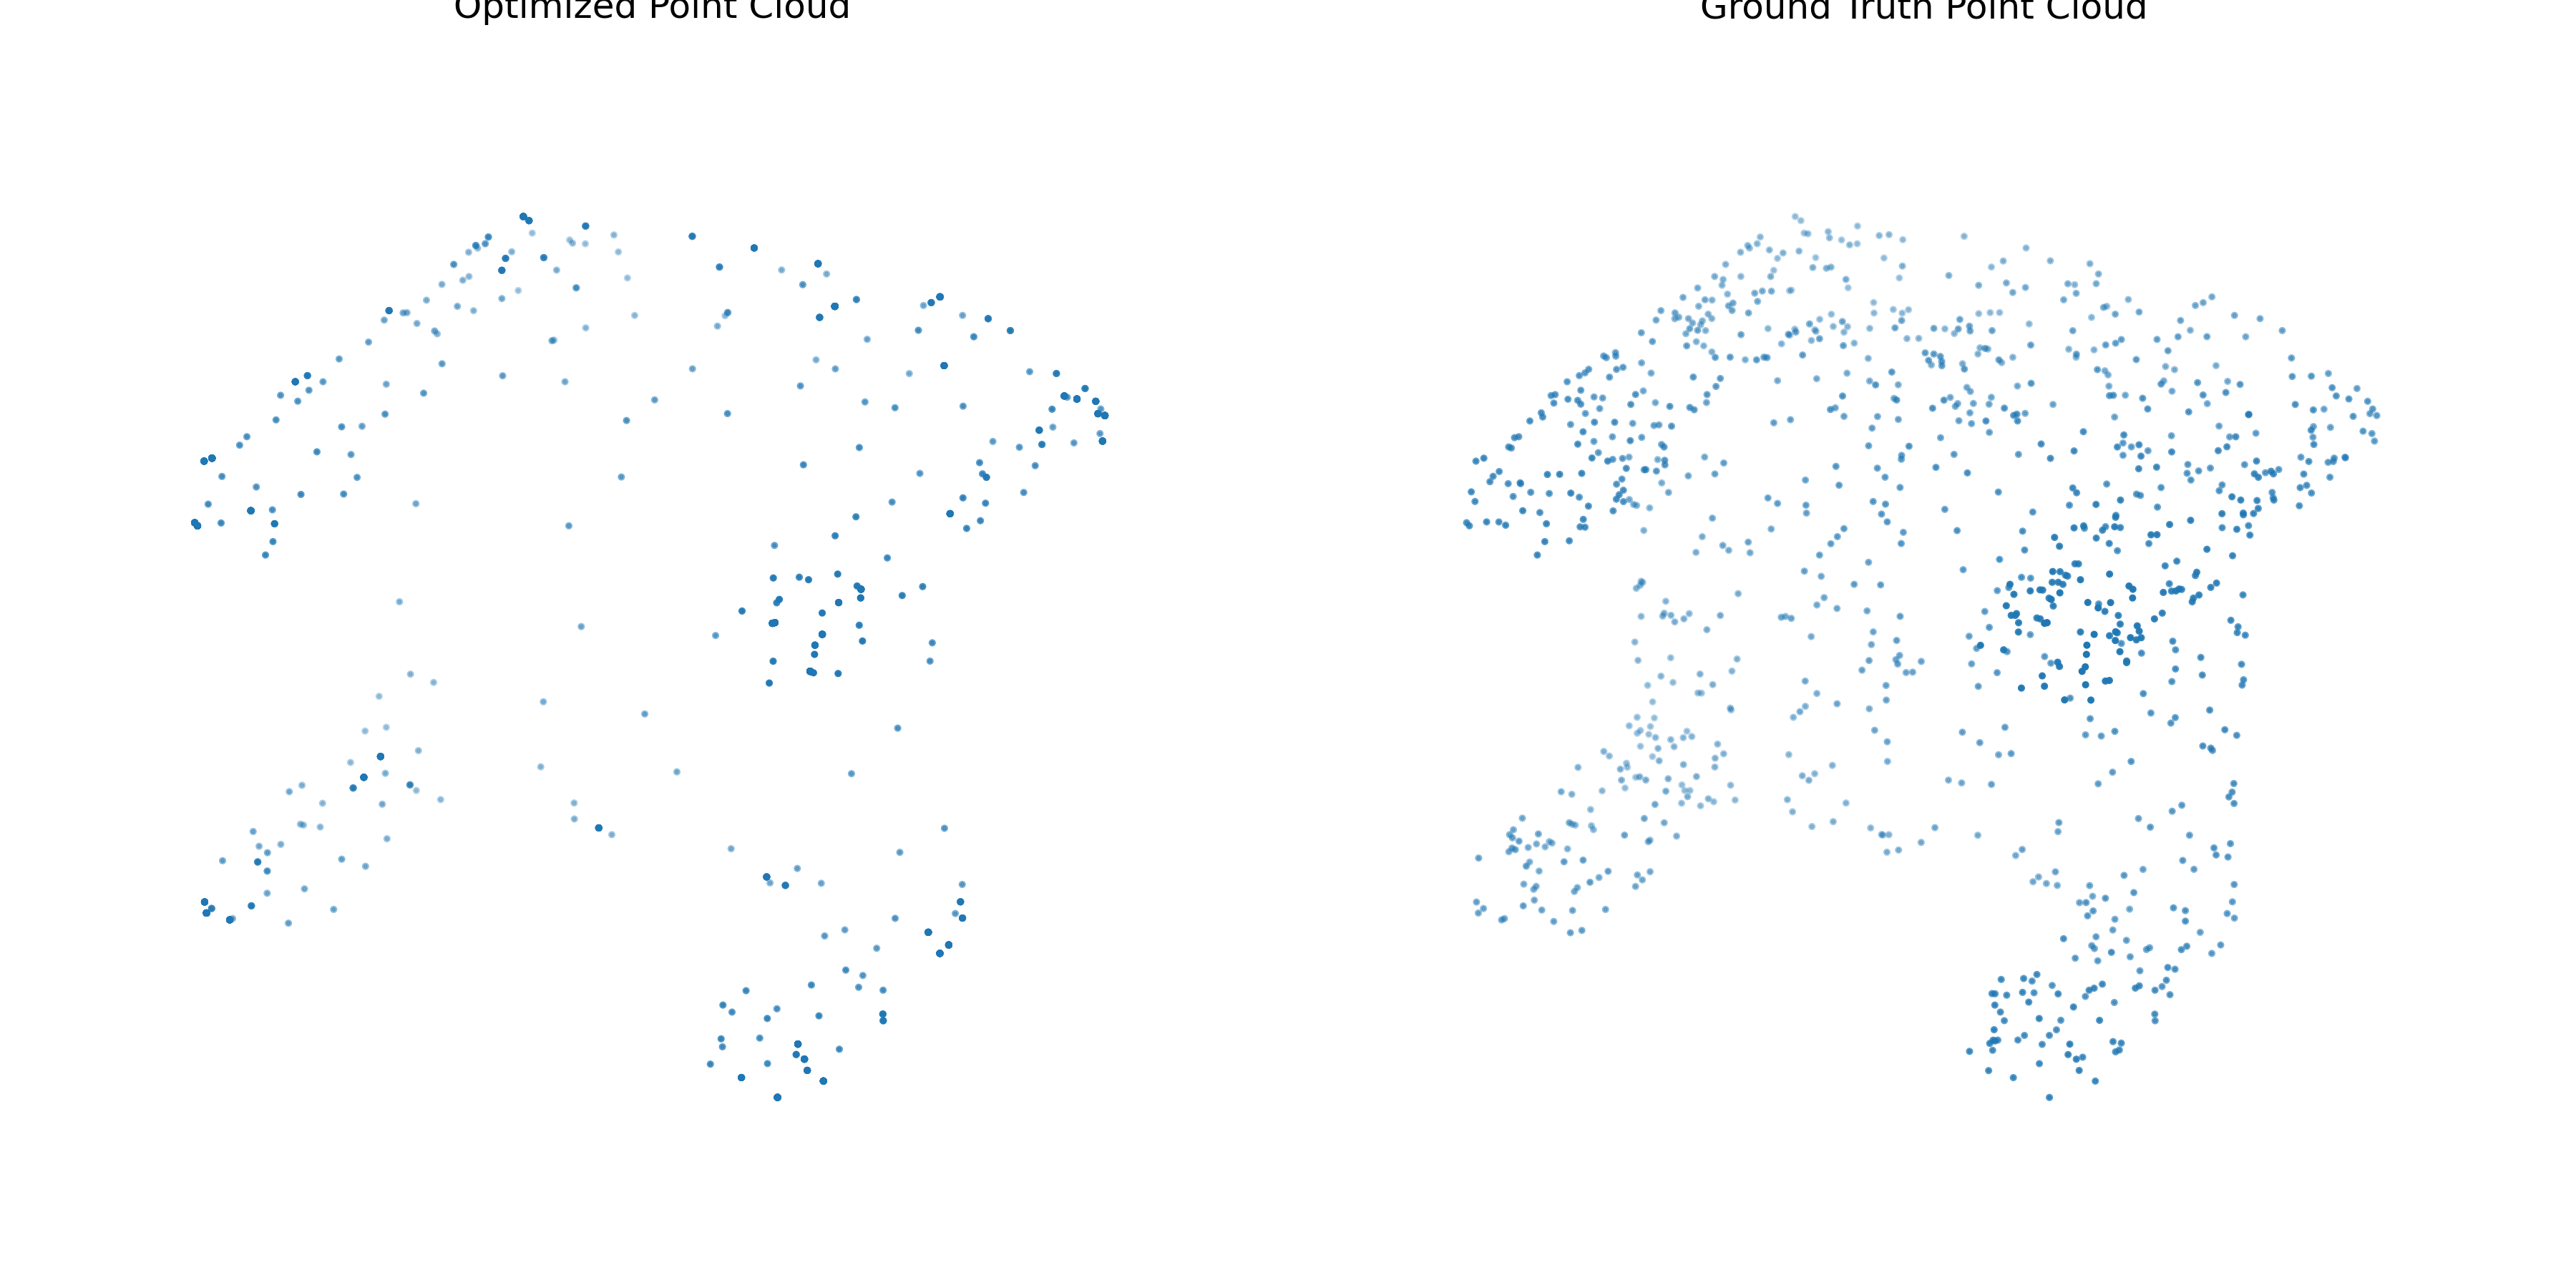
F1@0.05 = 73.738
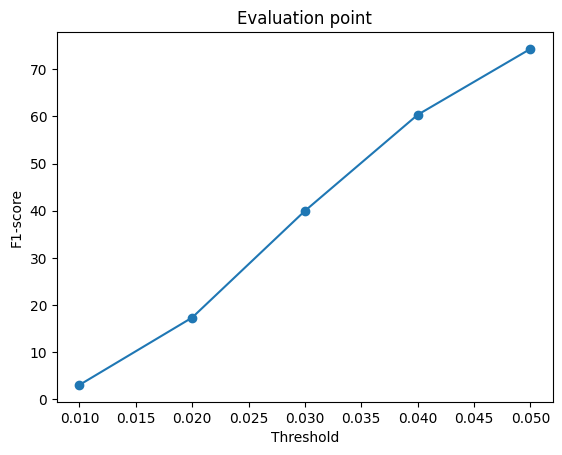
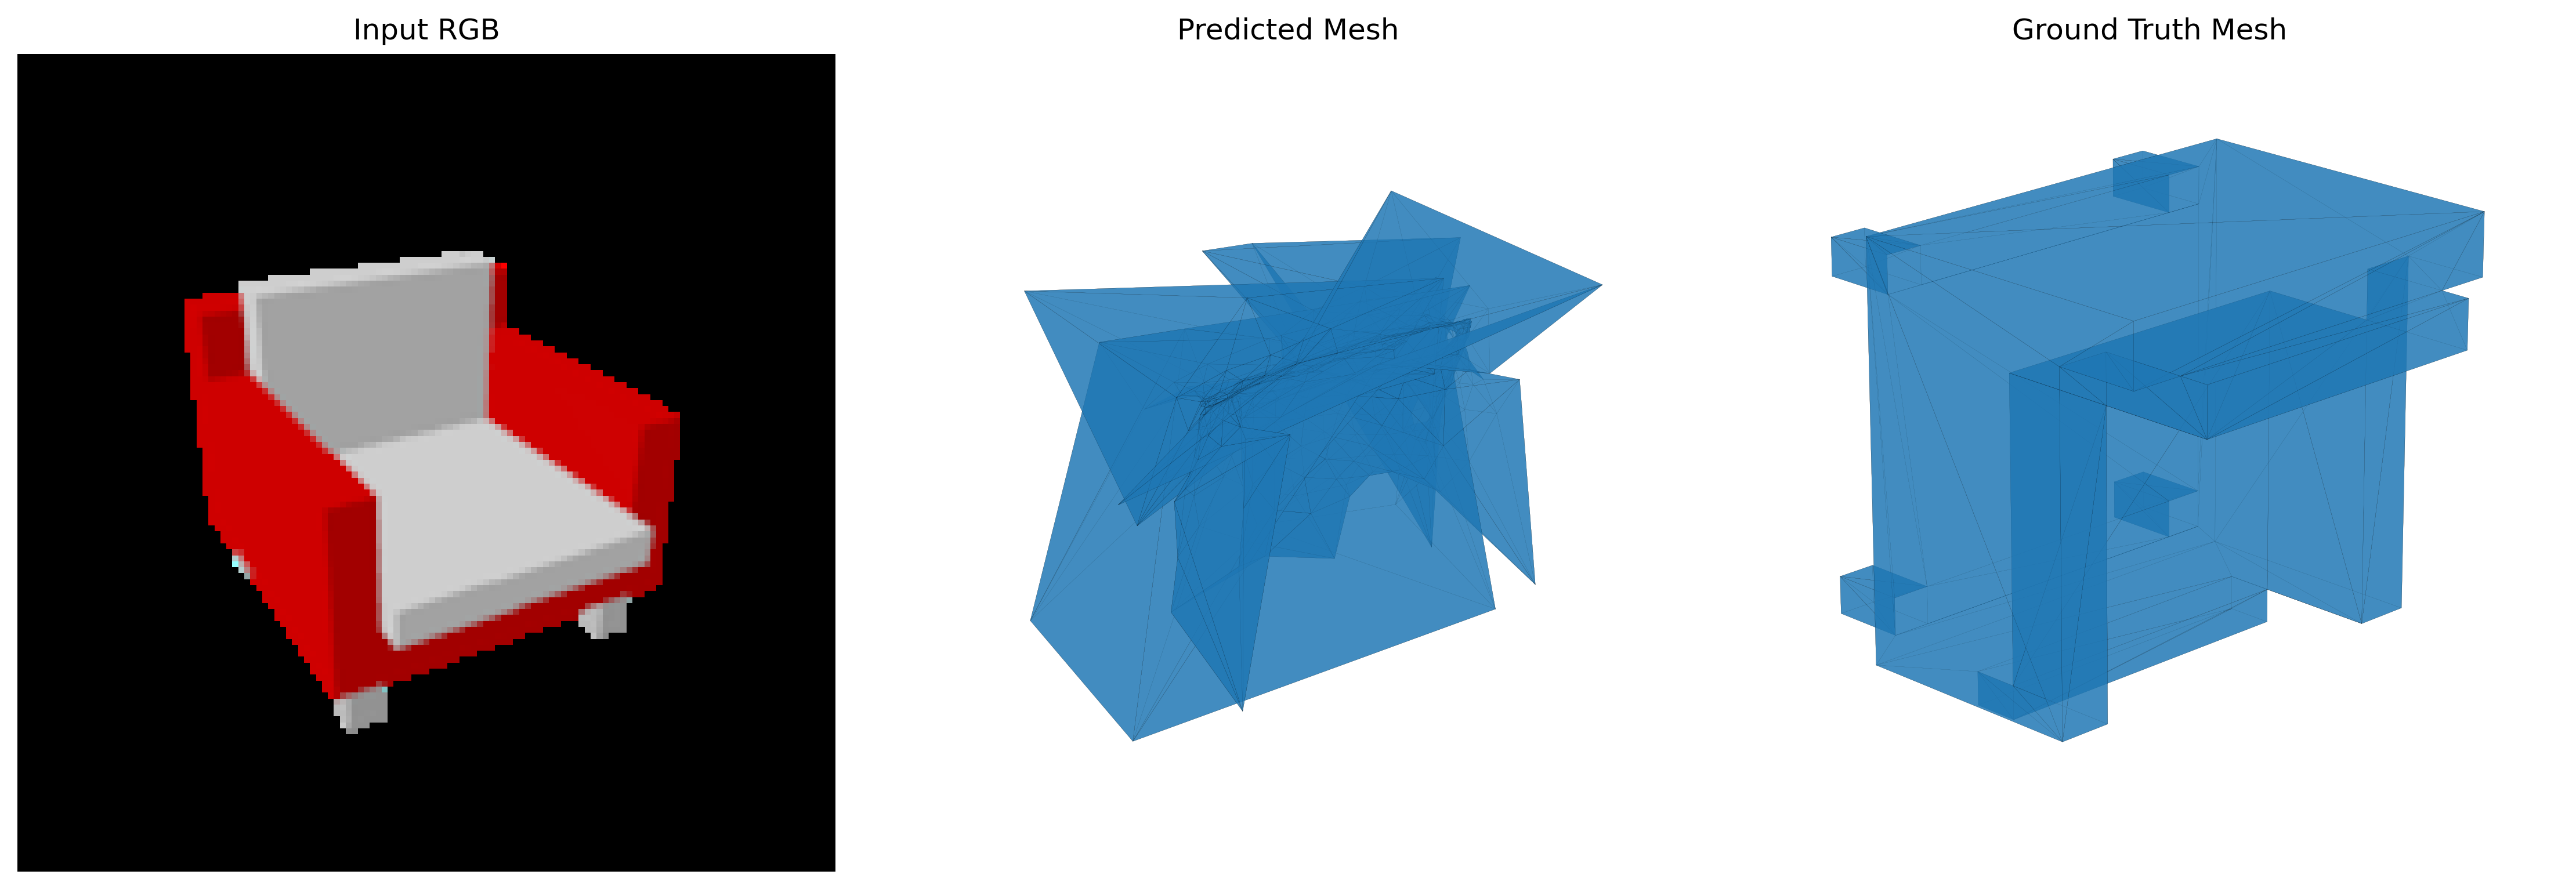
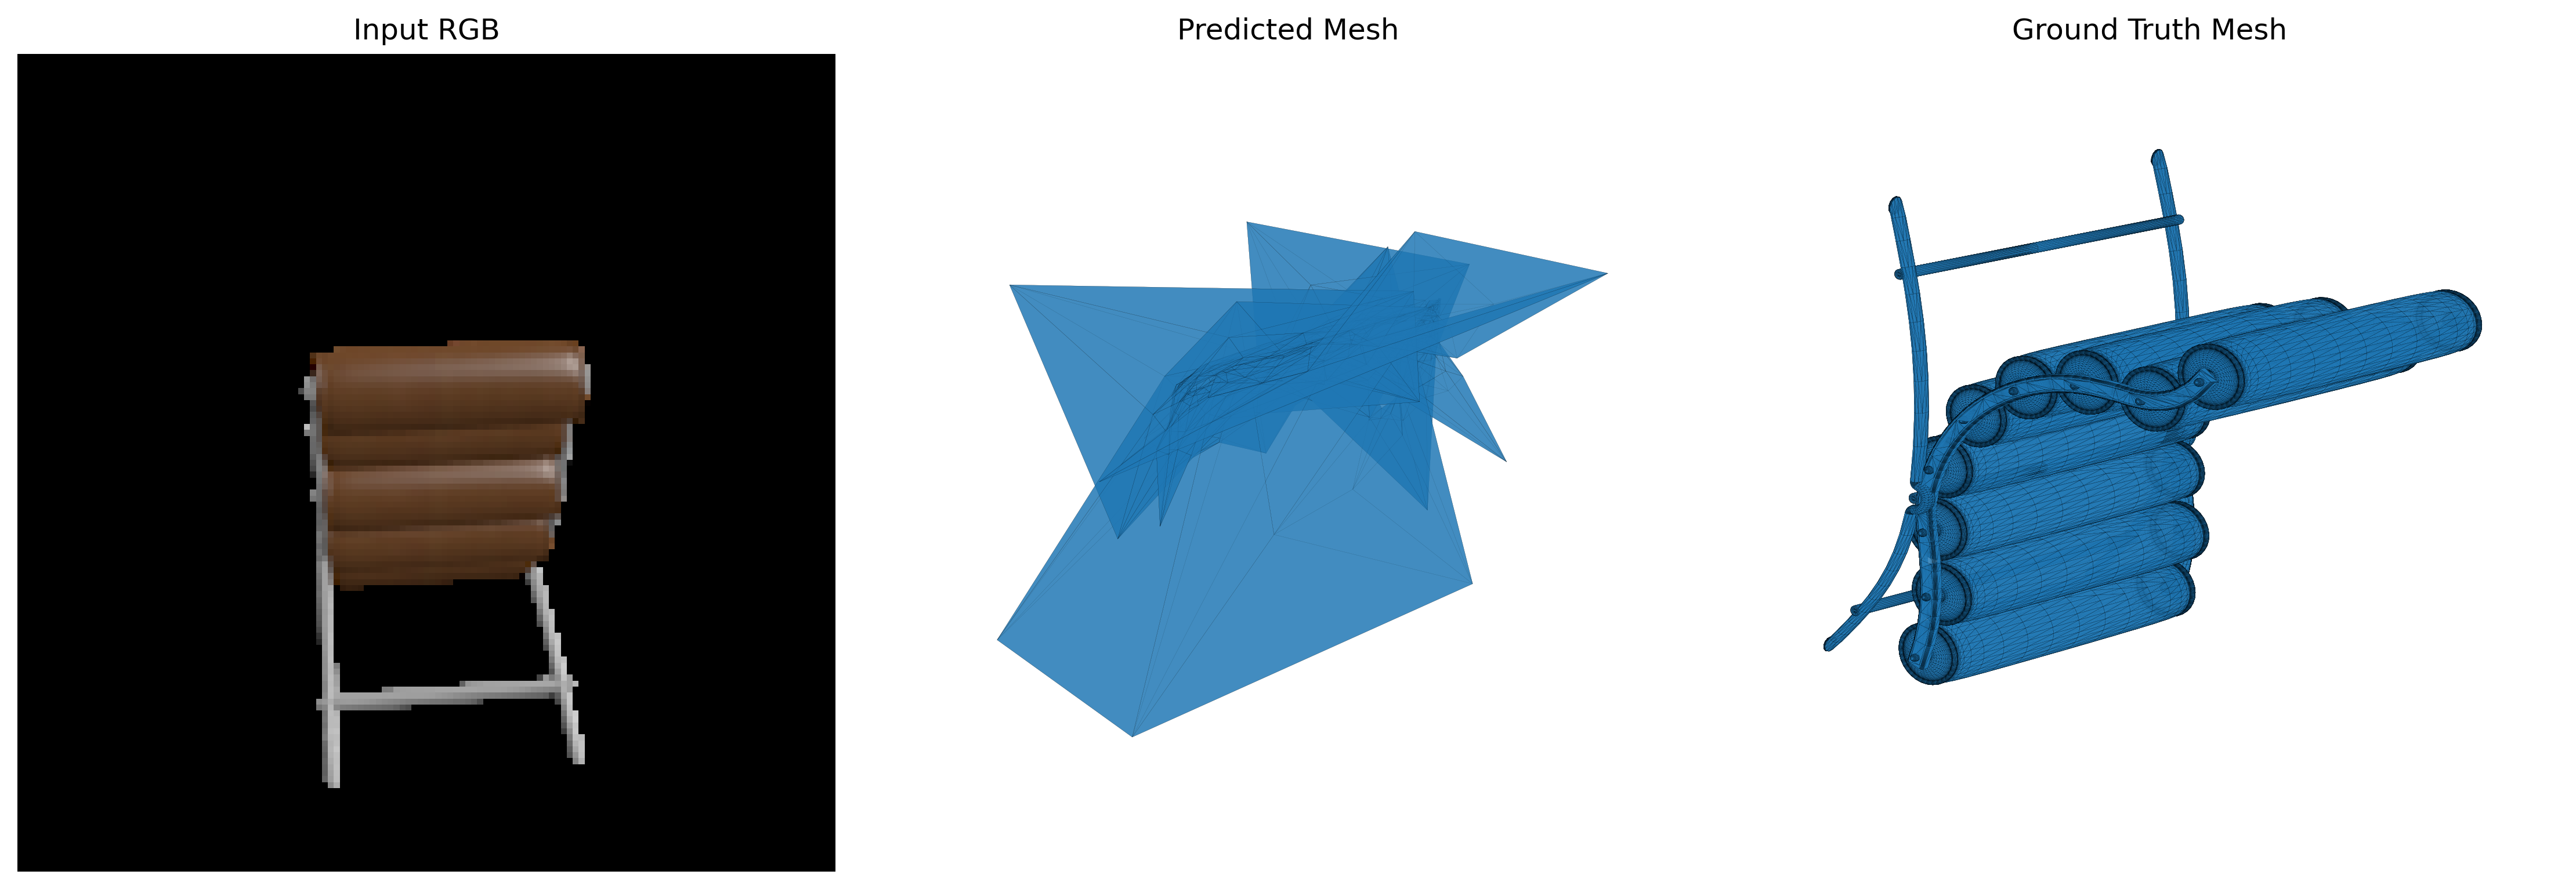
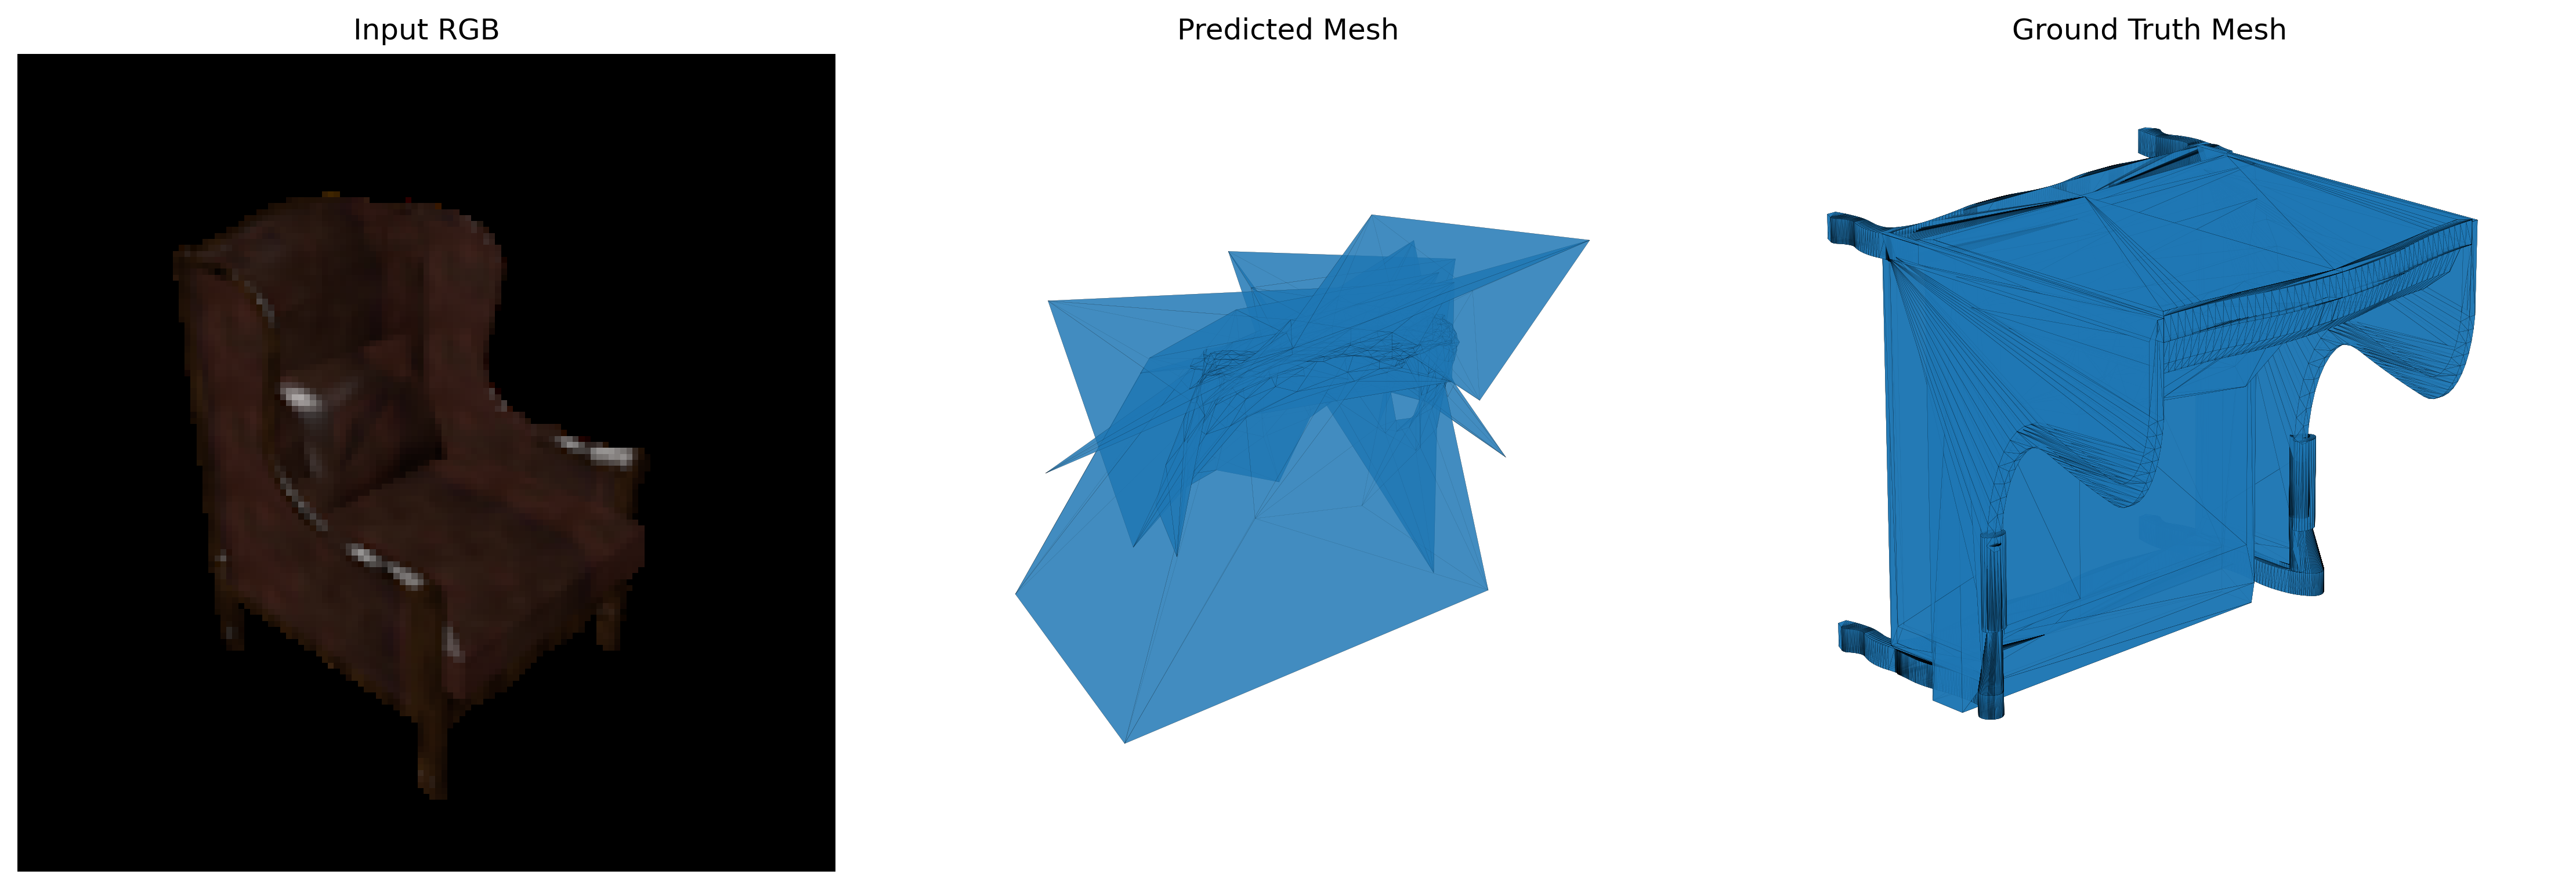
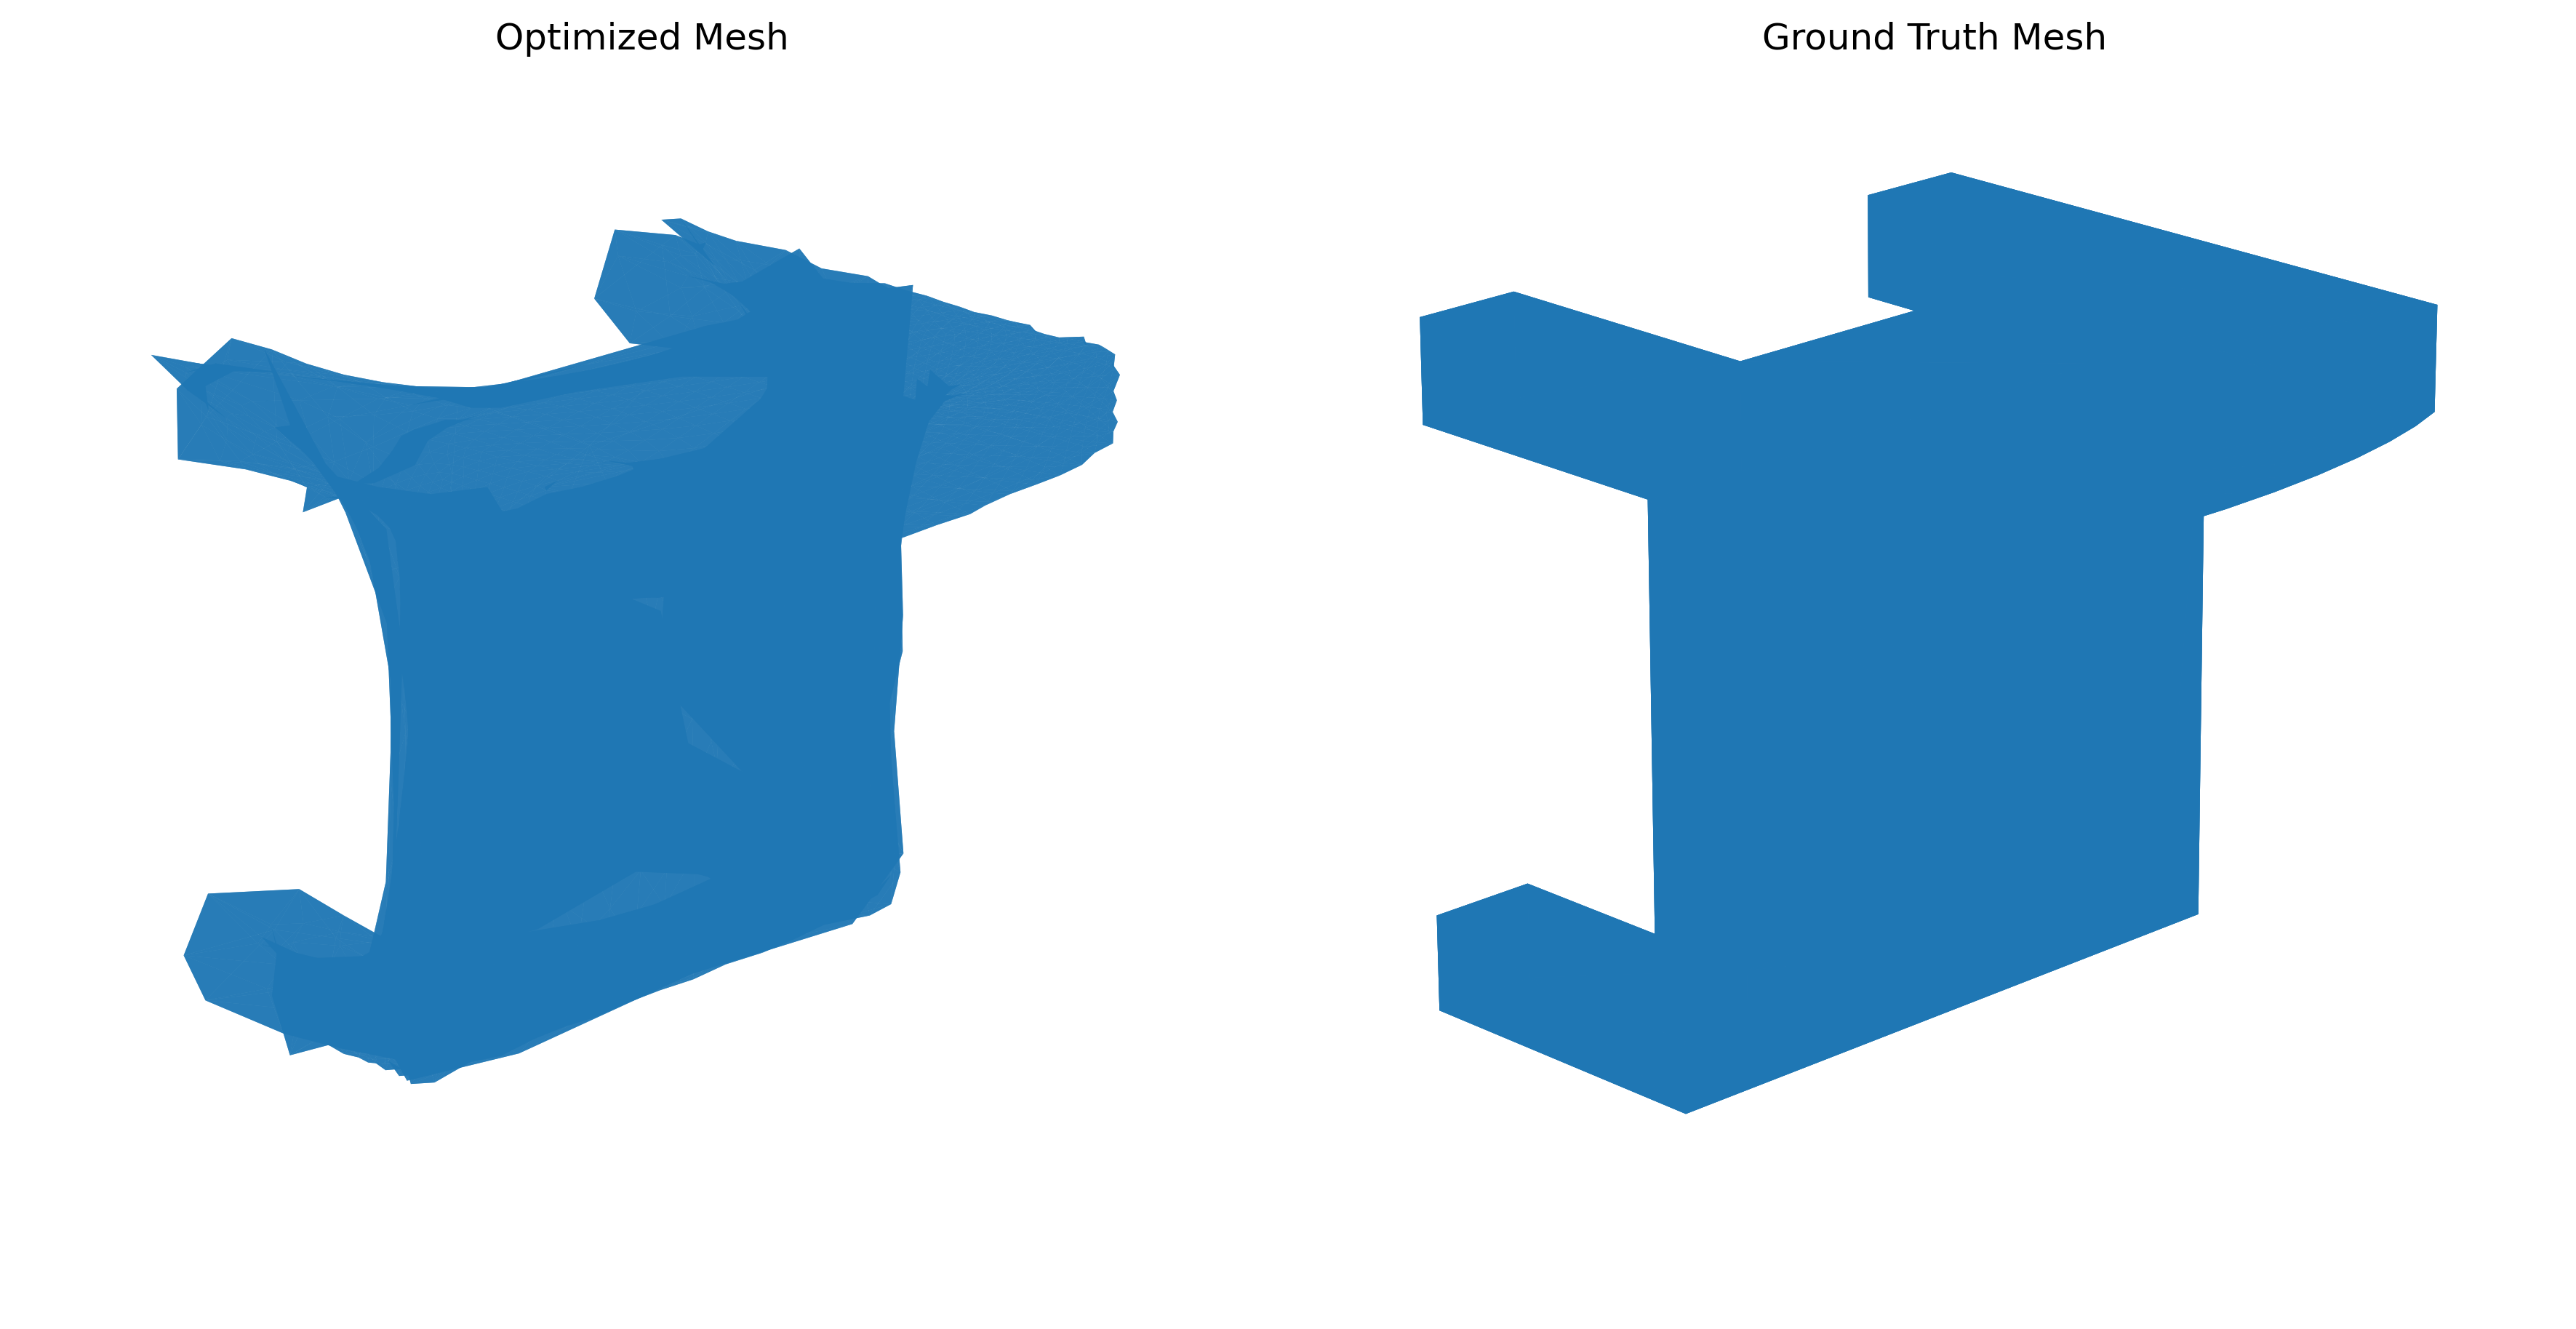
F1@0.05 = 68.792

| Representation | F1@0.05 |
|---|---|
| Voxel | 44.136 |
| Point Cloud | 73.738 |
| Mesh | 68.792 |
The point cloud model had the best F1 score because it directly predicts 3D points and does not have to follow a fixed shape structure. The mesh model also predicts in 3D, but it is limited by the shape and connectivity of the starting icosphere. The voxel model had the lowest F1 score because it represents the object on a fixed 32 × 32 × 32 grid, which makes it harder to capture small details.
I analyzed the effect of changing the subdivision level of the initial icosphere used by the mesh reconstruction model.
| Icosphere Level | F1@0.05 |
|---|---|
| 2 | 64.994 |
| 3 | 67.272 |
| 4 | 68.792 |
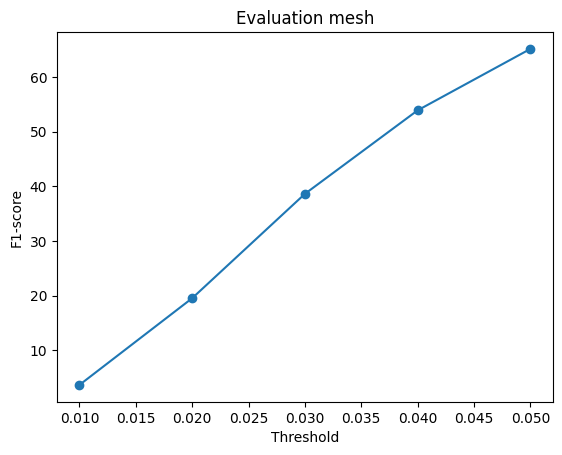
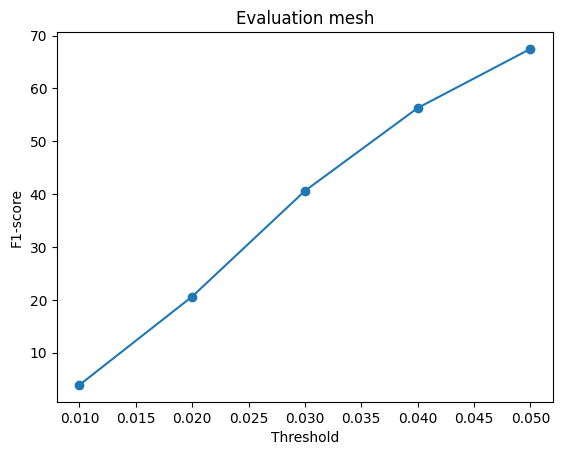
The results show how increasing the number of vertices changes reconstruction performance. A higher subdivision level gives the decoder more geometric freedom but also creates a more difficult prediction problem because substantially more vertex offsets must be estimated.
To better understand the learned representation, I performed interpolation between the pretrained ResNet18 image features of two different chair images.
The feature vectors of the two images were linearly interpolated using different values of alpha. Each intermediate feature was then passed through the trained point cloud decoder.

The predicted point clouds change gradually as alpha moves from 0 to 1. This suggests that the model learned a continuous representation of object geometry in feature space. Intermediate feature vectors produce intermediate 3D structures instead of abrupt changes between the two endpoint objects.
I implemented an implicit reconstruction network that predicts occupancy as a function of the image feature and a queried 3D coordinate.
A 32 × 32 × 32 grid of coordinates was generated in the normalized coordinate space from -1 to 1.
The implicit function:
Image Feature + (x, y, z) → Occupancy
F1@0.05 = 47.055
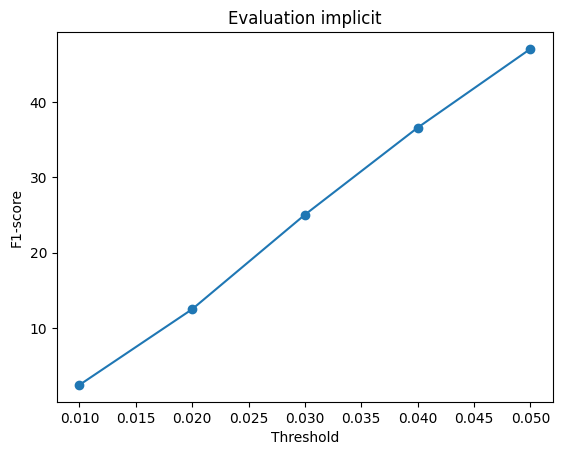
The implicit model achieved a higher F1 score than the standard voxel decoder despite predicting occupancy independently as a function of spatial coordinates. Separately encoding the image feature and 3D coordinates helped the model preserve the spatial information required for reconstruction.
The model represents the mapping:
Image Feature + (u, v) → (x, y, z)
The image feature and sampled 2D coordinates are independently encoded and combined before predicting the corresponding 3D position. Chamfer distance was used to compare the generated surface points with points sampled from the ground truth mesh.
F1@0.05 = 60.632
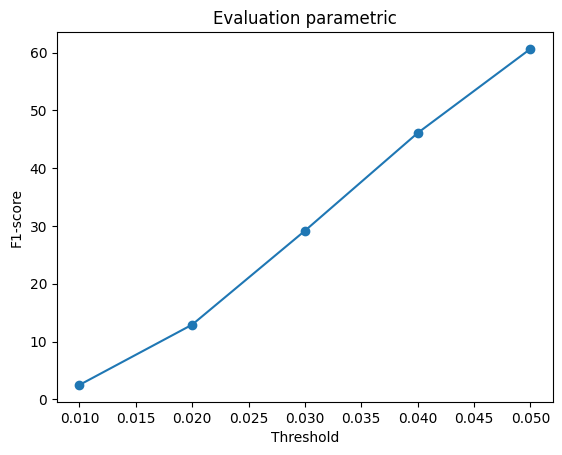
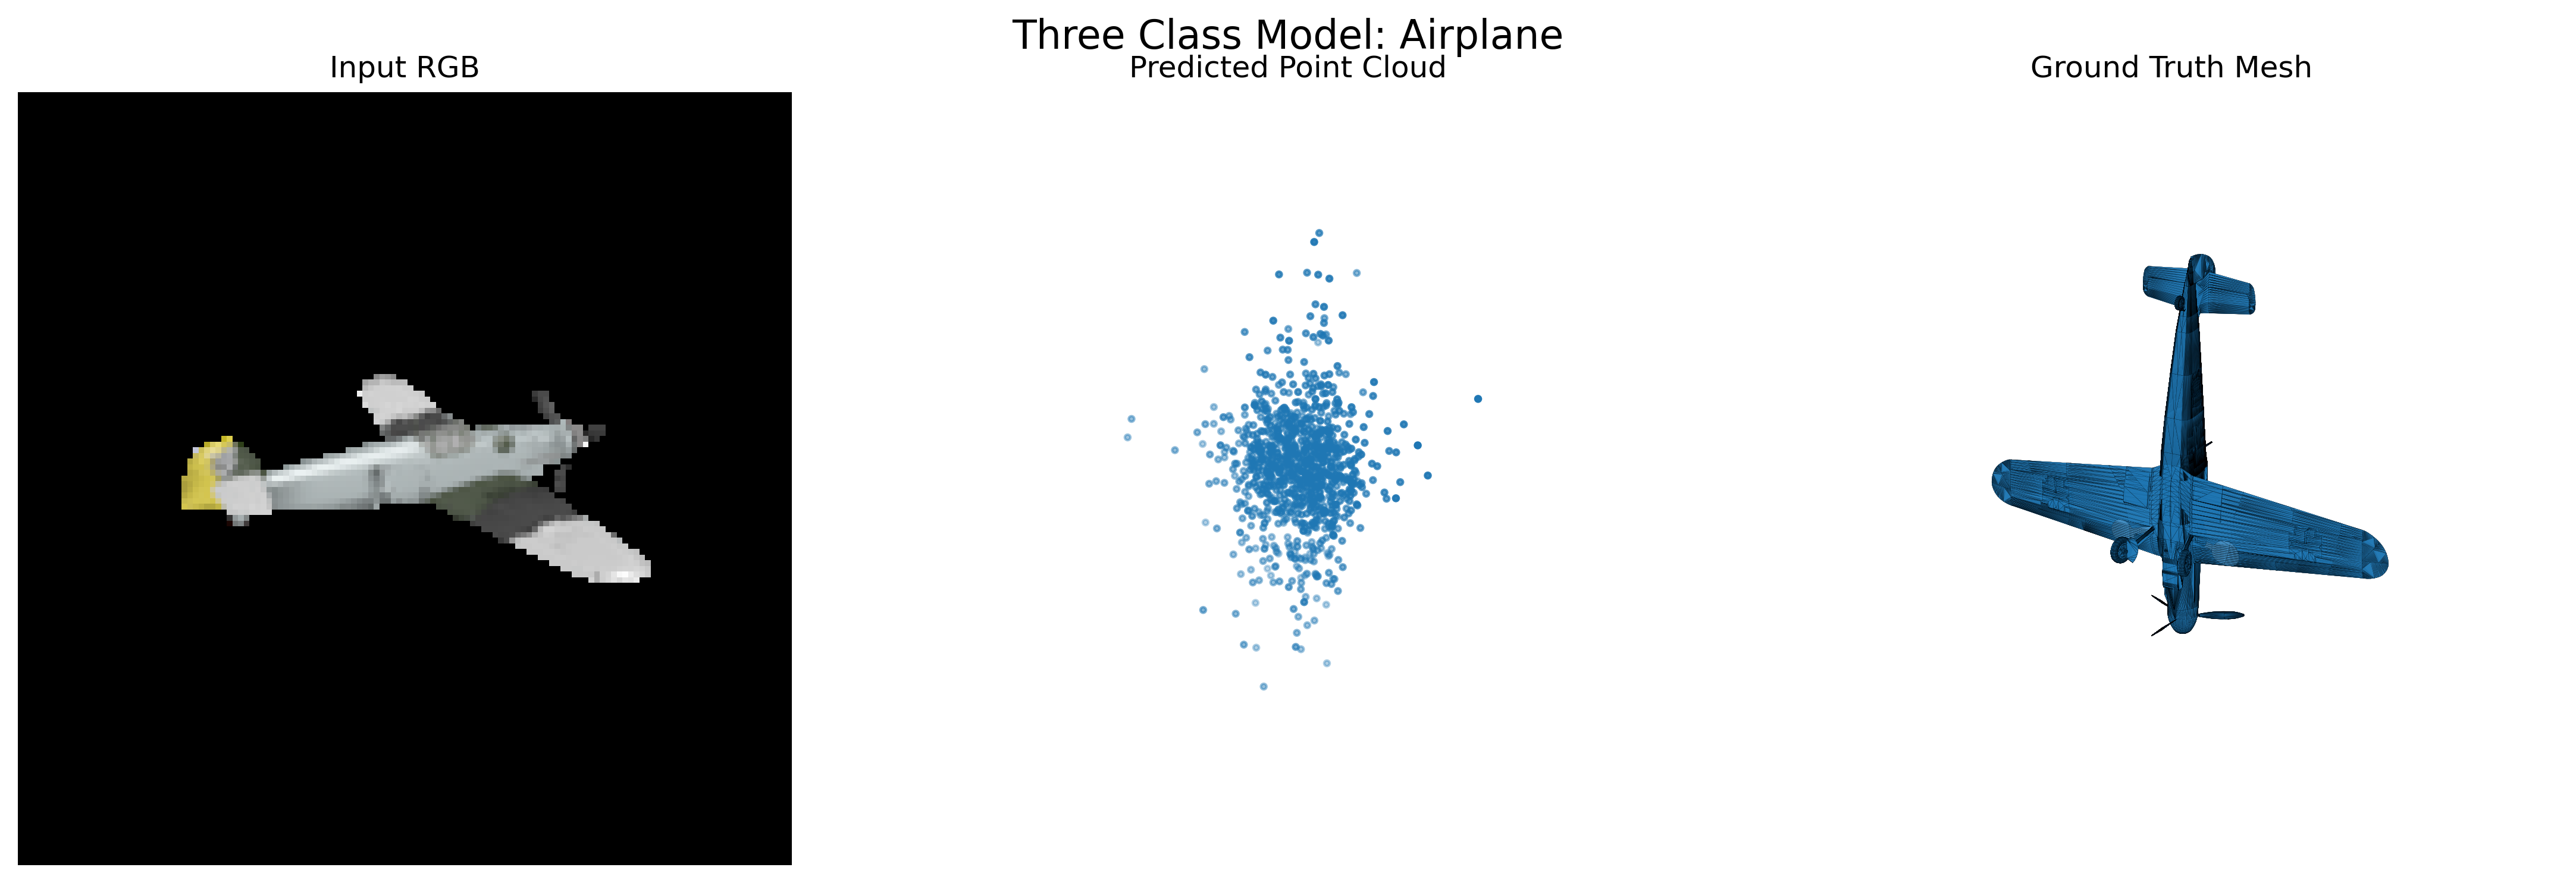
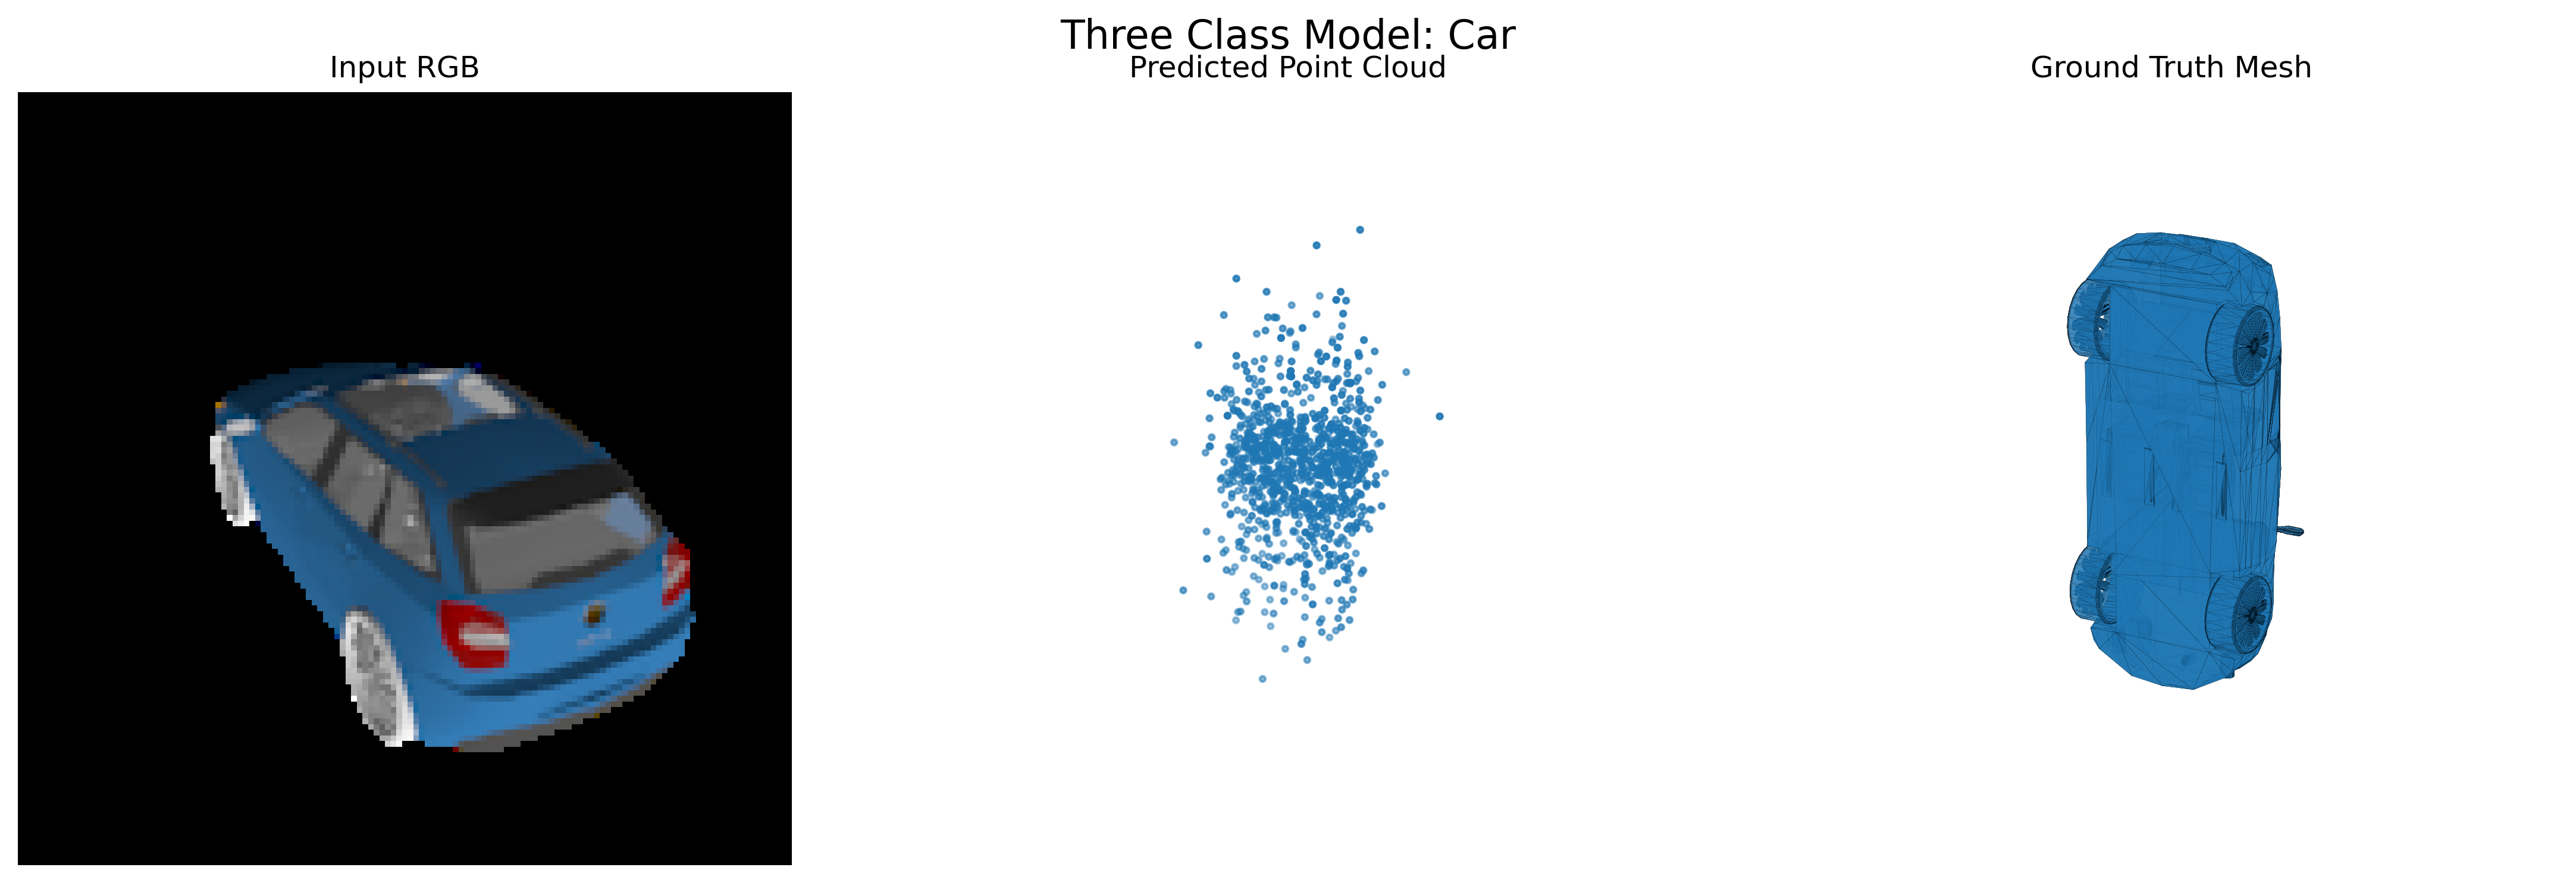
For this experiment, I trained the point cloud reconstruction model on the extended dataset containing three object categories:
Chair, Car, and Airplane
The same point cloud architecture was used so that the effect of increasing the diversity of the training data could be analyzed.
| Training Dataset | F1@0.05 |
|---|---|
| Chair Only | 73.738 |
| Chair + Car + Airplane | 72.312 |
The chair only score was obtained on the chair test dataset, while the three class score was obtained on the complete three class test dataset. Therefore, the values provide a broad comparison rather than a direct evaluation using identical test samples.
The three class model maintained reconstruction performance very close to the chair only model even though it was required to learn substantially more diverse geometries. This suggests that the point cloud decoder was able to learn a representation that generalized across multiple object categories without a large decrease in reconstruction quality.
Chair

Car
Airplane