
Optimized shape on left, ground truth on right
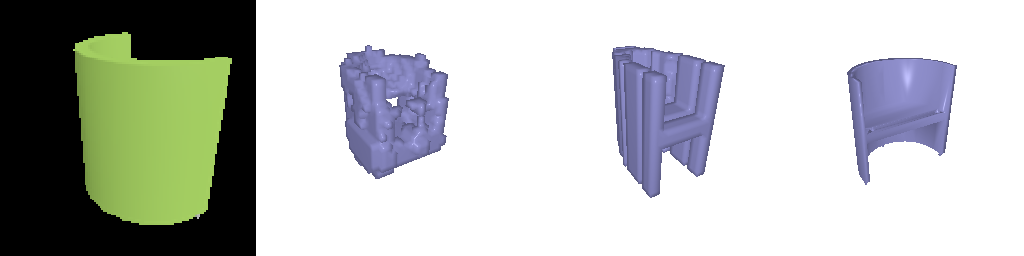
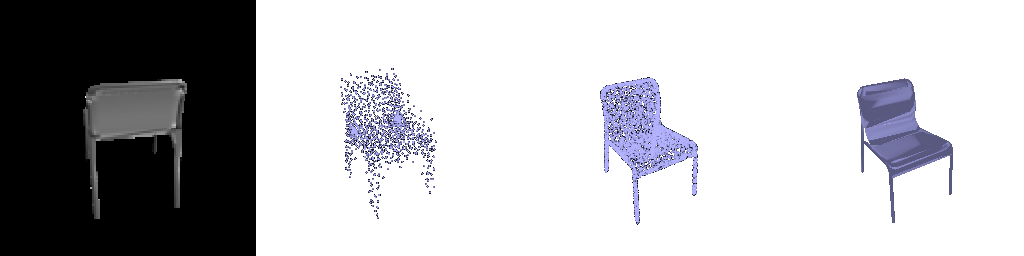
Didn't use --load_feat or cpu training, left to right has input rgb, prediction, ground truth, ground truth mesh
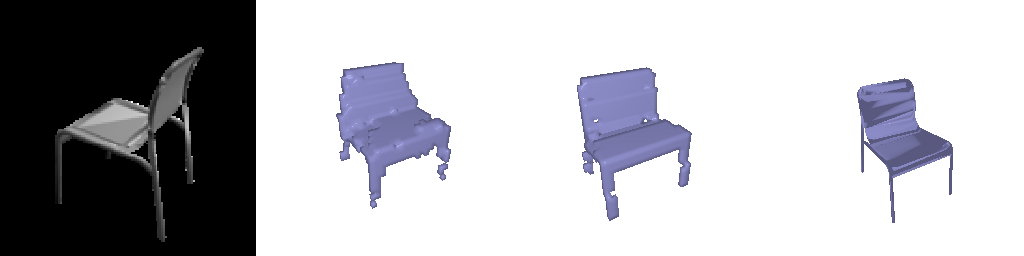
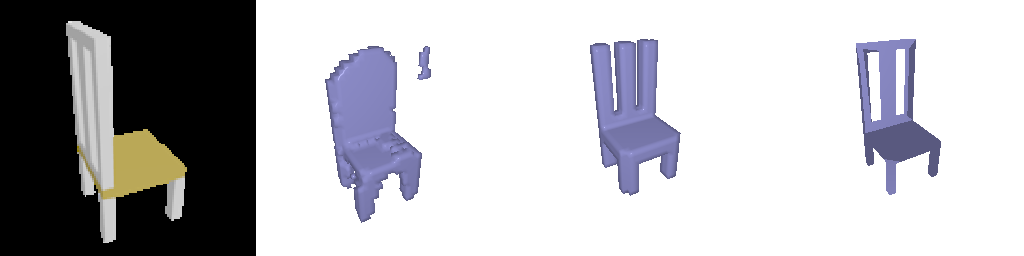
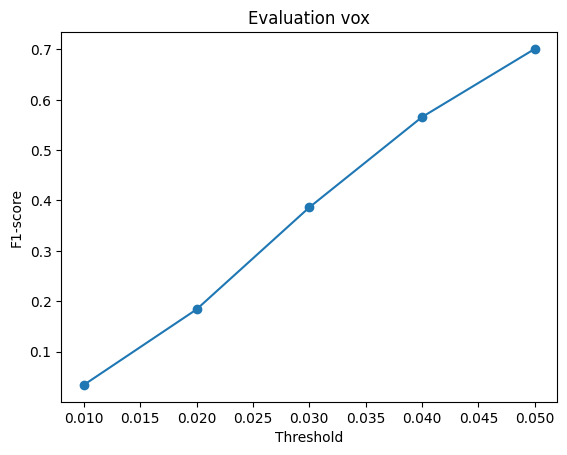
F1@0.05: 0.70
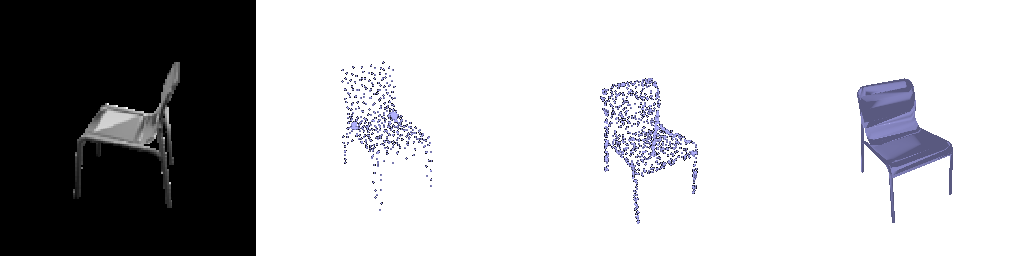
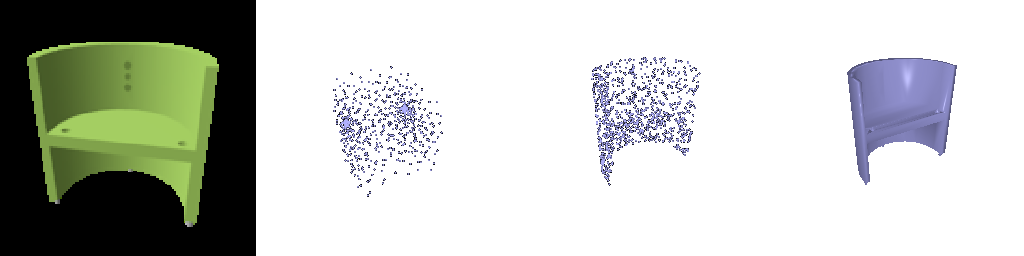
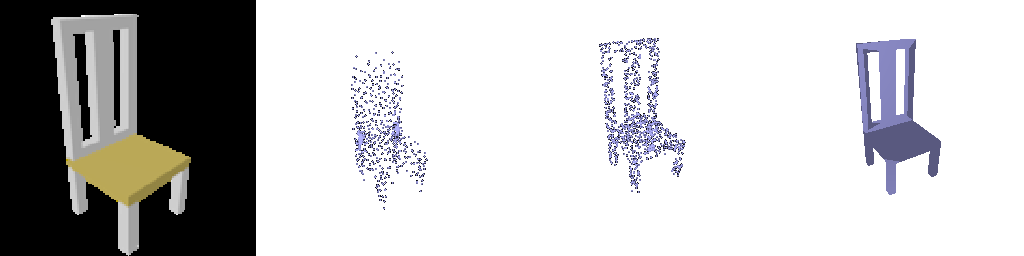
F1@0.05: 0.80
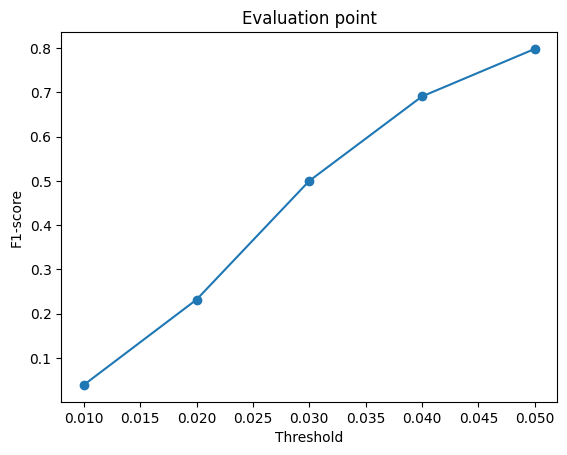
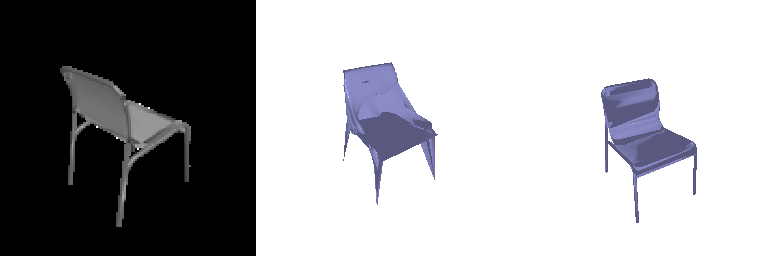
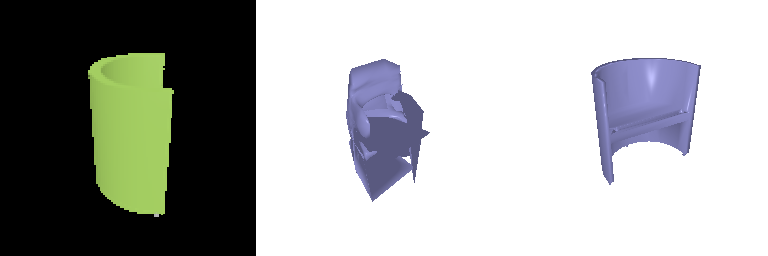
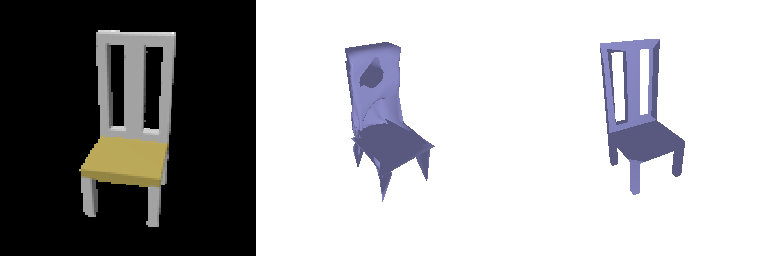
F1@0.05: 0.74
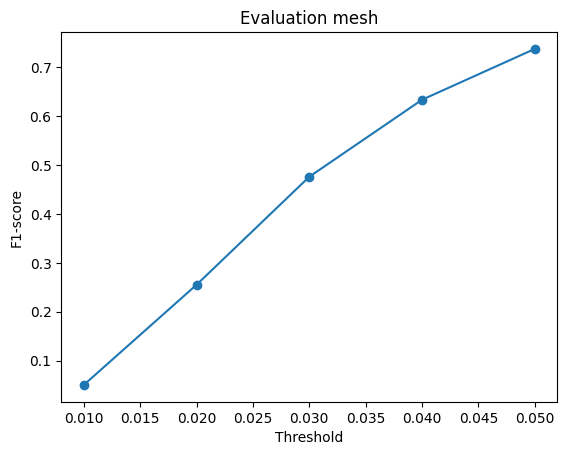
Point clouds score highest (0.80) > meshes (0.74) > voxels (0.70). The point decoder can put every point anywhere and is trained directly on chamfer distance, which is close to what F1 measures. The mesh is a deformed sphere so it can't open holes like the gap in a chair back or between legs, and the smoothing term works against thin parts. Voxels are limited by the grid where one cell is about 3% of the chair so thin legs disappear or break into floating pieces.
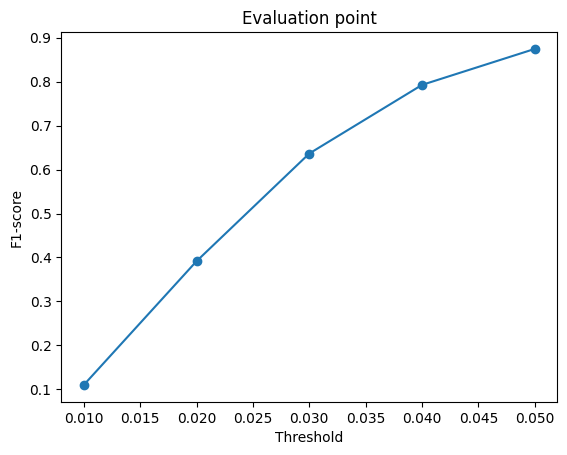
I varied n_points for the point cloud model to be 500, 1000, or 5000
n_points = 500, F1@0.05: 0.74
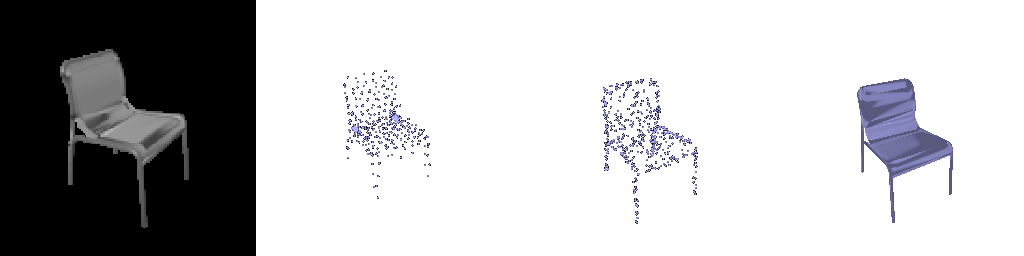
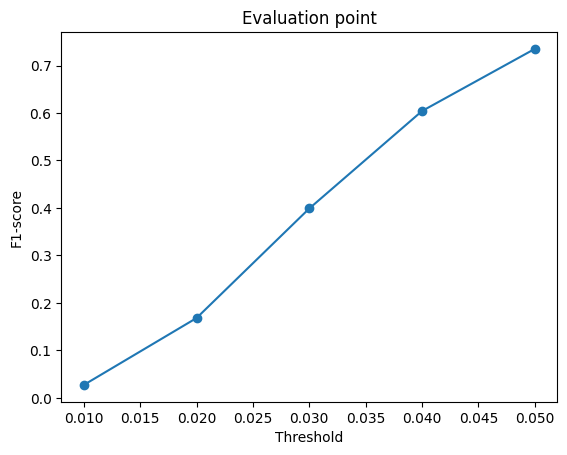
n_points = 1000, F1@0.05: 0.80
n_points = 5000, F1@0.05: 0.88
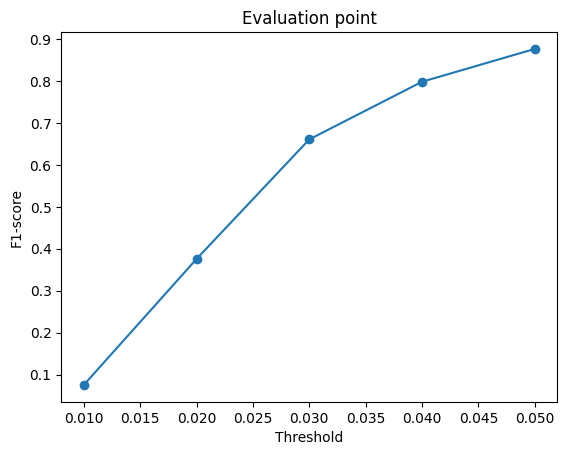
F1 goes up with more points because more of the surface gets covered, so recall improves and thin parts like legs get some points. However evaluate() samples the same number of ground truth points as n_points, so the denser models are also compared against a denser ground truth. This could be causing part of the increase in score from 0.74 to 0.88. Also, training time didn't really change because data loading was the bottleneck.
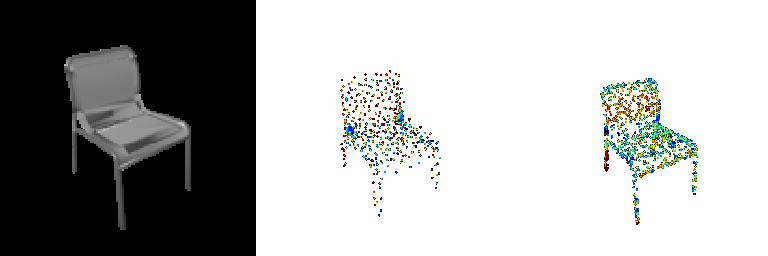

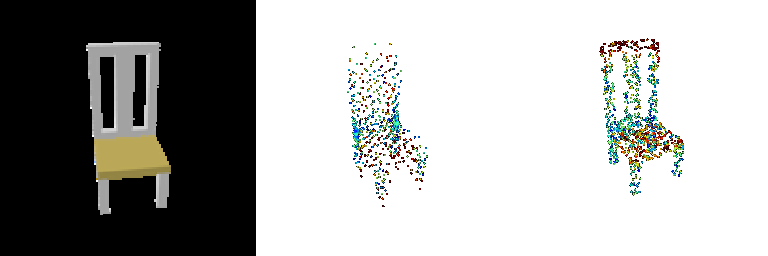
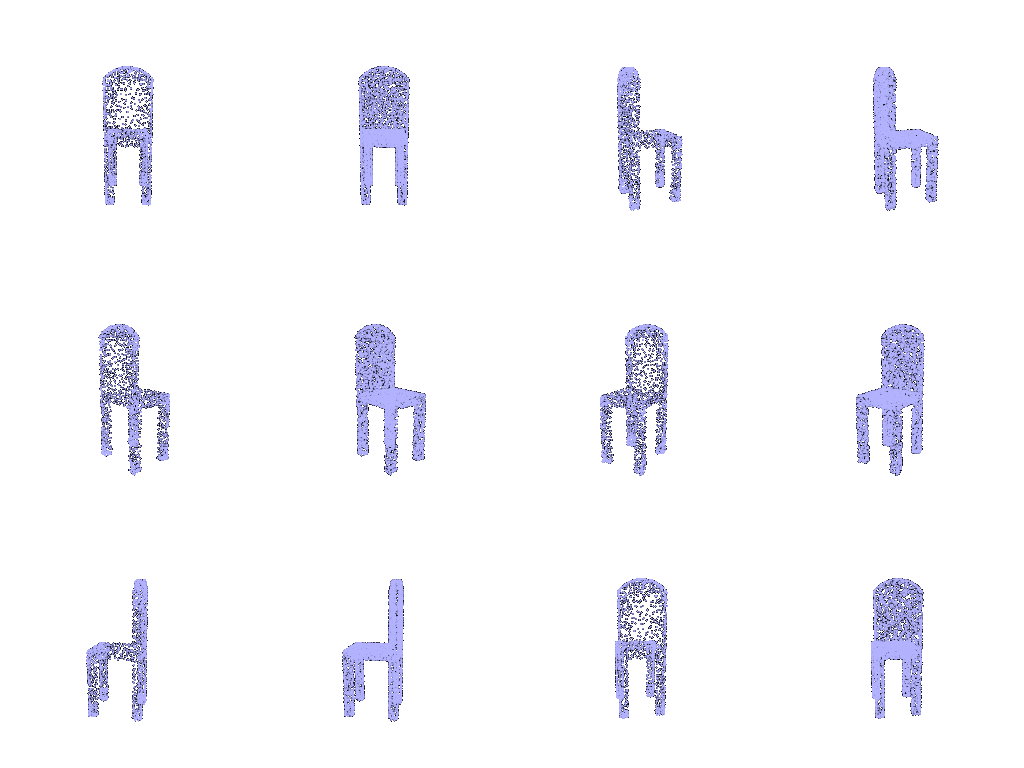
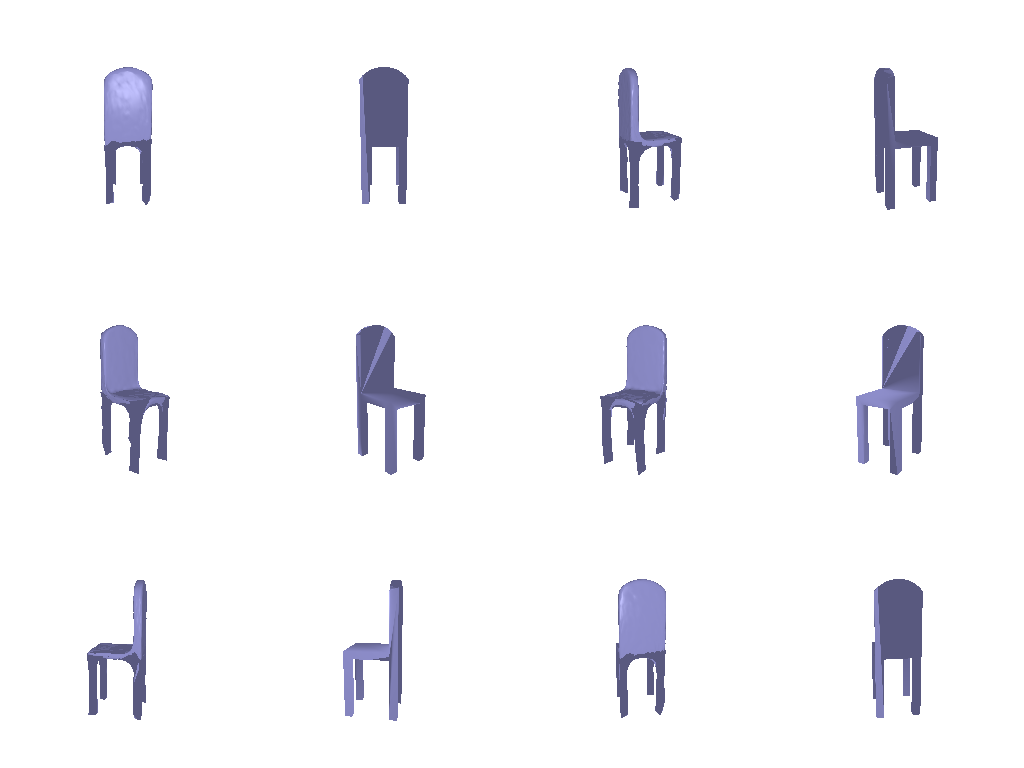
For the point cloud model I colored every point by its error from blue at 0 to red at 0.05 as the F1 threshold. The middle image shows prediction colored by distance to the nearest ground truth point, so red points are the ones making precision worse. The right image shows ground truth colored by distance to the nearest predicted point, so the red areas are the ones the model missed and affected recall.
On the first and third chairs the top of the backrest is the reddest part on the ground truth side while the seat is bluer and greener, so the model gets the seat right but misses the ends of the chair. The round chair is seen from the side so the model can't see the seat and falls back to a generic chair shape, which I think is why most of its ground truth is red; the same chair scores up to 0.87 from the front but can go down to 0.47 from the side. On the prediction side the red points are scattered off the surface. The predicted points also clump, and 48% of them have another predicted point within 0.005, and the clumps mostly sit around the seat and are blue. I think chamfer loss lets a lot of points collapse onto the middle of the chair, which is accurate but wastes points that could cover the backrest. I think this is also why more points helped in 2.4.
I trained the point cloud model on chairs, cars and planes with the same settings as 2.2
Chair test set, trained on one class vs three classes:


Trained on chairs only, F1@0.05 on chairs: 0.80
Trained on three classes, F1@0.05 on chairs: 0.79
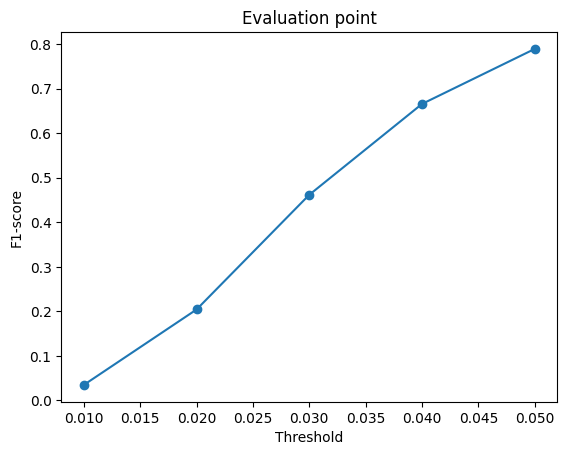
Planes and cars from the three class model:
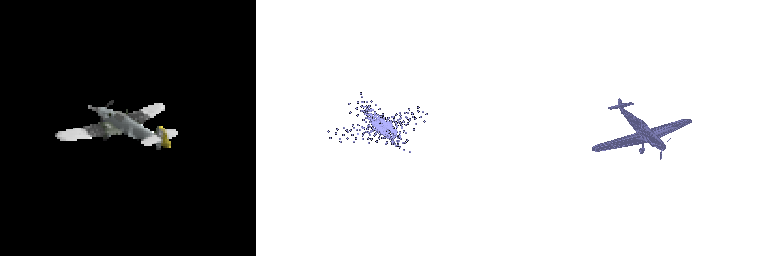
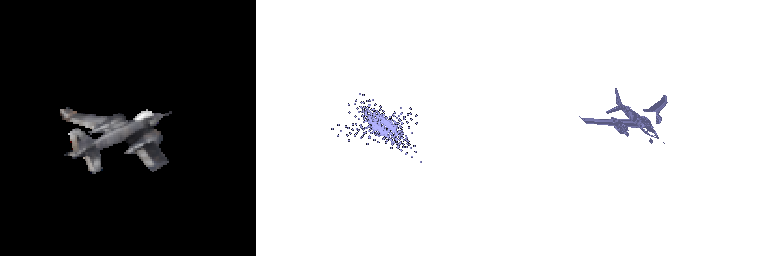
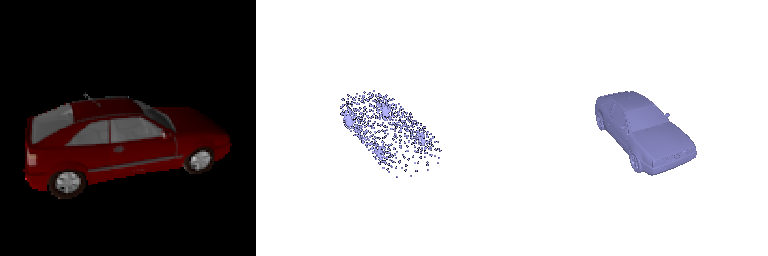
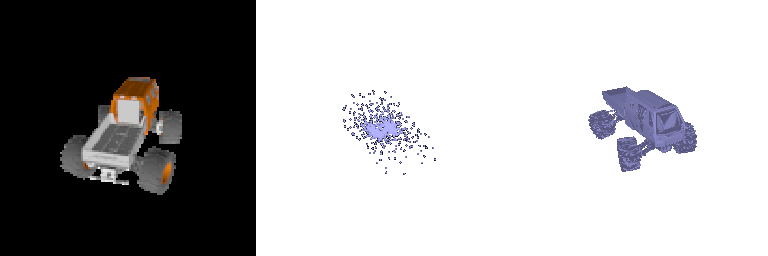
On three class test set F1@0.05 is 0.87 (planes 0.96, cars 0.93, chairs 0.79)
The chair F1 is about the same although chairs are only 47% of the three class training set so the model saw about half as many chair images. The chair predictions from both models also look very similar so the chair results seem to be limited by the point decoder and not by how much chair data there is. Planes come out as a blob along the body with barely any wings but still score 0.96 probably since a plane is thin and compact so most points land within 0.05. Cars also came out somewhat blob like, though the normal car looks more distributed, with mostly the right footprint. Overall the outputs mostly change by class and there isn't much variety within a class though the car outputs seem to be more diverse like if it's a tractor or normal car.