
16-825 Learning for 3D Vision | Andrew ID: lnayak


The models are trained on RGB images with batch size 16. The voxel model uses 30,000 steps, the point model 15,000, and the mesh model 3,000. Evaluation uses 678 held-out chairs, with one fixed image per chair. Precomputed image features are not used. The voxel loss gives occupied cells 2 times the weight of empty cells. F1 uses 2,048 target surface samples and native mesh coordinates. Mesh and voxel predictions use 2,048 samples; point decoders use their output points. This differs from the starter evaluator's default sampling and voxel alignment.
F1@0.05: 52.69%.
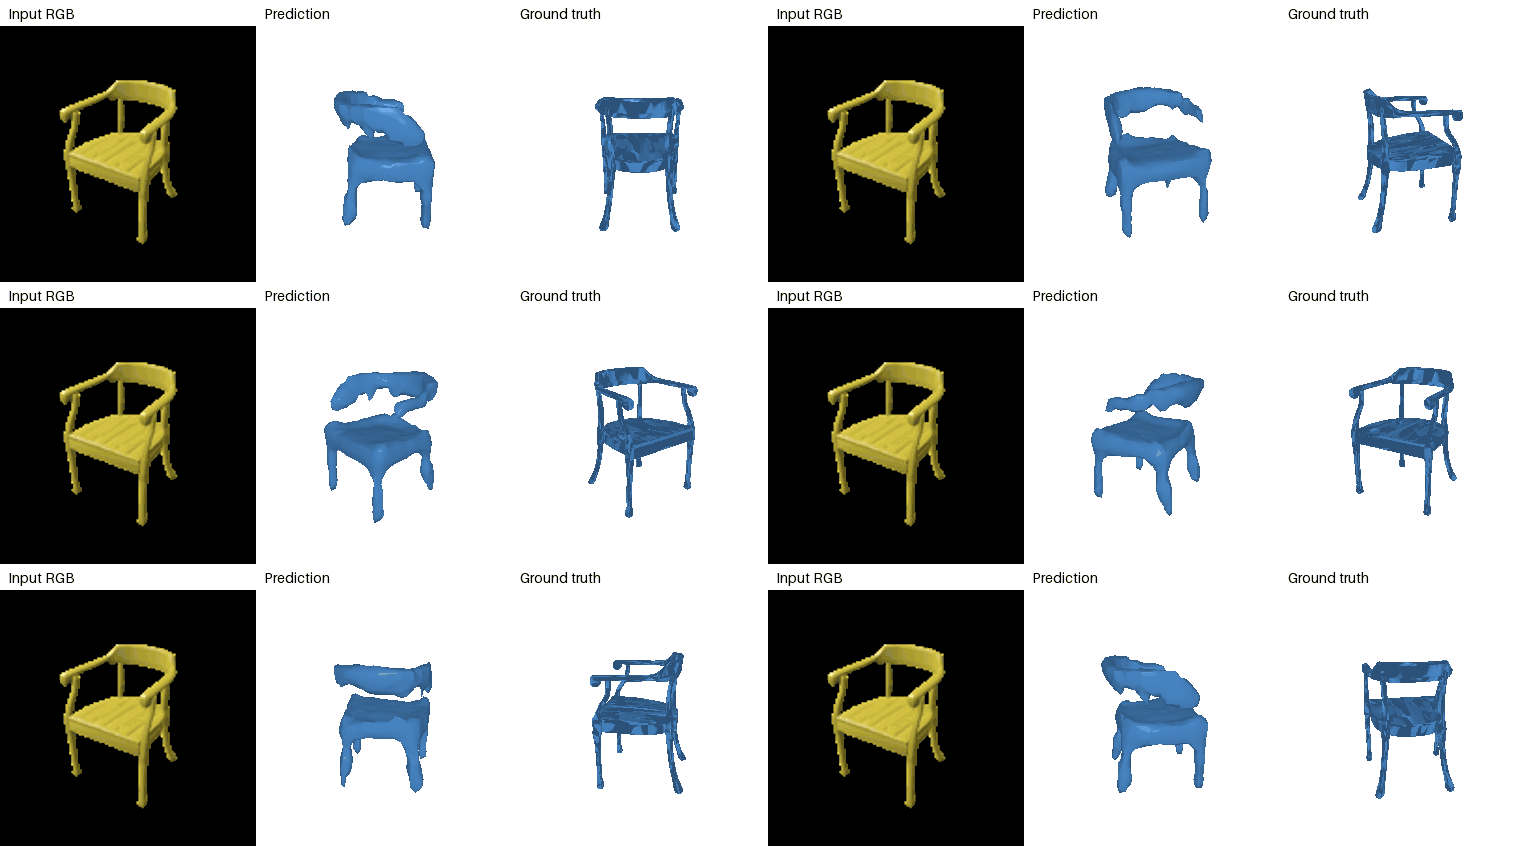
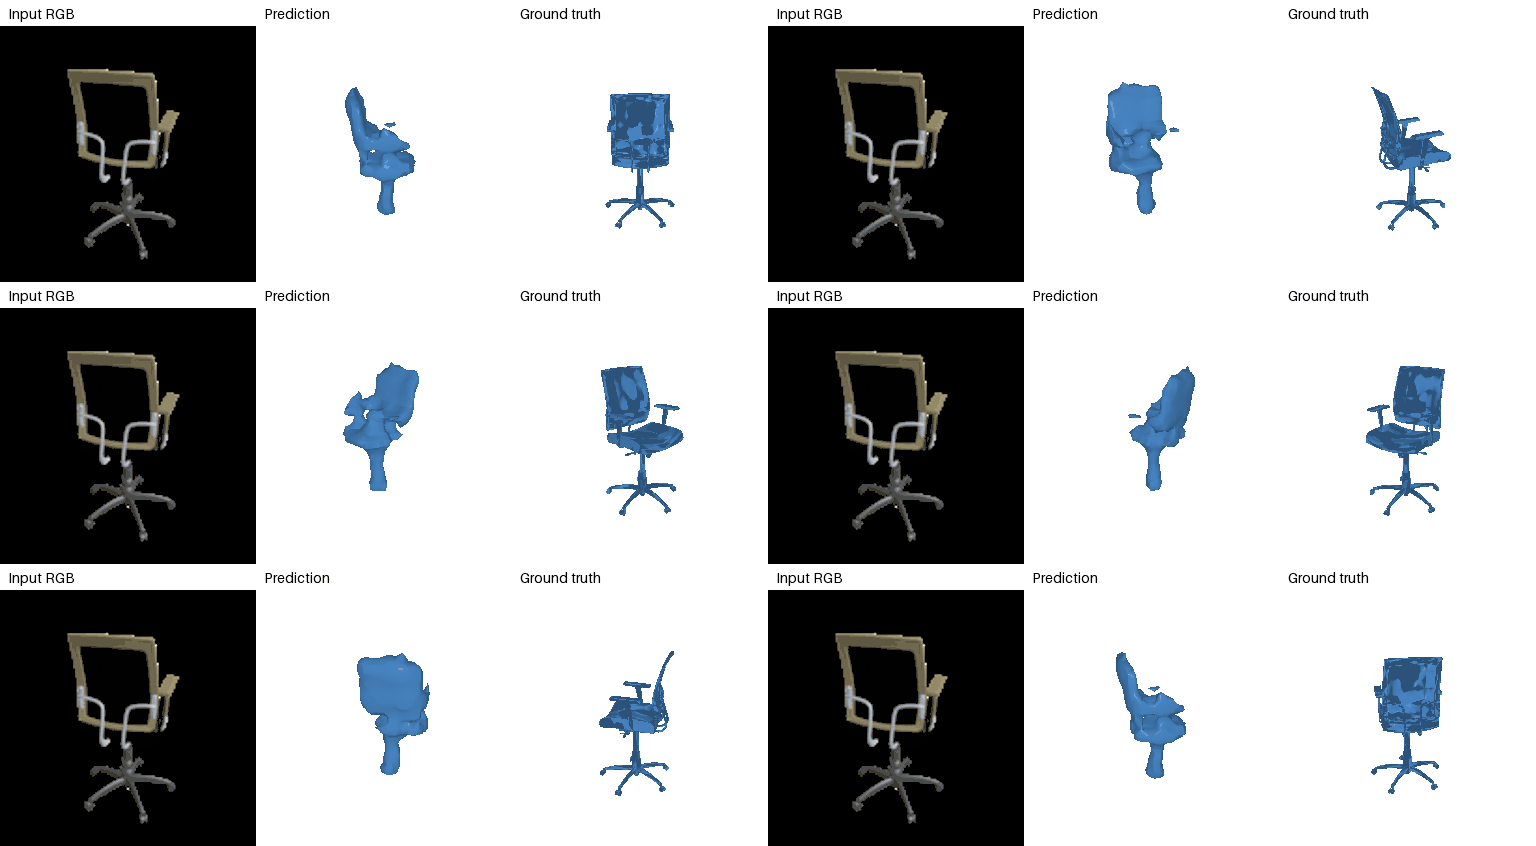


F1@0.05: 84.55%.
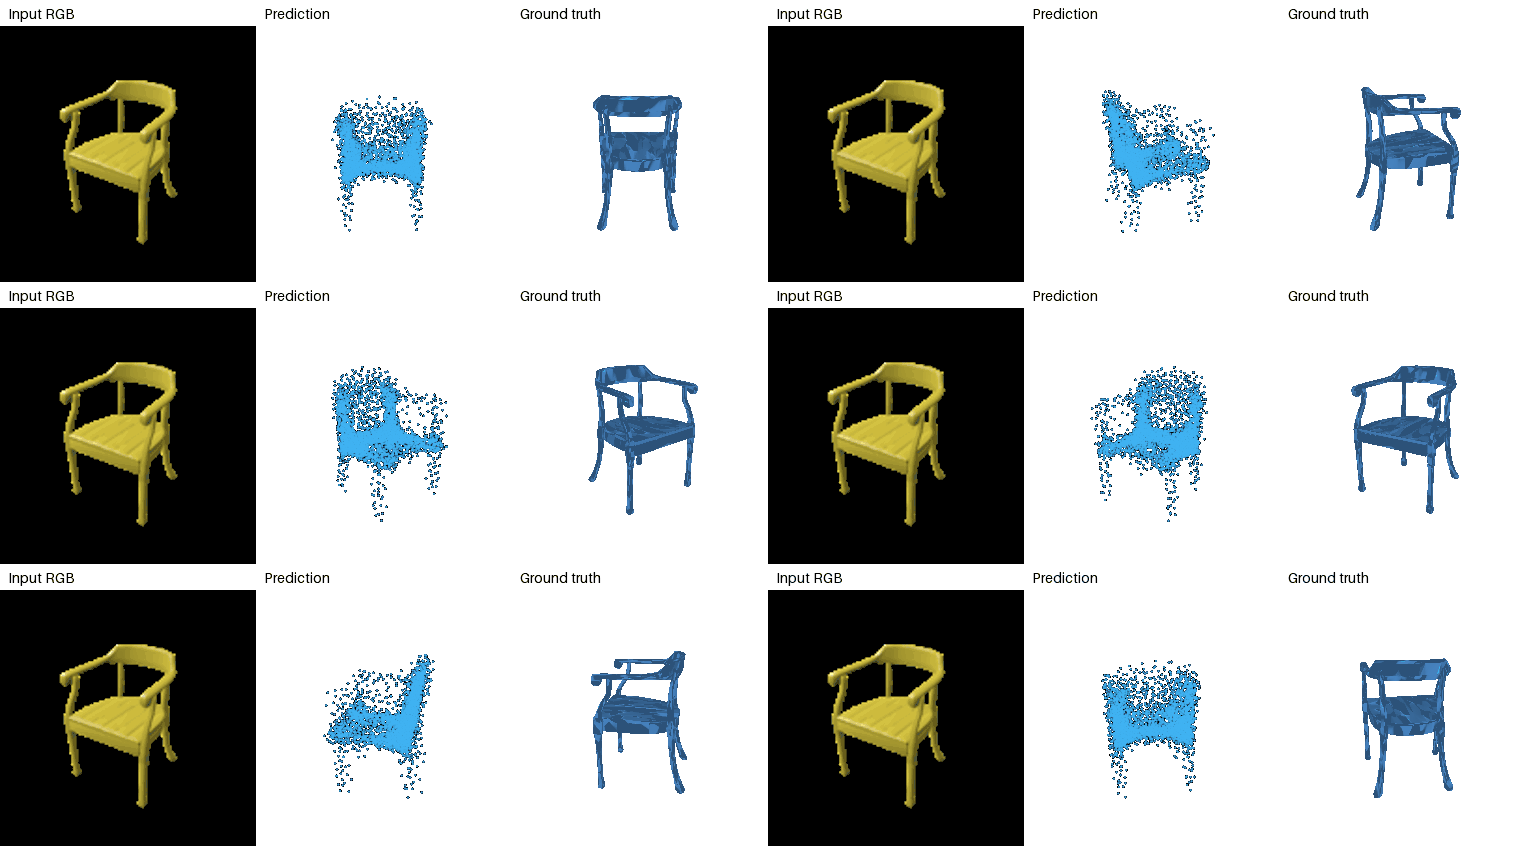

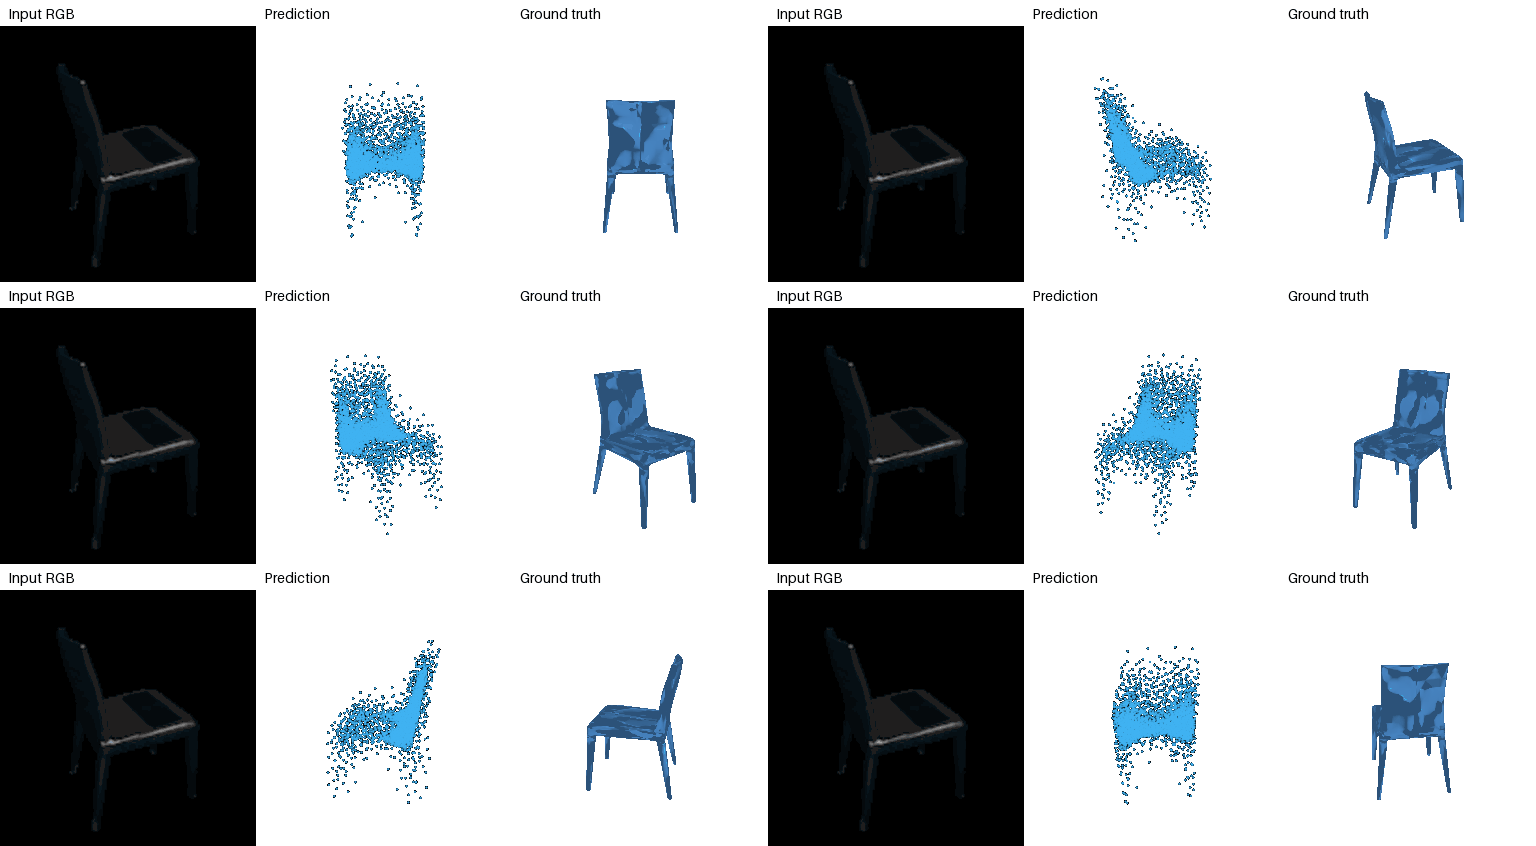

The decoder predicts 4,096 points. Its loss is Chamfer distance plus 0.1 times a repulsion term. For each point, the term penalizes its four nearest neighbors when they are closer than 0.01. This spreads points that would otherwise collect in tight clusters. The chair surfaces are easier to see, but thin supports and some chair backs are still inaccurate. Section 2.4 compares the same model with and without this term.
F1@0.05: 78.67%.

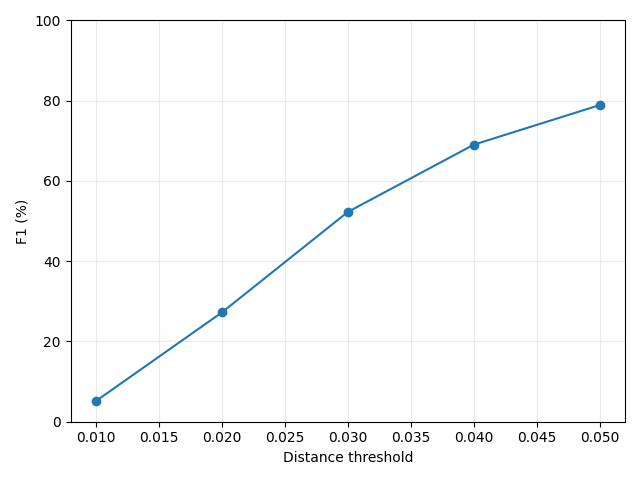
| Representation | F1@0.01 | F1@0.02 | F1@0.03 | F1@0.04 | F1@0.05 | P@0.05 | R@0.05 |
|---|---|---|---|---|---|---|---|
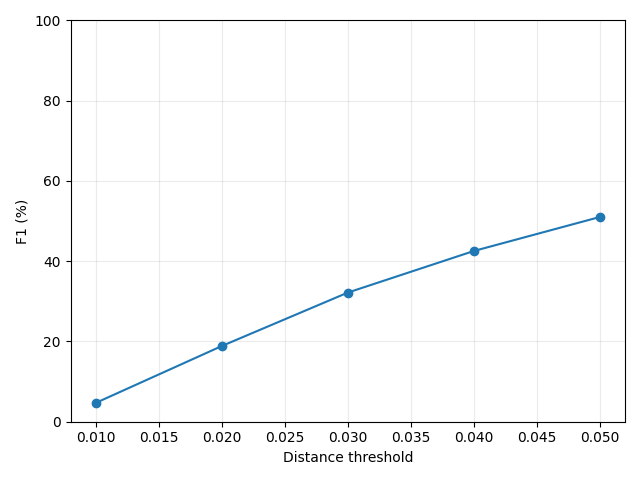
| Voxel grid | 4.73 | 19.25 | 33.10 | 43.99 | 52.69 | 50.10 | 57.32 |
| Point cloud | 12.24 | 40.13 | 63.04 | 76.59 | 84.55 | 81.24 | 89.76 |
| Mesh | 8.85 | 34.46 | 55.75 | 69.65 | 78.67 | 73.55 | 85.65 |
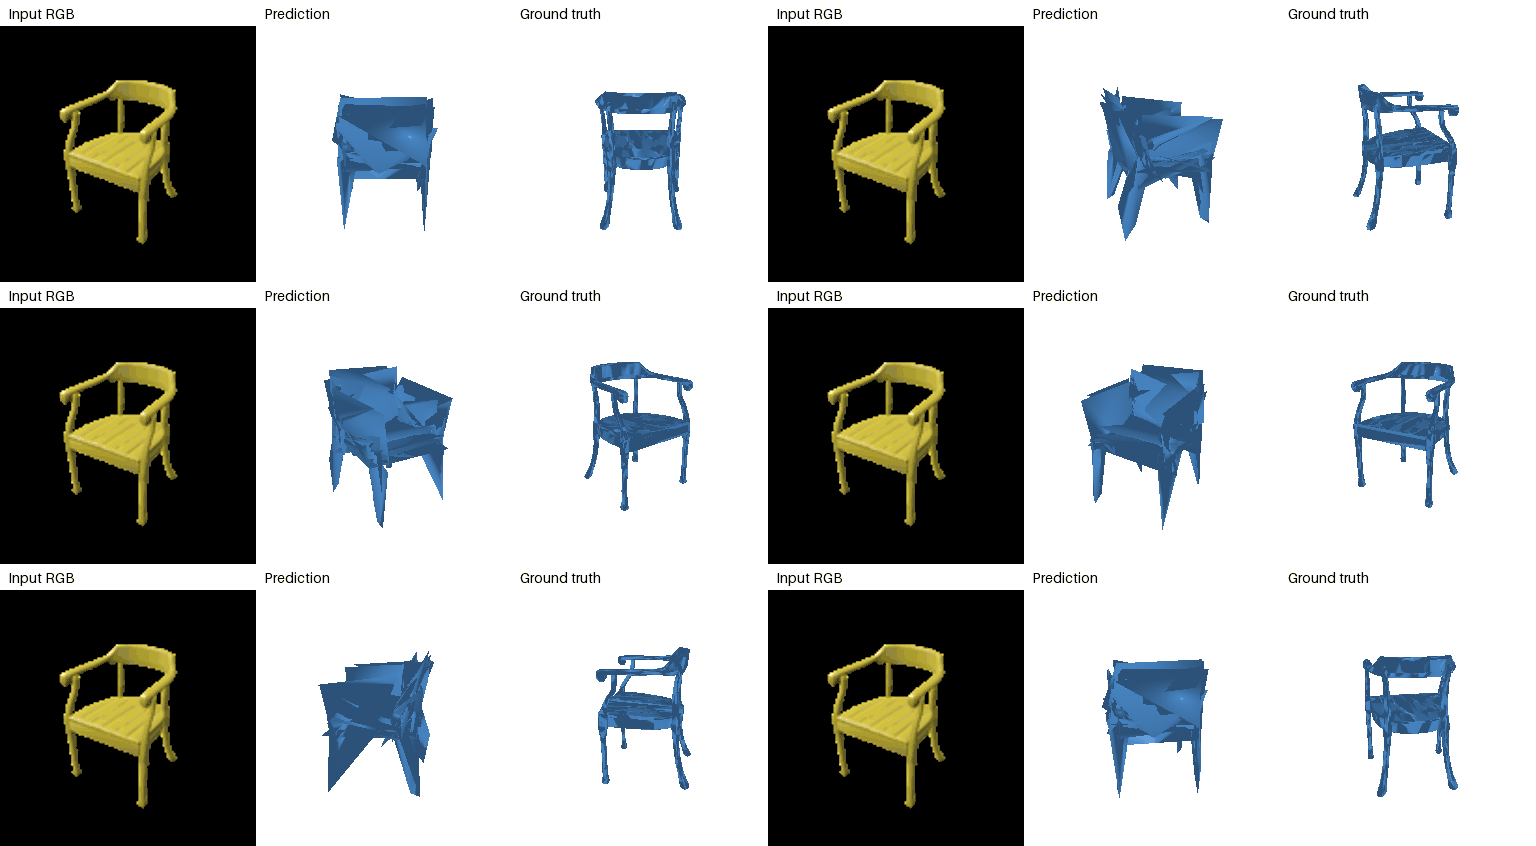
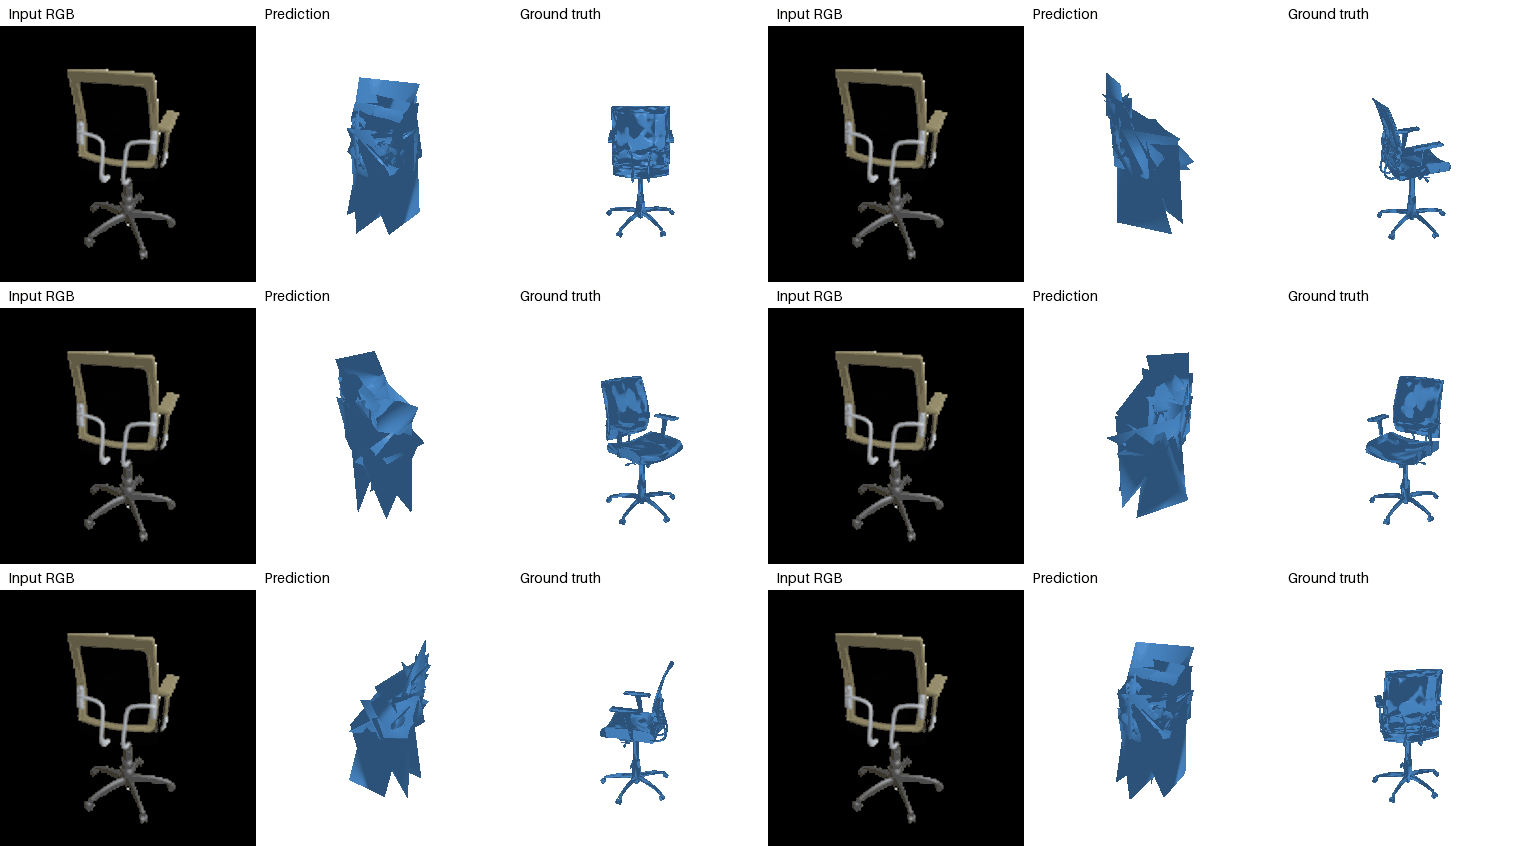
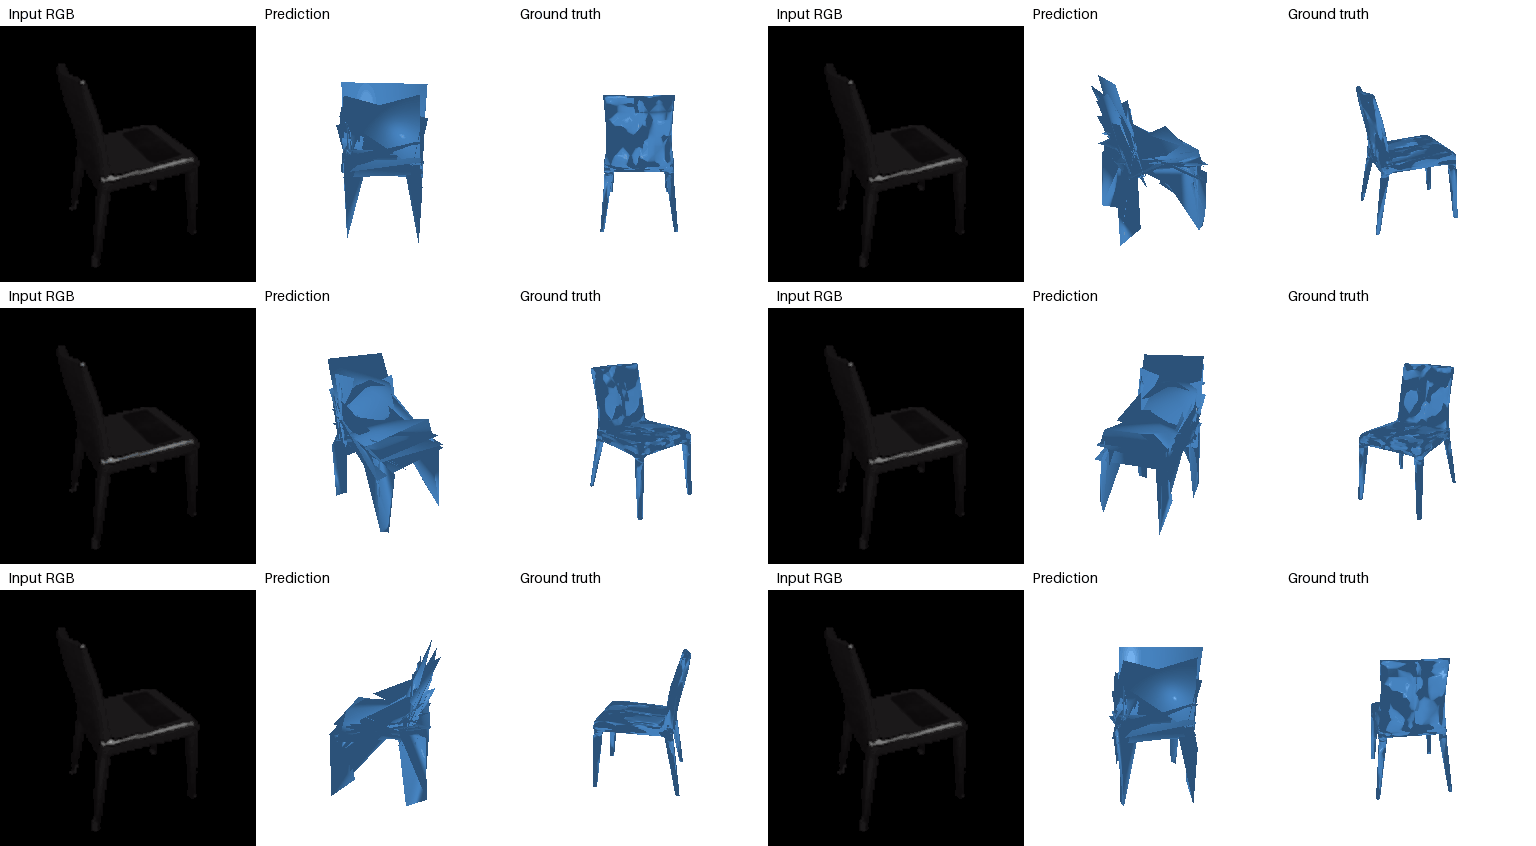
The point cloud has the highest F1 score. Point clouds can place points on separate chair parts without connecting them. The 32 by 32 by 32 voxel grid misses thin parts. The mesh keeps the connections of its starting sphere, so holes and separate parts are harder to recover. Its predictions have folds and overlapping faces, which surface F1 does not measure. Training lengths also differ, so this is not a comparison of representation alone.
This comparison uses a separate 1,000-point model trained for 3,000 steps, matching the 256-point run. It is not the longer-trained model shown in section 2.2.
| Predicted points | Precision@0.05 (%) | Recall@0.05 (%) | F1@0.05 (%) |
|---|---|---|---|
| 256 | 78.39 | 61.83 | 68.44 |
| 1000 | 82.14 | 80.48 | 80.28 |
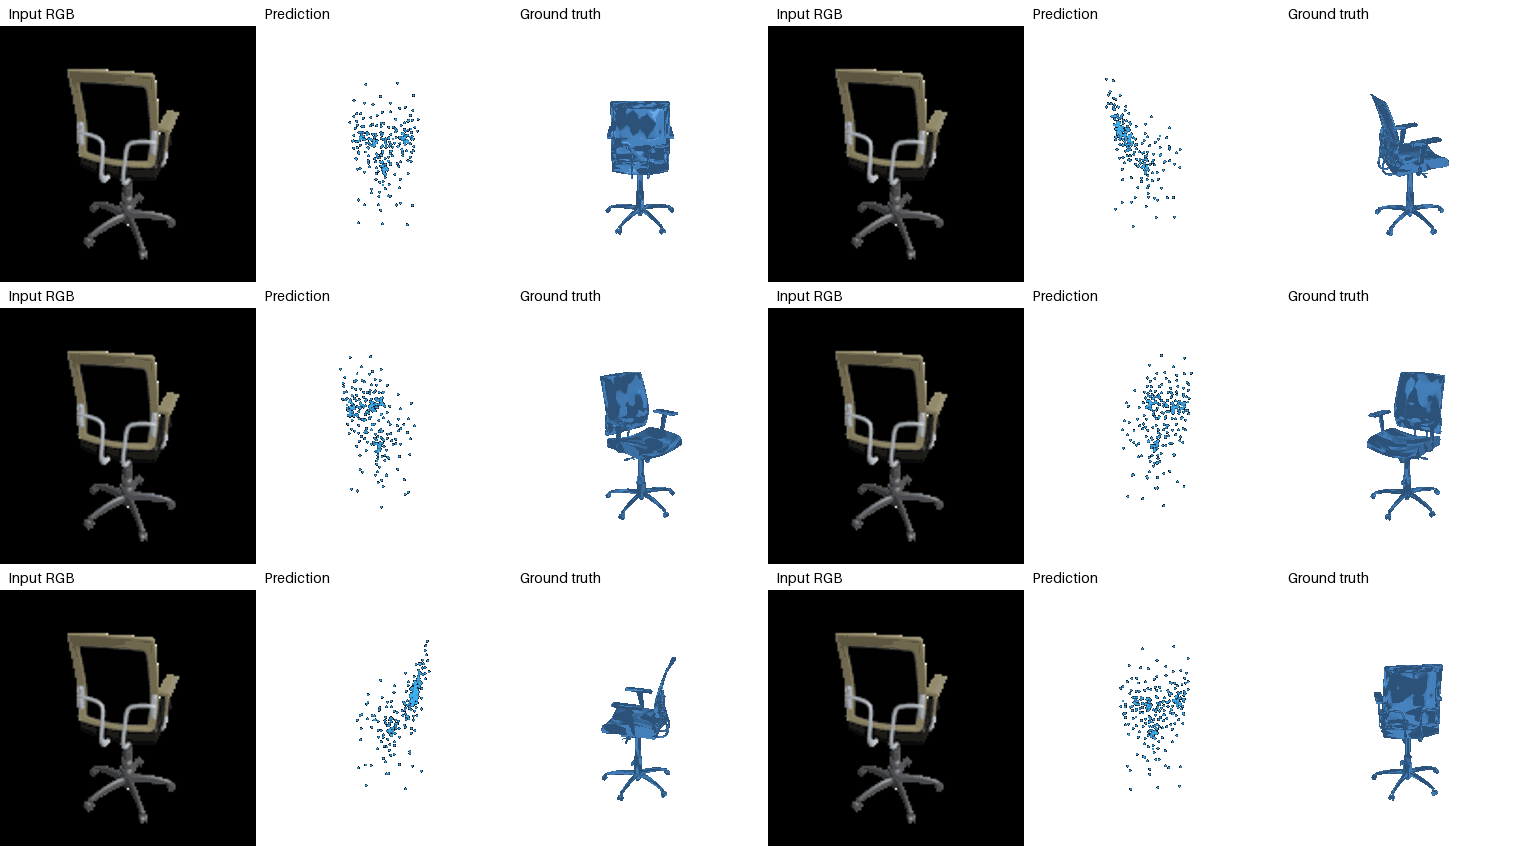
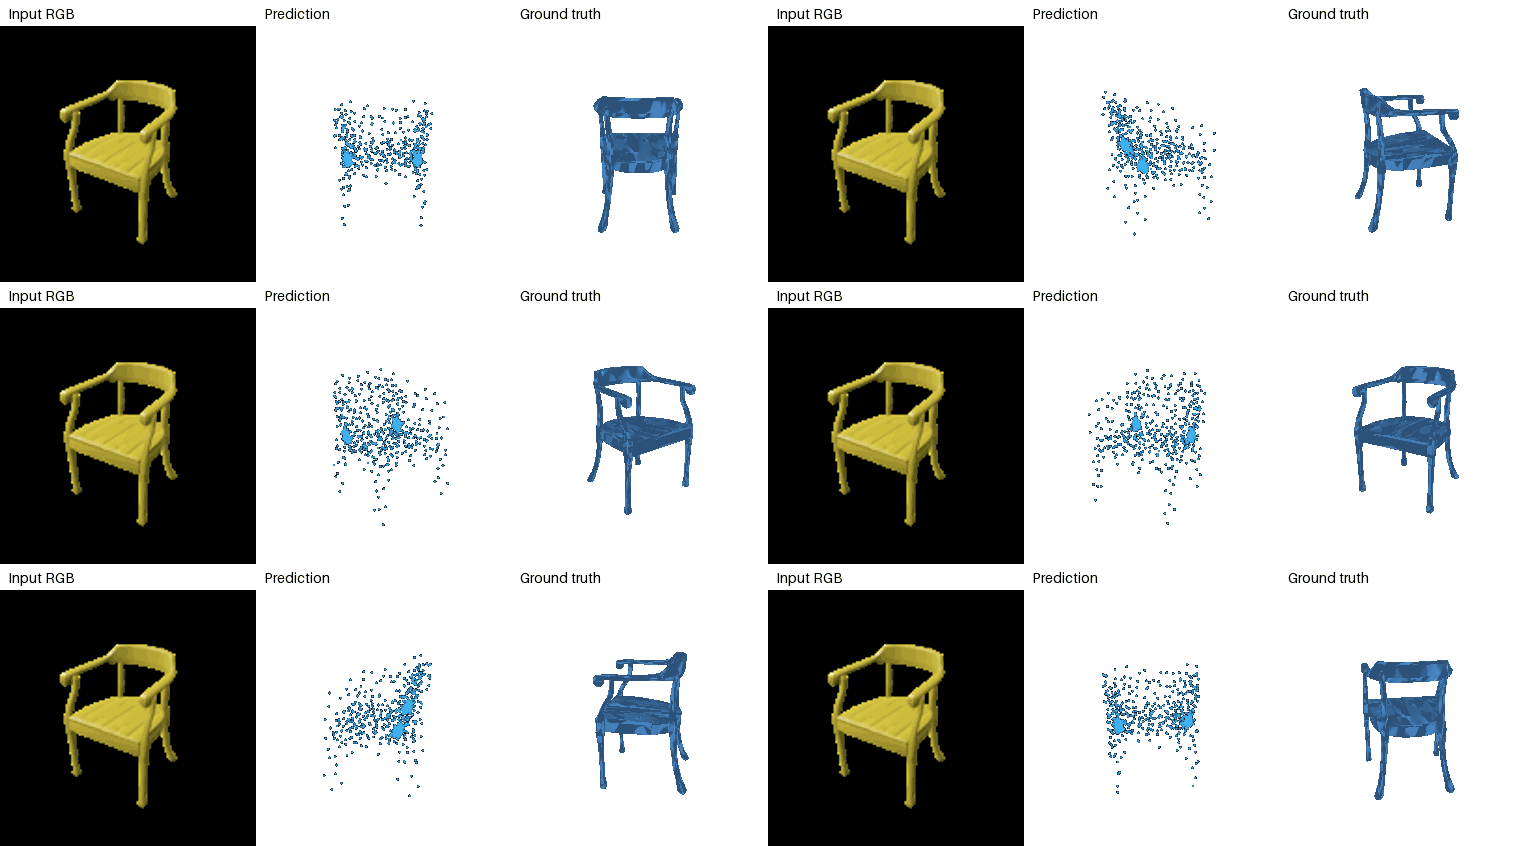
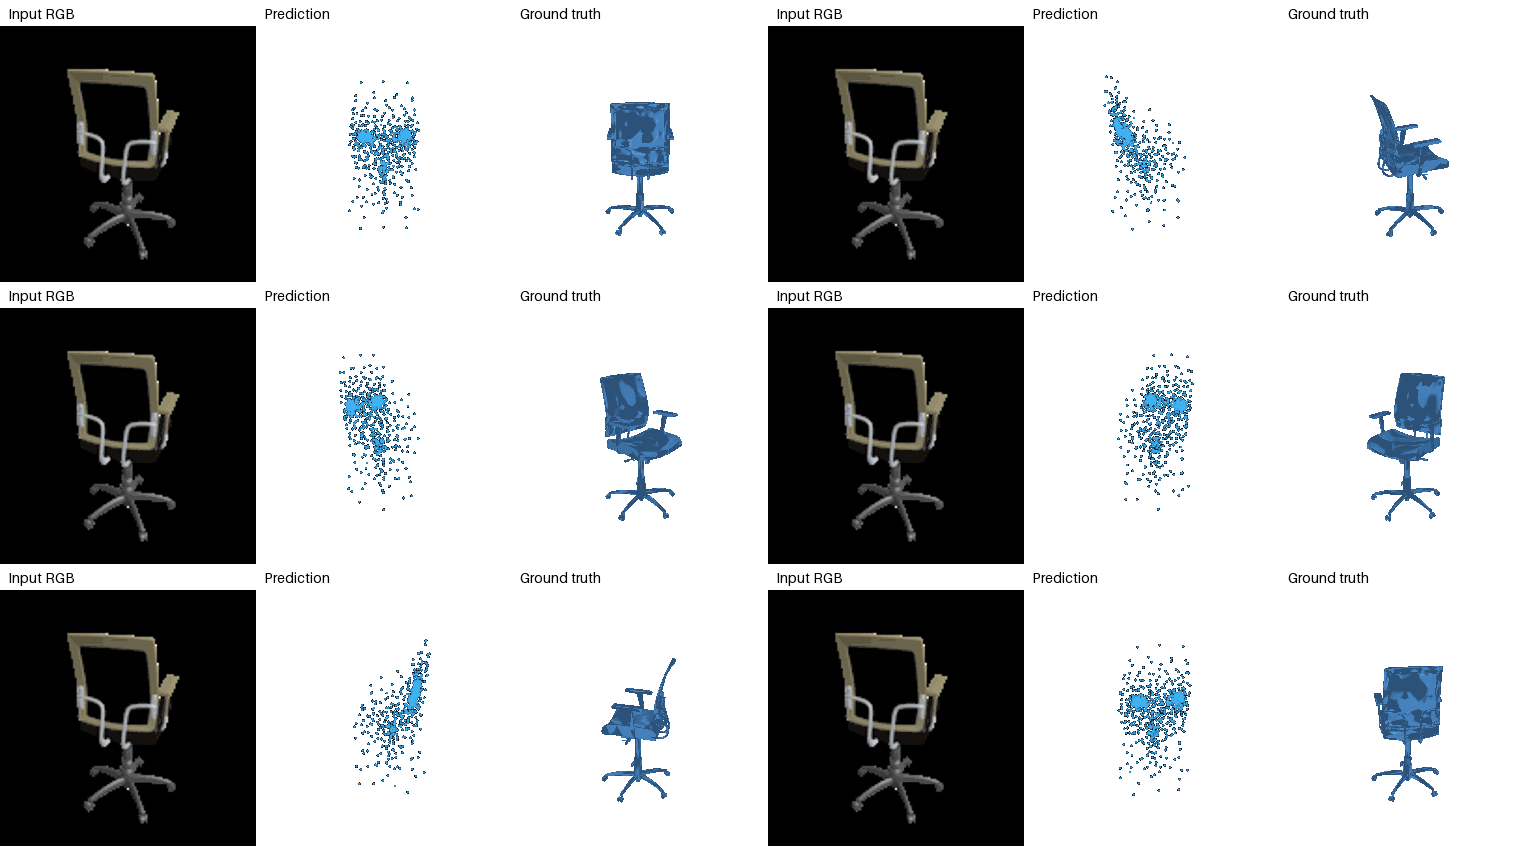
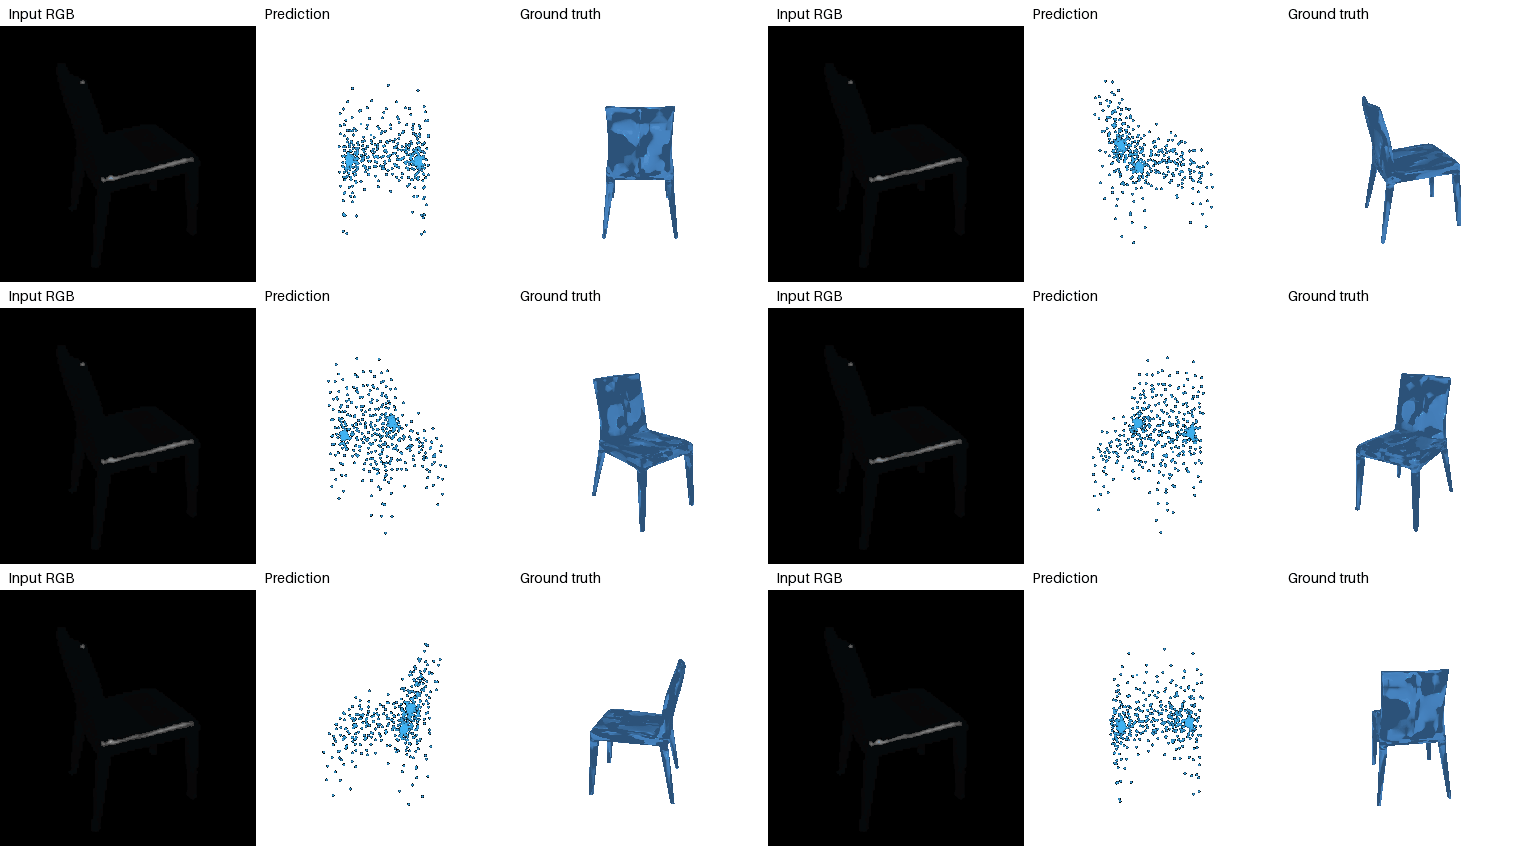
Changing the output from 256 to 1,000 points increases F1 by 11.84 percentage points. Precision changes by +3.75 points and recall by +18.65 points. The split, seed, batch size, learning rate and training steps are unchanged. More points give denser coverage of the surface. The larger output also needs a larger final layer and uses more target points during training.
256 predicted points:
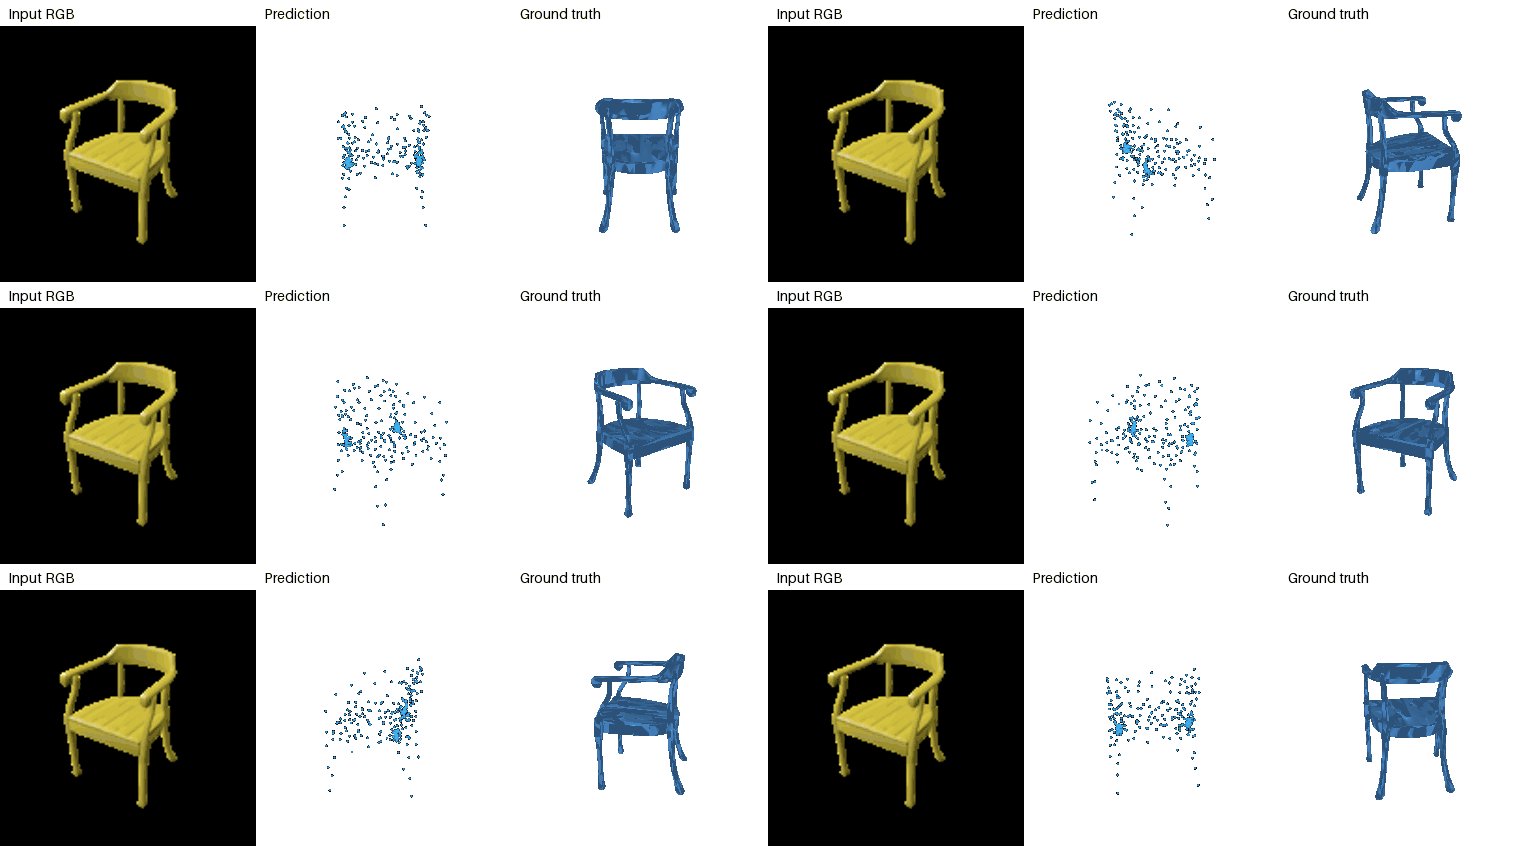

1,000 predicted points, with the same training budget:
As a sampling check, points are also drawn from each ground-truth mesh, separately from the 2,048 evaluation points. Ground-truth samples score 94.57% with 256 points and 99.86% with 1,000 points. Even with the correct shape, denser sampling changes F1. These scores are a reference, not an upper bound.

Both runs predict 4,096 points and use the same decoder, seed, batch size and 15,000 training steps. Only the repulsion weight changes.
| Repulsion weight | F1@0.01 (%) | F1@0.05 (%) |
|---|---|---|
| 0 | 5.78 | 86.08 |
| 0.1 | 12.24 | 84.55 |
Without repulsion, 59.4 to 72.9% of predicted points have four neighbors within 0.002 in the six inputs below. With repulsion, that range is 0.0 to 0.0%. The points cover the surfaces more evenly and the stricter F1 score improves, while F1@0.05 decreases. Repulsion reduces clustering but does not fix every shape error.


Each image is divided into 16 regions. One region at a time is covered with white, then the predicted point cloud is compared with the original prediction using Chamfer distance. Brighter regions change the output more. The white mask is artificial, so this shows sensitivity to covering a region, not an attention map.


The next image blends the encoded features of two test images and decodes each blend. The intermediate point clouds show the transition between the two predictions.

F1@0.05: 51.02%.
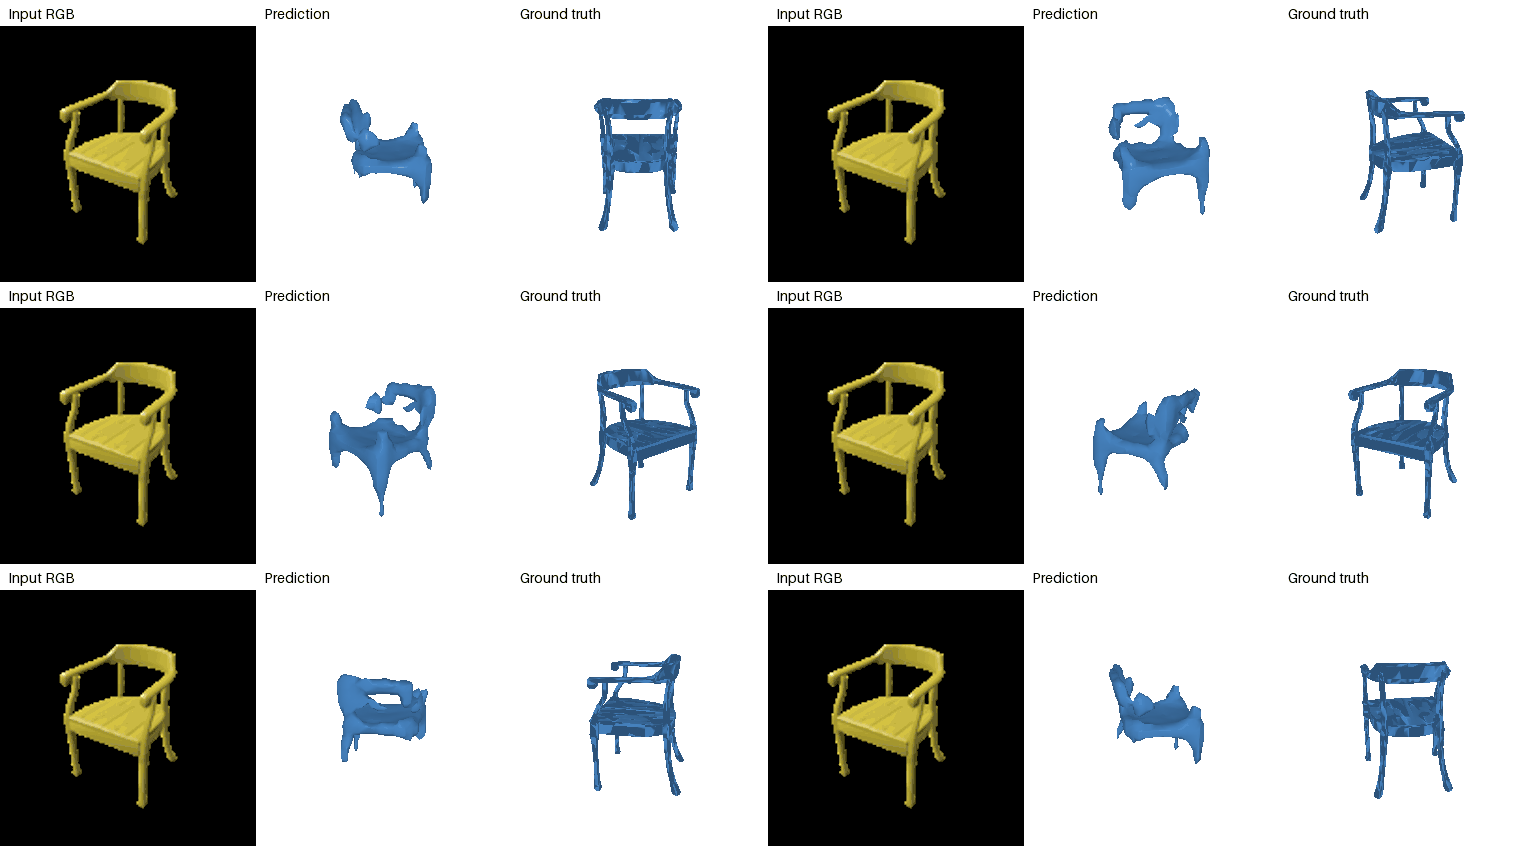
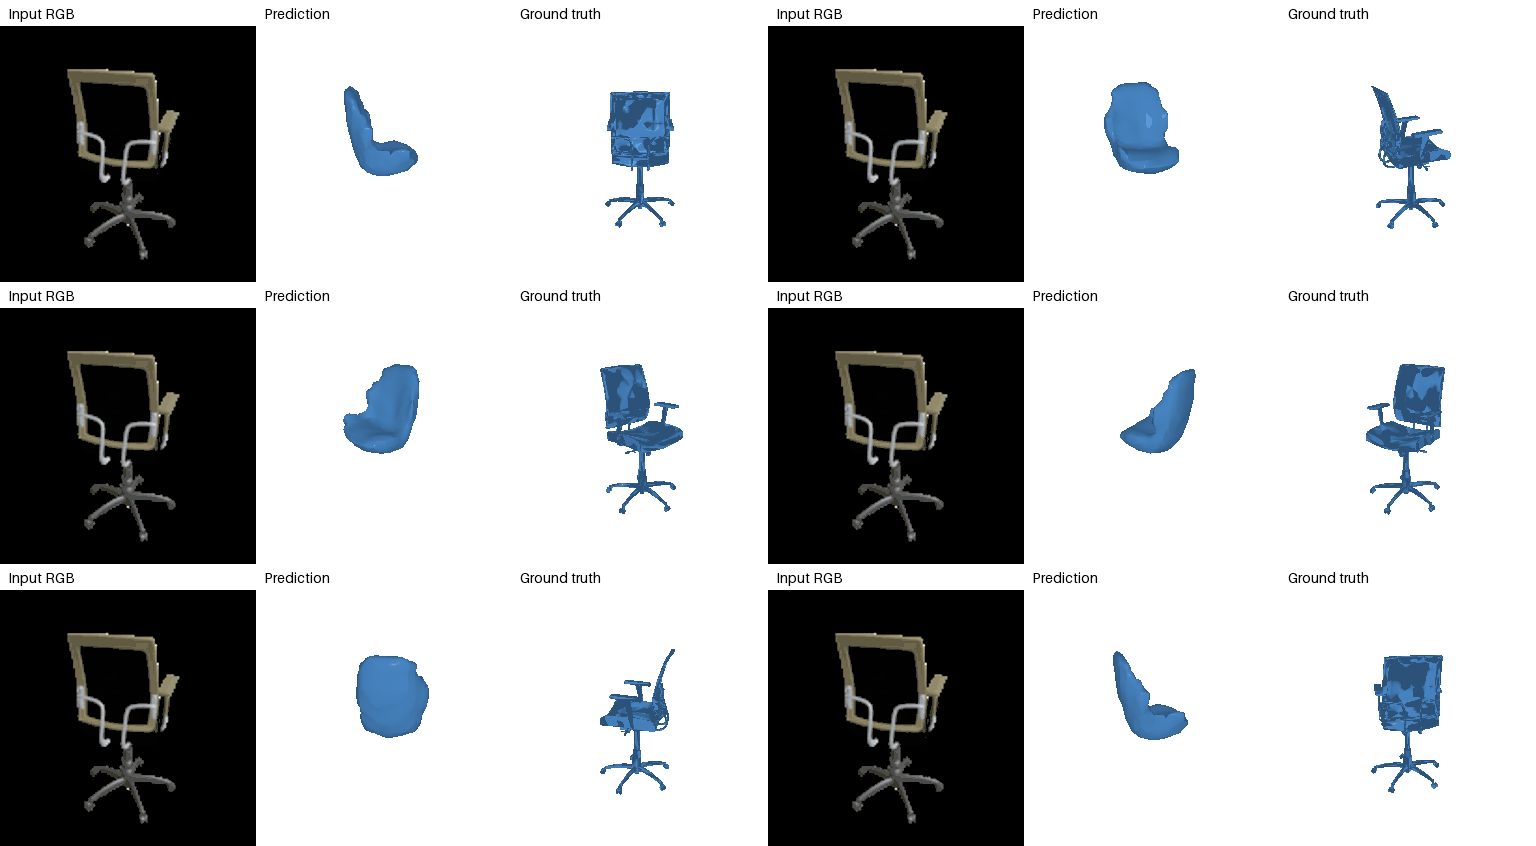
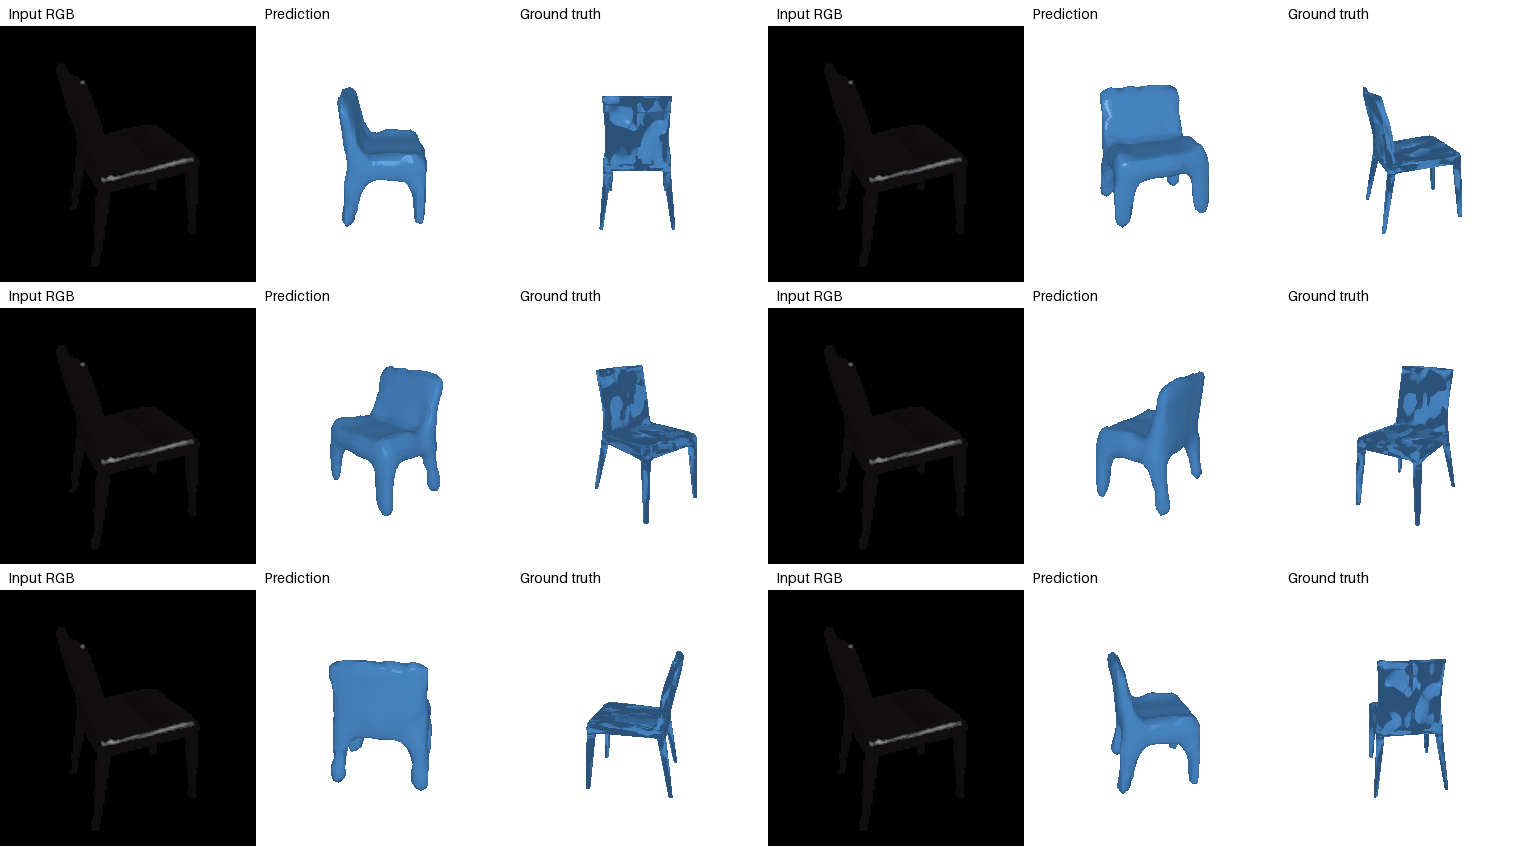
The decoder predicts occupancy from an image feature and a 3D query coordinate. It is trained for 30,000 steps, with occupied cells weighted 2 times as much as empty cells. It is queried on a 32 by 32 by 32 grid in [-1, 1] cubed. Sine and cosine features at four frequencies help the coordinate network represent small details. Its F1@0.05 is -1.67 percentage points relative to the voxel decoder. Unlike a convolutional voxel decoder, the same coordinate function is used at every location. The examples still simplify some thin chair parts; coordinate features alone do not remove reconstruction errors. The displayed surface is still extracted from a 32-cubed grid, so the visualization retains that resolution limit.
F1@0.05: 78.92%.
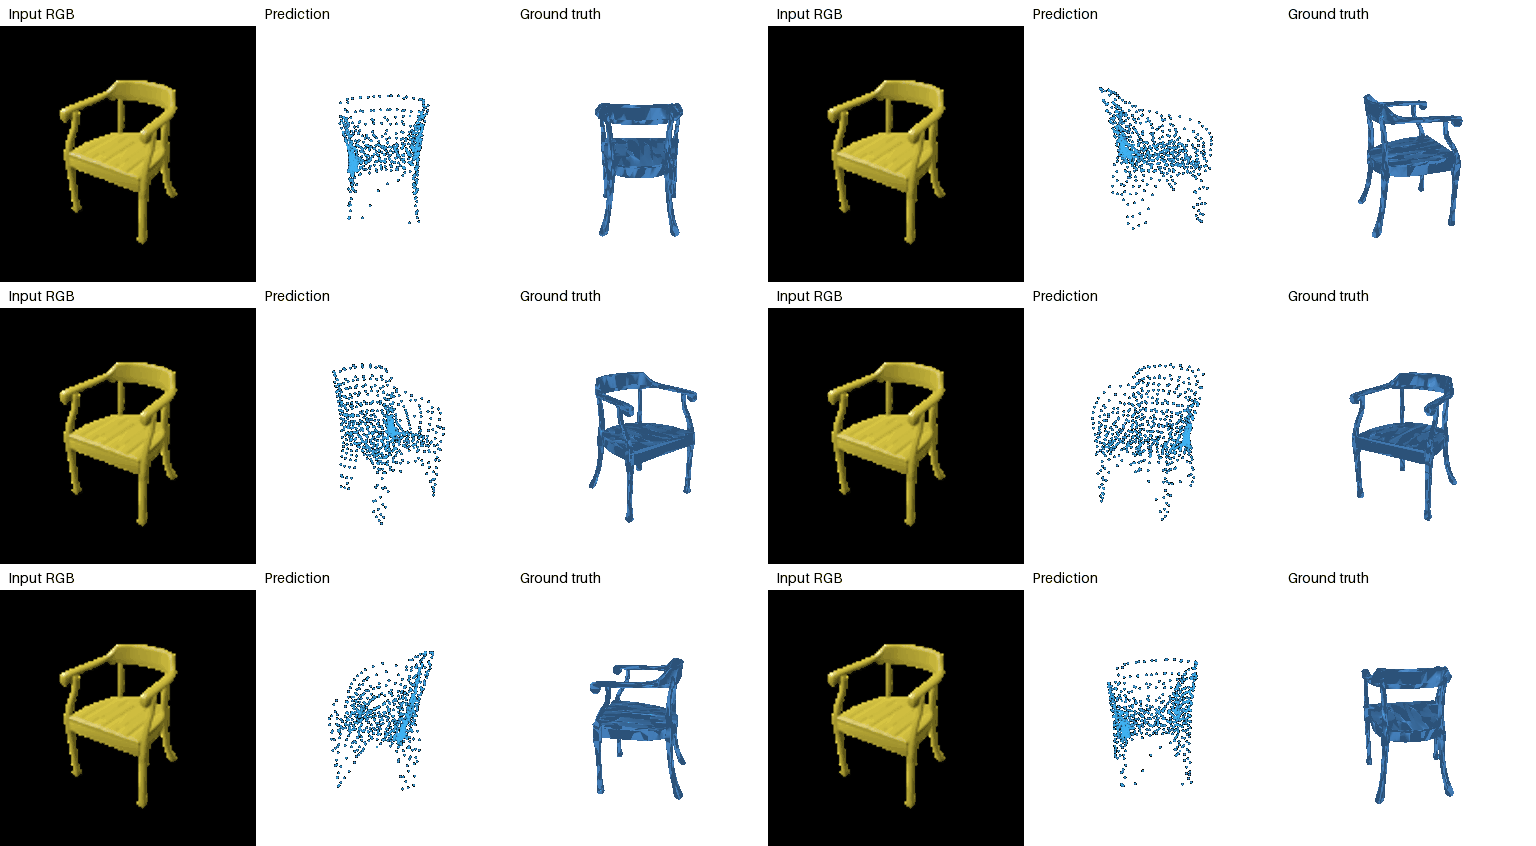
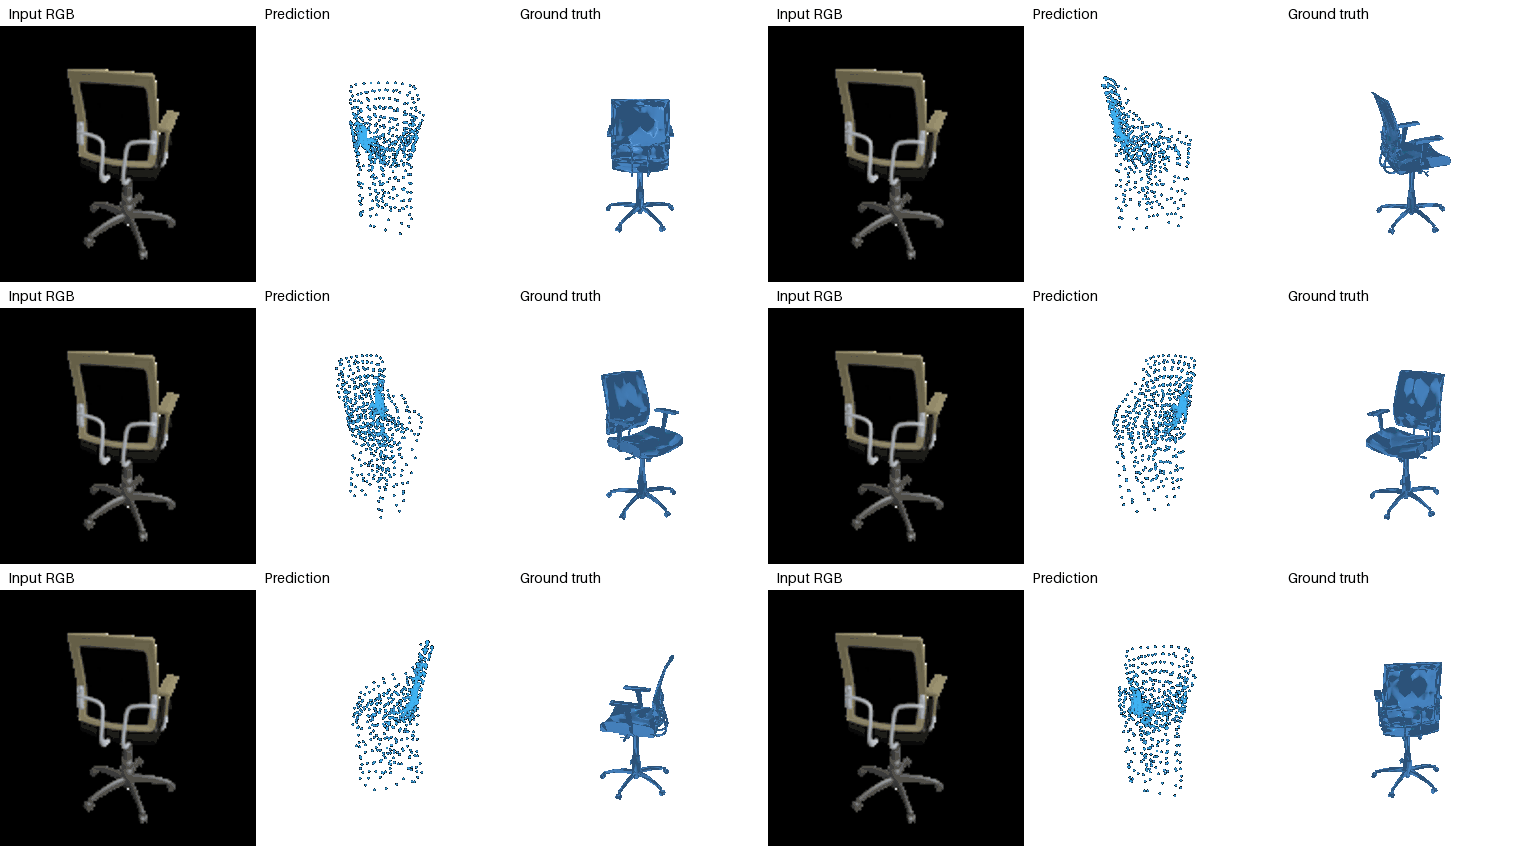
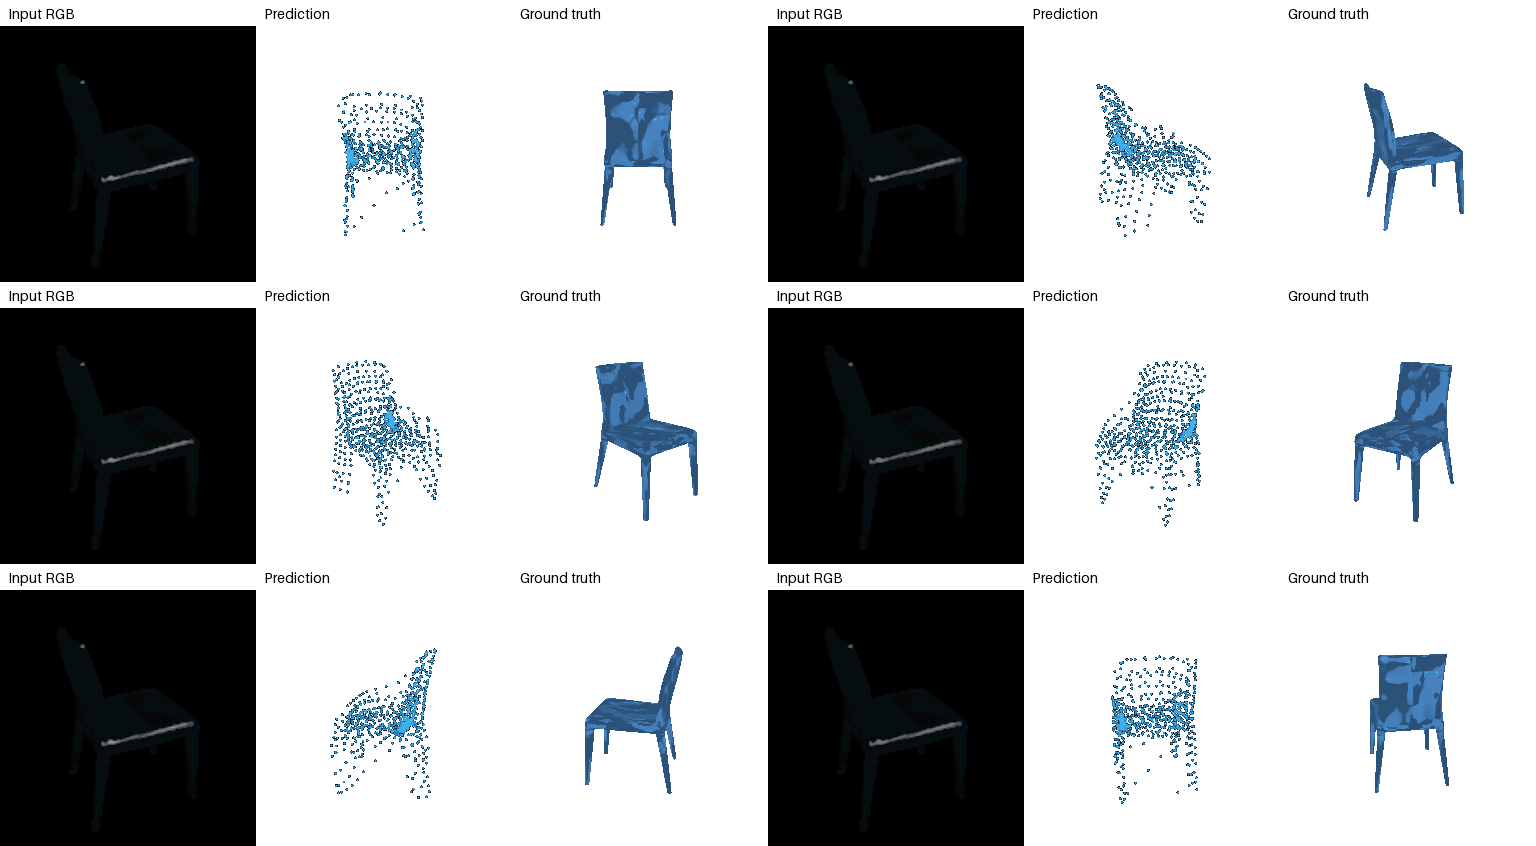
The decoder maps sampled 2D coordinates to 3D points, conditioned on the image feature. It is trained for 15,000 steps. Four learned patch identities let it use separate surface patches. Its F1@0.05 is -1.92 percentage points relative to a 1,000-point direct decoder (80.84%). Both use 15,000 steps and Chamfer loss only. This comparison does not use the 4,096-point model from section 2.2. The 2D coordinates encourage a surface parameterization, but the patches can still overlap and do not guarantee a closed mesh.
The point-cloud model is trained on chairs, cars and planes using split_3c.json. F1@0.05 over all 1451 test objects is 87.14%.
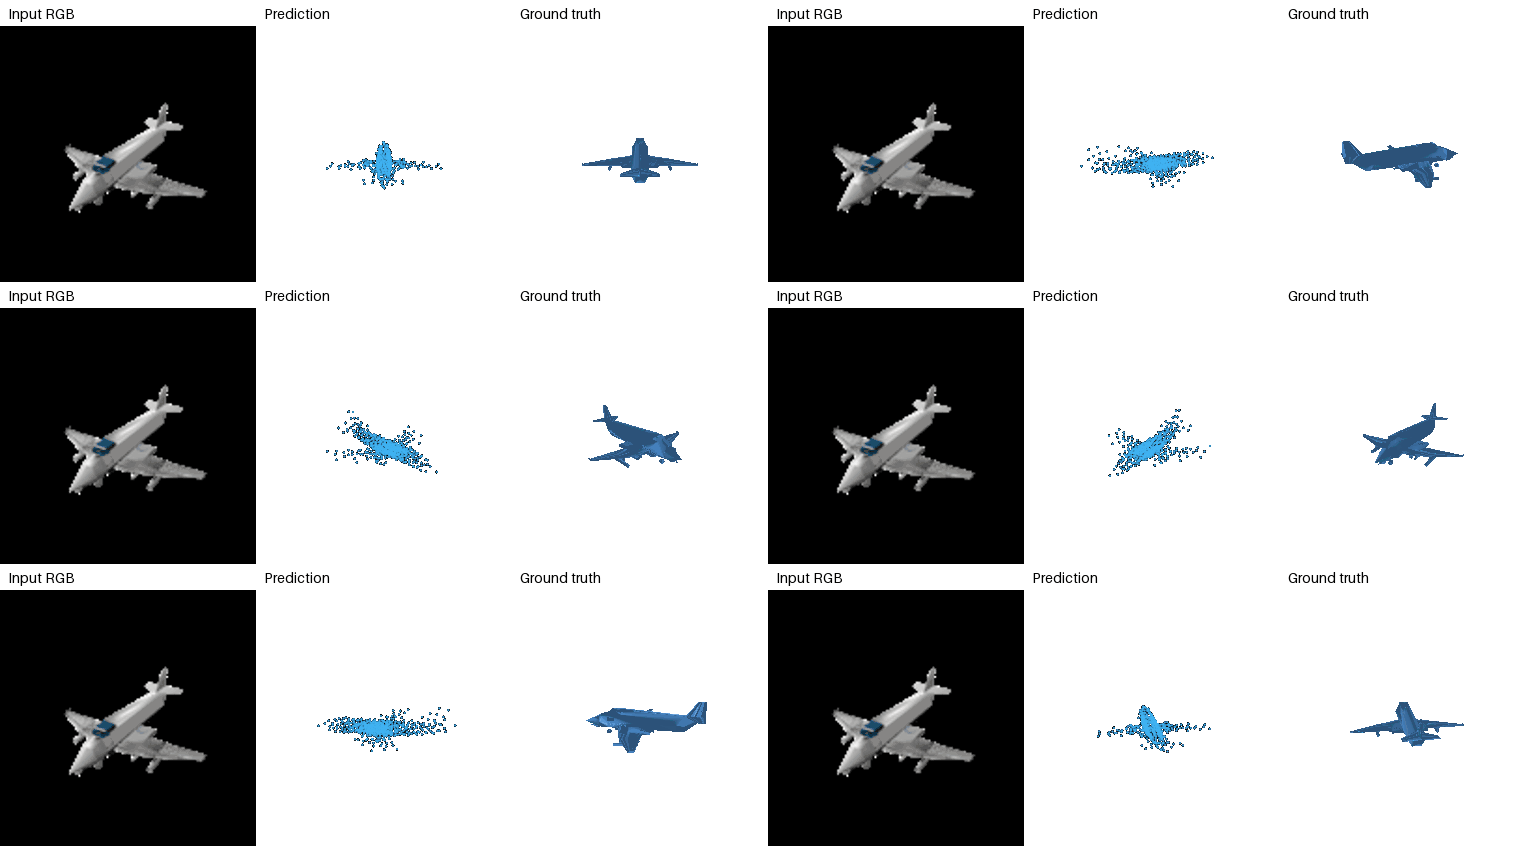


| Test class | Objects | F1@0.05 (%) |
|---|---|---|
| Plane | 405 | 95.64 |
| Car | 368 | 93.55 |
| Chair | 678 | 78.58 |
| Training data | Evaluation data | F1@0.05 (%) |
|---|---|---|
| Chairs only | The same 678 test chairs | 80.28 |
| Chairs, cars and planes | The same 678 test chairs | 78.58 |
On the same chair test set, three-class training changes F1 by -1.70 percentage points. Both models use the same architecture and batch size, with 3,000 training steps. The chair-only score is from the shorter run used in section 2.4. The three-class model learns a wider range of shapes, but sees fewer chair examples within the same training budget. This comparison therefore measures shared training at a fixed step budget, not performance after equal numbers of chair updates.


