Assignment 2 - Fall 2026
Karthik Srinivasan (ksriniv2)
I did not use --load_feat, all models train on raw images.
Compute: everything on my laptop (RTX 3060 Laptop GPU, 6 GB), except 3.3 which was trained on an RTX 5090.
BCE loss on the voxel grid. Left: optimized, right: ground truth.
Chamfer loss. Left: optimized, right: ground truth.
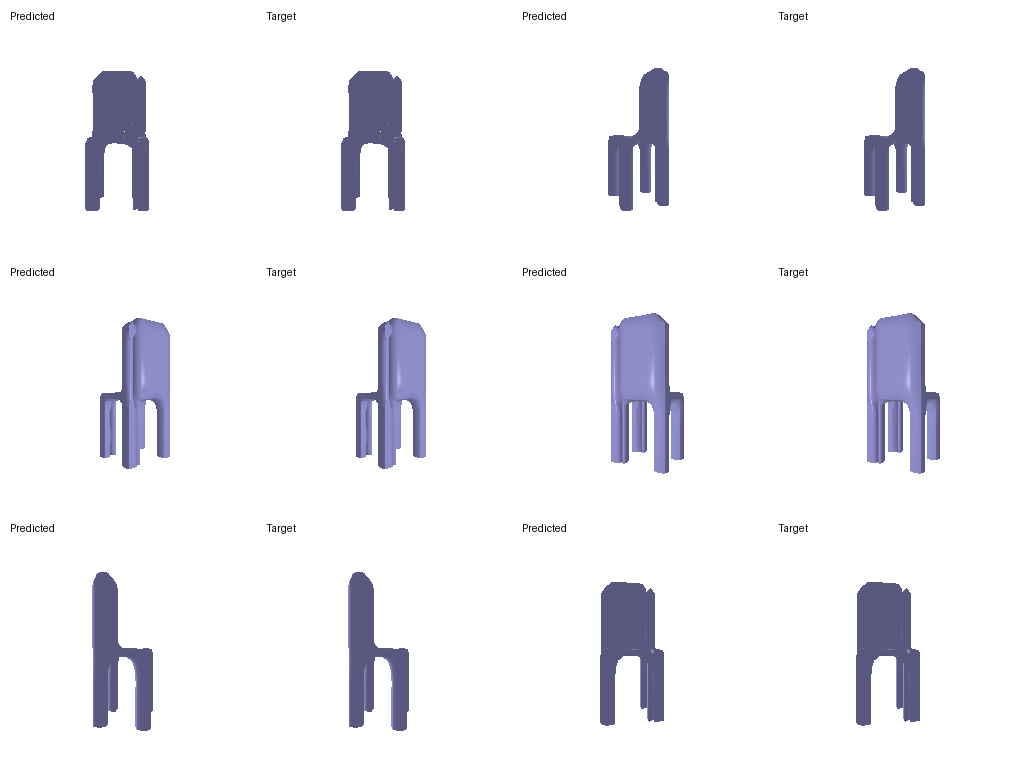
Chamfer + Laplacian smoothing, starting from an ico-sphere. Left: optimized, right: ground truth.
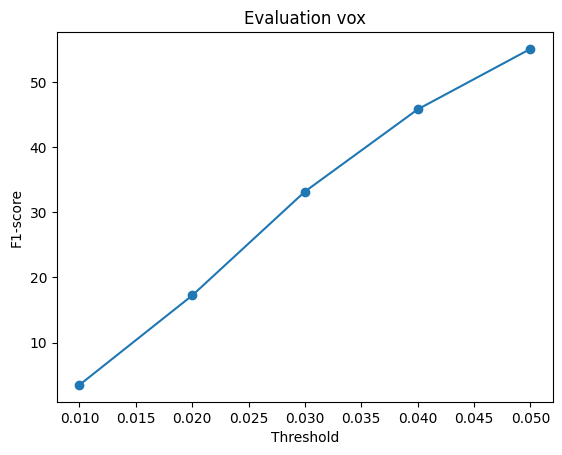
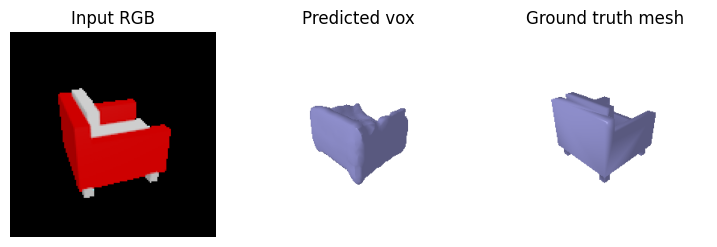
Linear layer + 3D transposed convs up to 32^3. Left to right: input, prediction, ground truth.
F1@0.05 = 55.1
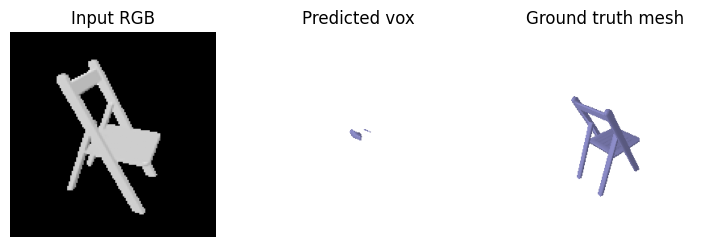
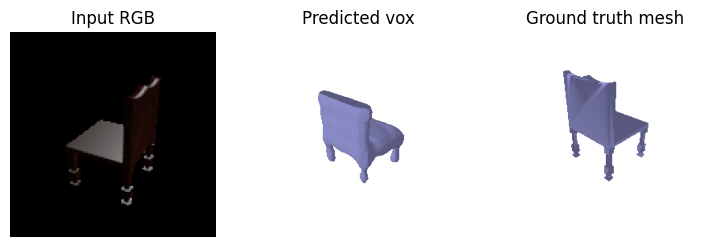
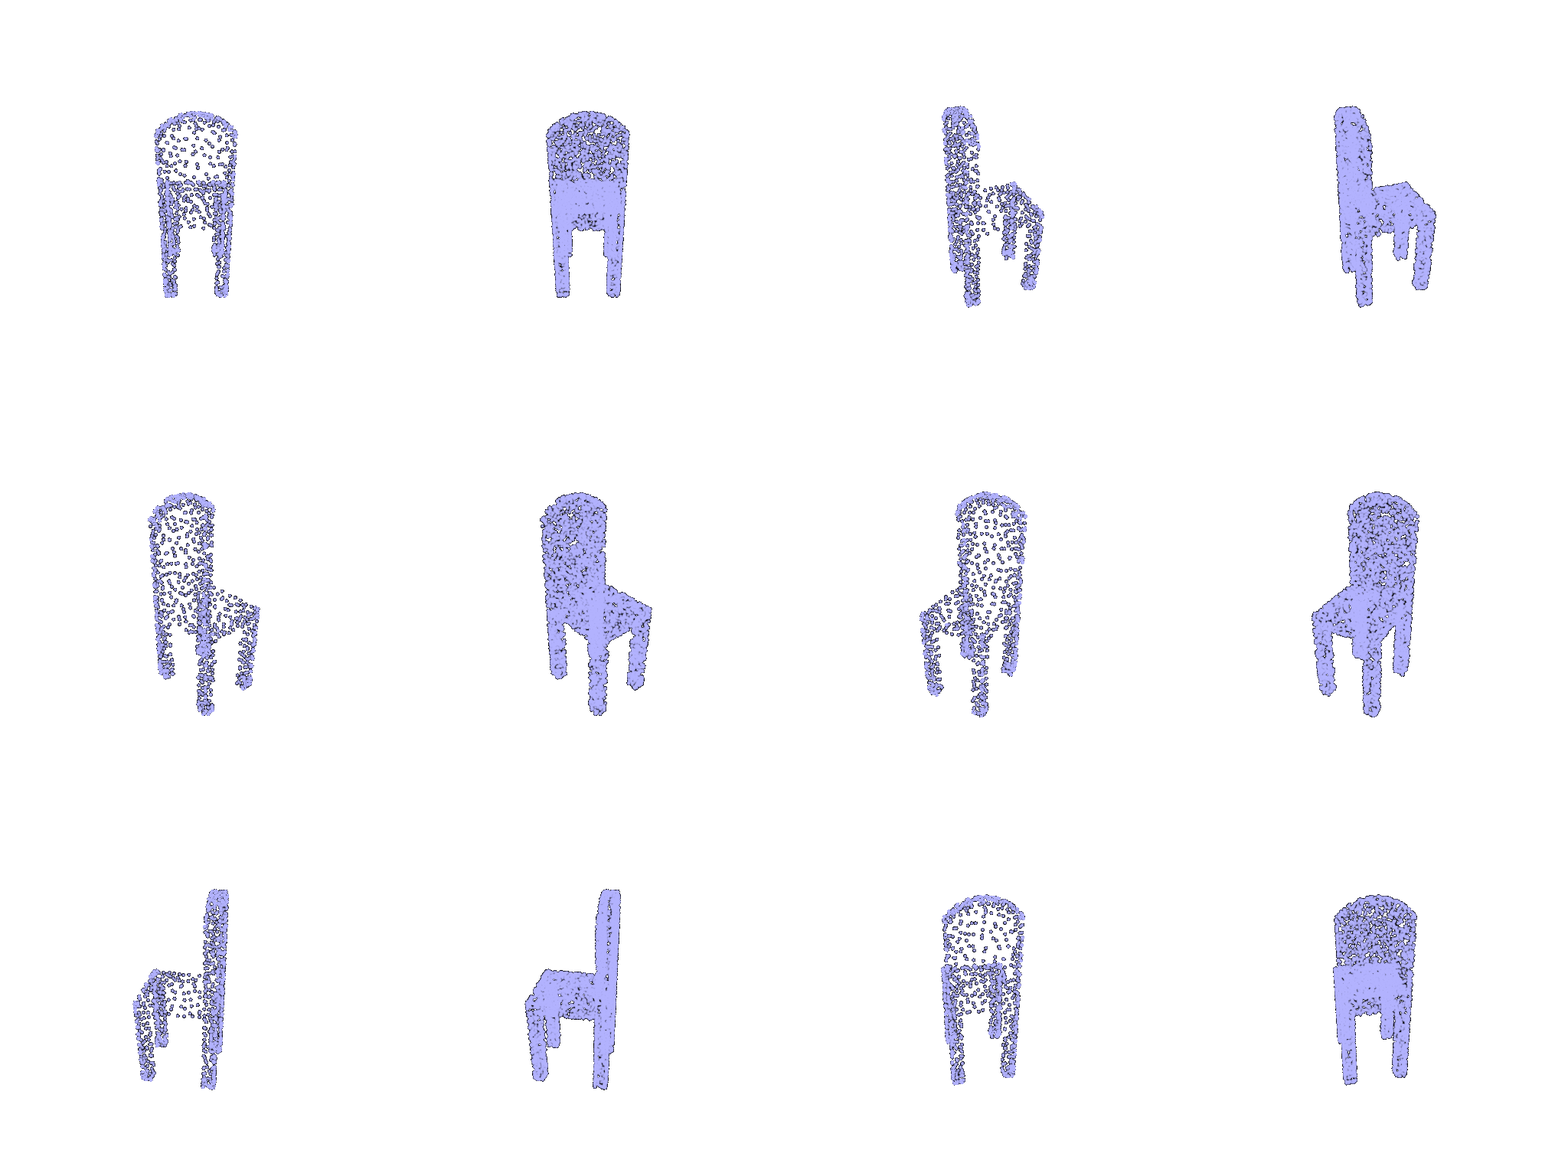
MLP that outputs 1000 points. Left to right: input, prediction, ground truth.
F1@0.05 = 81.0
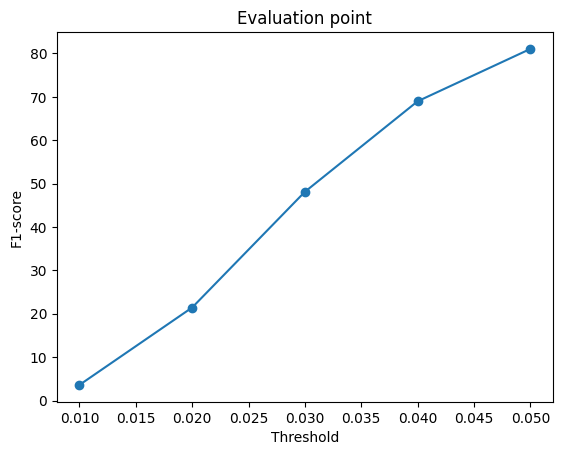
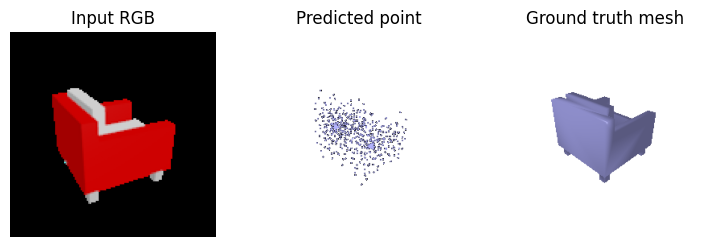
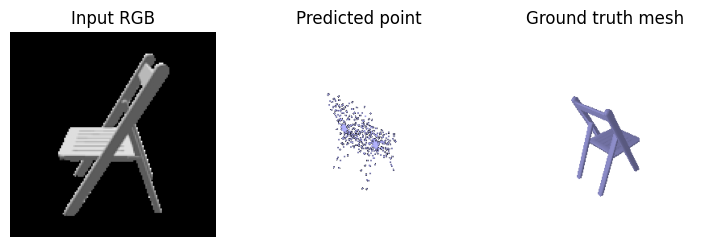
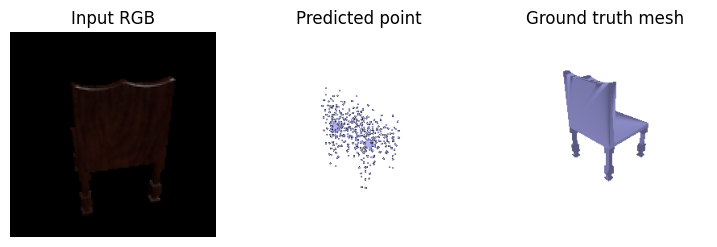
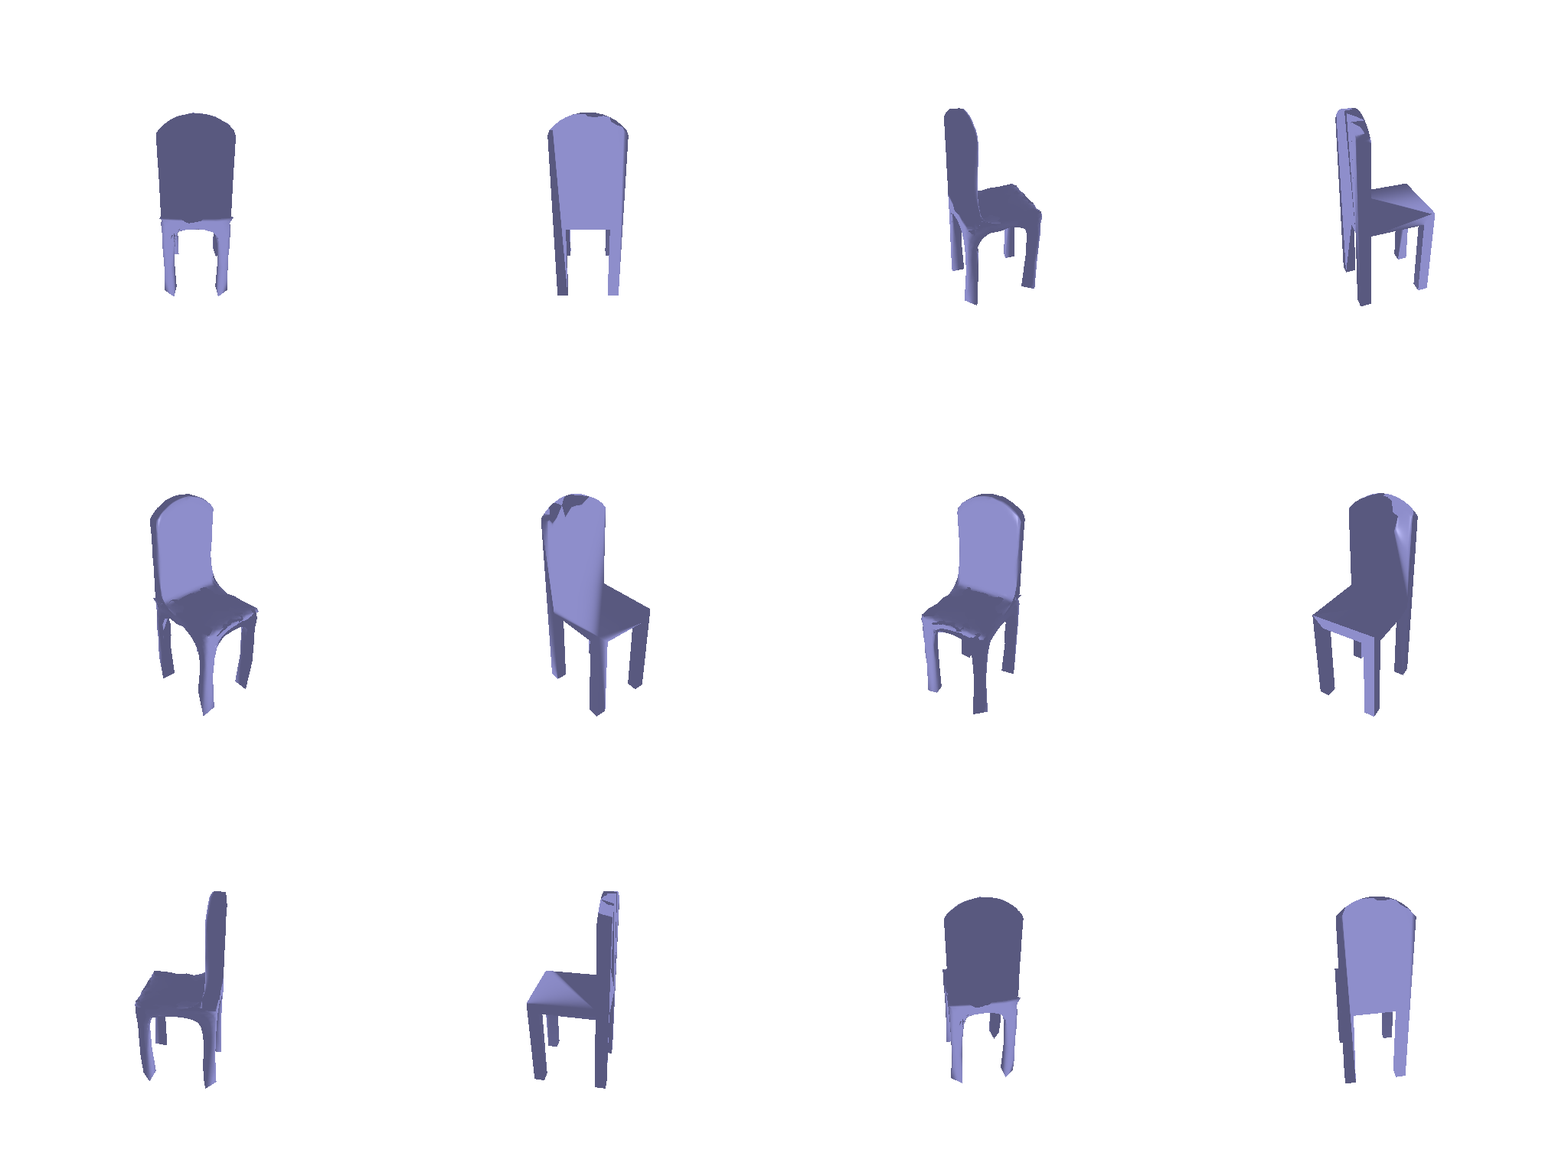
MLP that moves the vertices of an ico-sphere. Left to right: input, prediction, ground truth.
F1@0.05 = 71.7
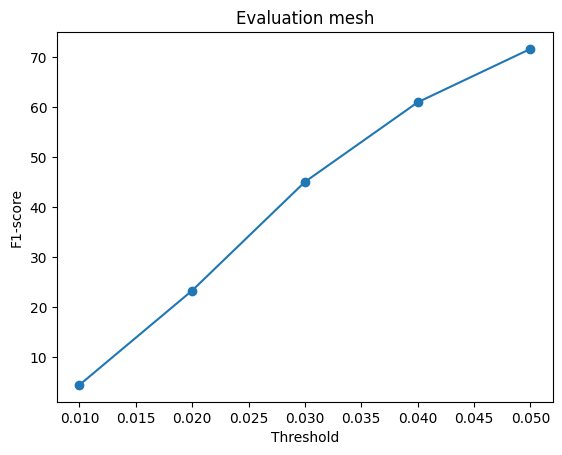
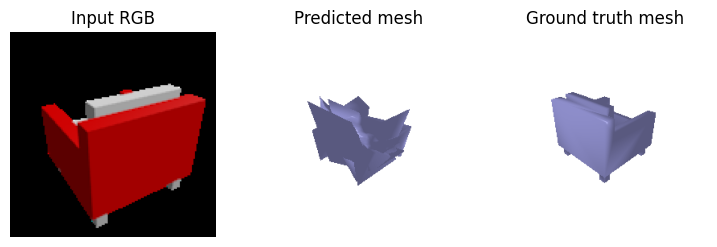
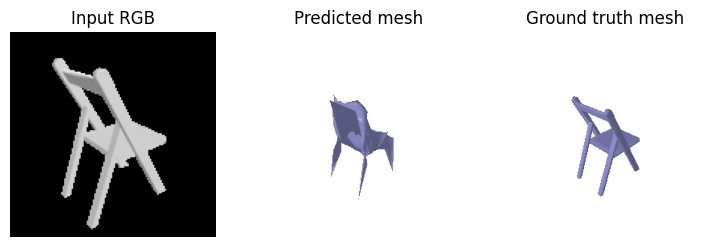
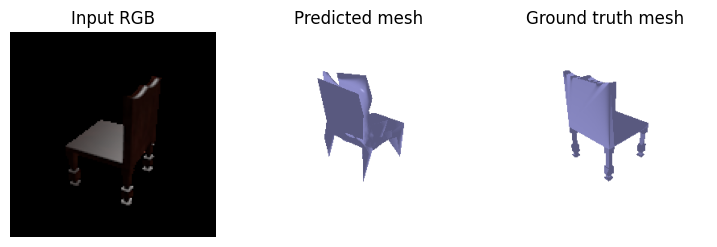
Comparison: point cloud (81.0) > mesh (71.7) > voxel (55.1)
The point cloud does best because each point can go anywhere, and chamfer loss is close to what F1 measures. The mesh has to stay a deformed sphere, so it can't open the gaps between legs or slats, and the smoothness term shrinks thin parts. Voxels do worst: at 32^3 a chair leg is thinner than one voxel, and since most of the grid is empty the model tends to predict thin parts as empty.
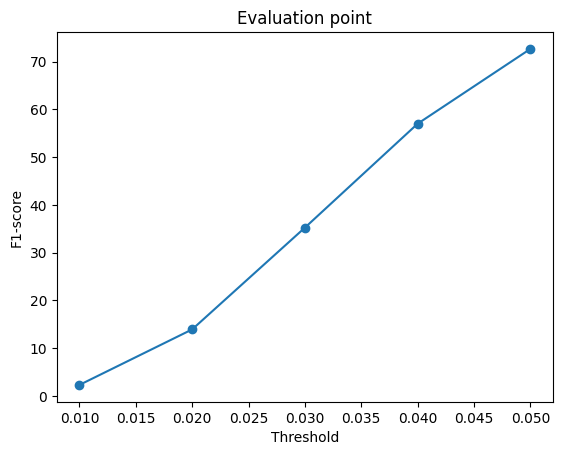
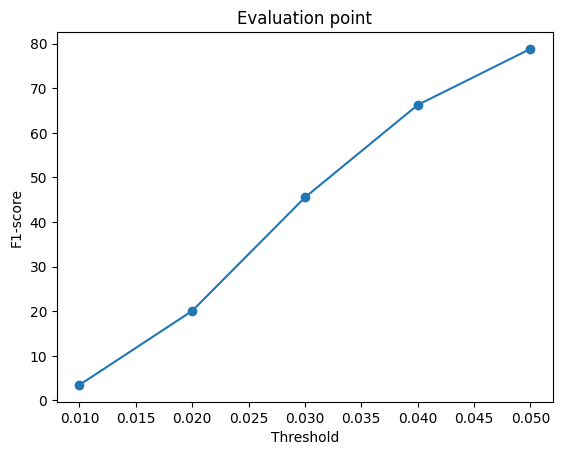
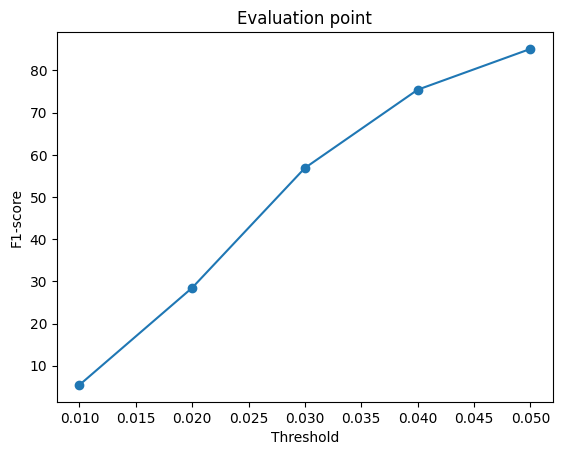
I changed n_points for the point cloud model (500, 1000, 3000) and trained each for 4000 iterations with everything else the same.
| n_points | F1@0.05 |
|---|---|
| 500 | 72.7 |
| 1000 | 78.8 |
| 3000 | 85.1 |
| n = 500 | n = 1000 | n = 3000 |
|---|---|---|
 |
 |
 |
 |
 |
 |
F1 goes up with more points. With 500 points the legs get very few points, so a lot of the ground truth has nothing predicted within 0.05 and recall suffers. More points cover the surface better, which helps both precision and recall. The downside is size and speed: the last layer has 2048 x 3n weights (18.4M at n = 3000), and evaluation took 91 s instead of 27 s at n = 500.
I made two visualizations: error maps for the point cloud model and an occlusion test for the mesh model.
Error maps. In the middle column each predicted point is colored by its distance to the closest ground truth point, so red there means the model put points where there is no chair. In the right column each ground truth point is colored by its distance to the closest predicted point, so red there means the model missed that part. Blue is close, red is 0.1 or more.
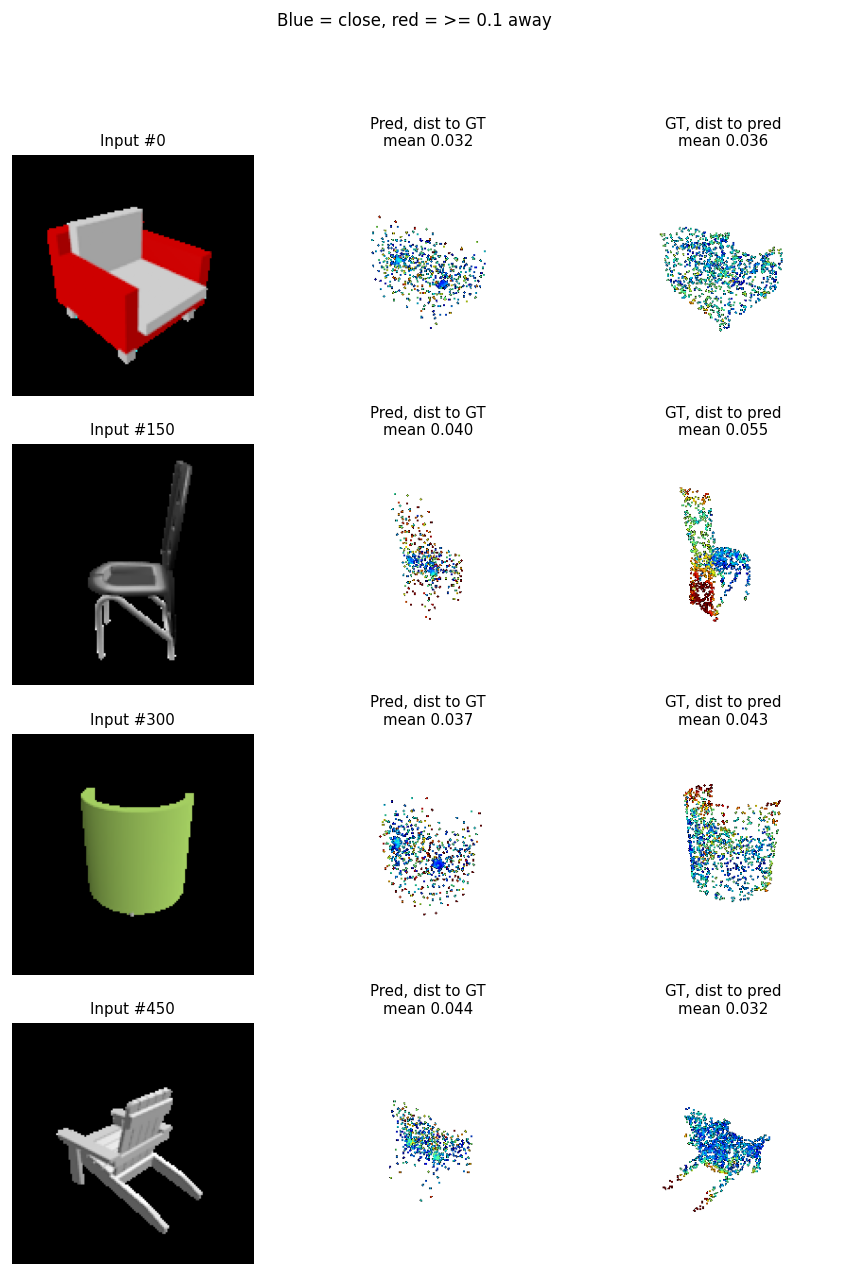
The seat and back are blue in both columns, so the model gets the main body right. Almost all the red is in the right column, on the legs (#150, #450) and the rim of the barrel chair (#300). So the model mostly leaves parts out rather than adding wrong ones, and it struggles with thin or unusual shapes.
Occlusion sensitivity. This follows Zeiler & Fergus, Visualizing and Understanding Convolutional Networks (ECCV 2014). I slide a 24x24 black patch (same color as the background) over the input with stride 12, run the mesh model on each occluded image, and record how much F1@0.05 drops. Red means covering that area hurts the prediction the most.

Covering the background does nothing, so the model is using the chair and not the background. The seat and the middle of the chair matter most (#0, #300, #450), while covering legs or armrest tips barely changes F1. That lines up with the error maps, since the legs are mostly missed anyway. The thin chair #150 (F1 34.9) has a weak, scattered map with a max drop of 1.6: the model doesn't get much from this image in the first place, so hiding parts of it doesn't change much.
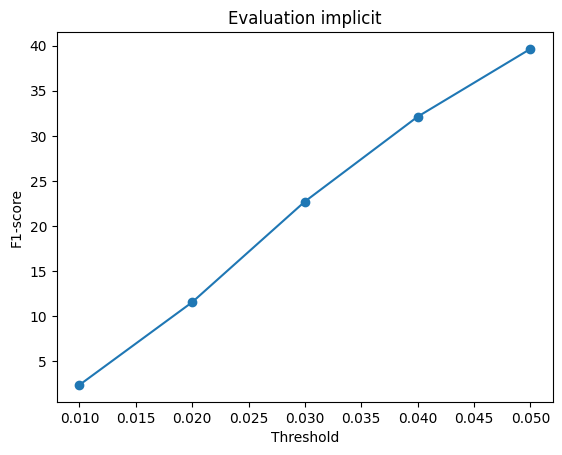
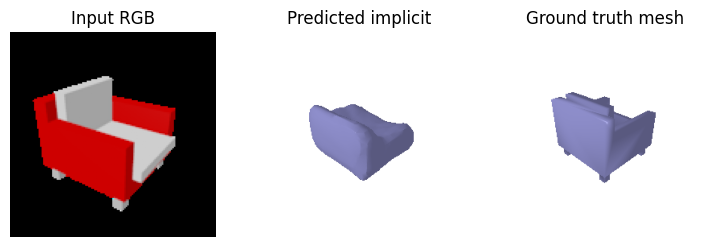
MLP that takes the image feature and an (x, y, z) point and gives the occupancy, queried on a 32^3 grid. Left to right: input, prediction, ground truth.
F1@0.05 = 39.6 (vs 55.1 for the voxel decoder)


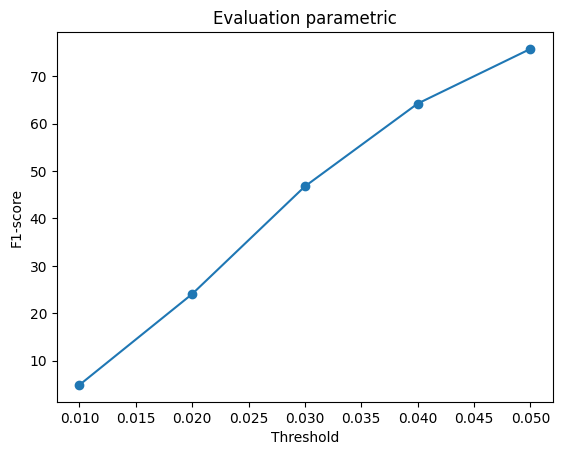
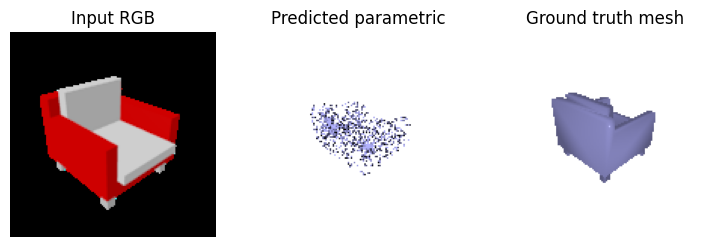
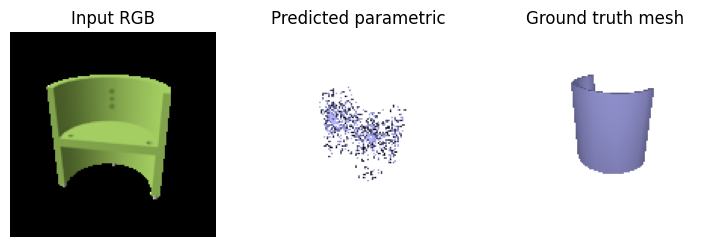
AtlasNet style: an MLP maps random (u, v) samples on 8 patches to 3D points. Left to right: input, prediction, ground truth.
F1@0.05 = 75.8 (vs 81.0 for the point decoder)
I set use_full_dataset = True in dataset_location.py, which switches to the extended dataset and split_3c.json. I used the point cloud model since it did best in Q2. Every model was trained with the Q2.2 settings (batch size 32, lr 4e-4, 10000 iterations, 1000 points). The 3-class model is one model trained on all three classes together. To test it on each class separately, and to train the car-only and plane-only models, I made per-class split files from split_3c.json. The chair split in split_3c.json is identical to the single-class chair split, so both chair models are tested on the same chairs.
The dataset has 10 rendered views per object. Training draws a random view each time an object is loaded, and evaluation uses one random view per test object.
| Class | Train objects | Train images | Test objects (= test images used) |
|---|---|---|---|
| Chair | 6100 | 61000 | 678 |
| Car | 3146 | 31460 | 368 |
| Plane | 3640 | 36400 | 405 |
| All 3 | 12886 | 128860 | 1451 |
F1@0.05 on each class's test set:
| Test class | Trained on that class only | Trained on 3 classes |
|---|---|---|
| Chair | 80.5 | 78.7 |
| Car | 92.3 | 92.7 |
| Plane | 96.2 | 96.0 |
The chair-only number is a new eval of the Q2.2 checkpoint, run alongside the other evals. It is 80.5 here instead of 81.0 because a different random view of each test object was used.
Same input image through both models. Each row: input | trained on 1 class | trained on 3 classes | ground truth.
| Chair | Car | Plane |
|---|---|---|
 | 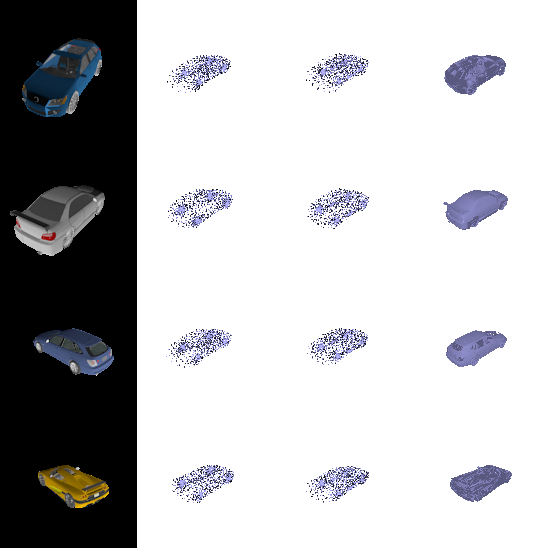 | 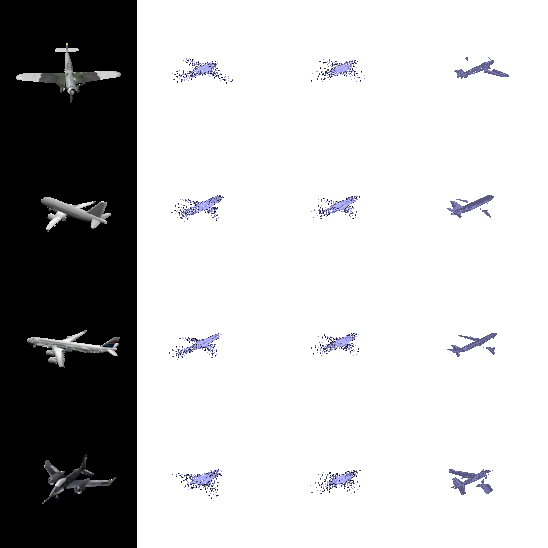 |
Training on three classes only hurts chairs, and only a little: F1 drops by 1.8 points (80.5 to 78.7). Car and plane barely change (+0.5 and -0.2), which is about the size of the noise from the random views. Two reasons chairs suffer most:
For the same image, the two models give almost the same point cloud, and I can't see a clear difference in the renders. In the samples I looked at, the 3-class model never mixes classes: it doesn't put wings on a chair or chair legs on a car. So the encoder tells the classes apart easily, and the three classes don't interfere much. Within a class, both models output a similar "average" shape and miss unusual details, for example the barrel chair (last chair row) comes out as a blob in both. Adding more classes did not make the outputs within a class any more varied.
I was curious whether a model trained on one category can do anything zero-shot on another one (even though I was pretty sure it would not work). It needed almost no extra code, so I ran each single-class model on all three test sets.
F1@0.05, rows are the class the model was trained on, columns are the test set:
| Trained on \ Tested on | Chair | Car | Plane |
|---|---|---|---|
| Chair | 80.5 | 71.1 | 66.8 |
| Car | 42.1 | 92.3 | 69.9 |
| Plane | 41.6 | 58.2 | 96.2 |
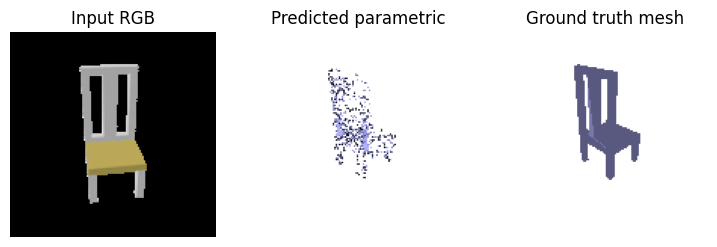
Car-only model on chairs. Left to right: input, prediction, ground truth.


Every model drops a lot on classes it never saw (80 to 96 on its own class, 42 to 71 on the others). The chair-only model holds up best on the other classes (71.1 on cars, 66.8 on planes), probably because chairs vary the most, so it learned a wider range of shapes. The car and plane models do worst on chairs (42.1 and 41.6). In the renders above the car-only model gives a flat cloud of points in the middle, with no back or legs. So there is no real zero-shot transfer: the model only rebuilds shapes it saw in training, and each class has to be in the training data.