



Quantitative Comparison of 3D Representations
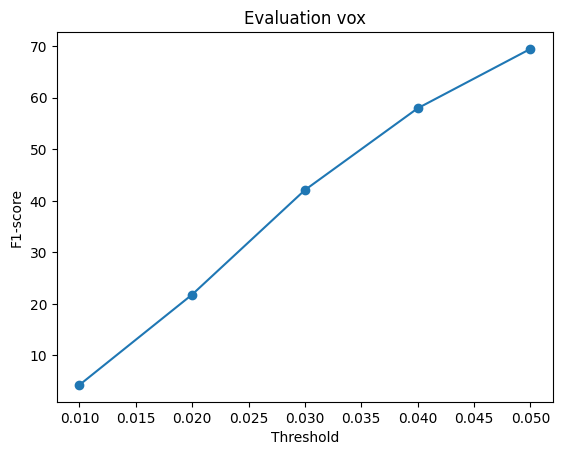
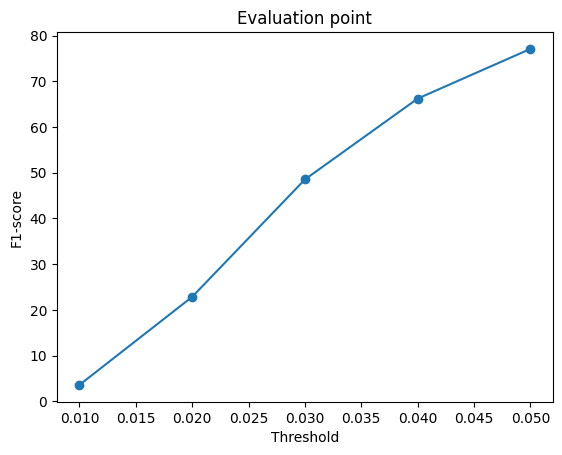
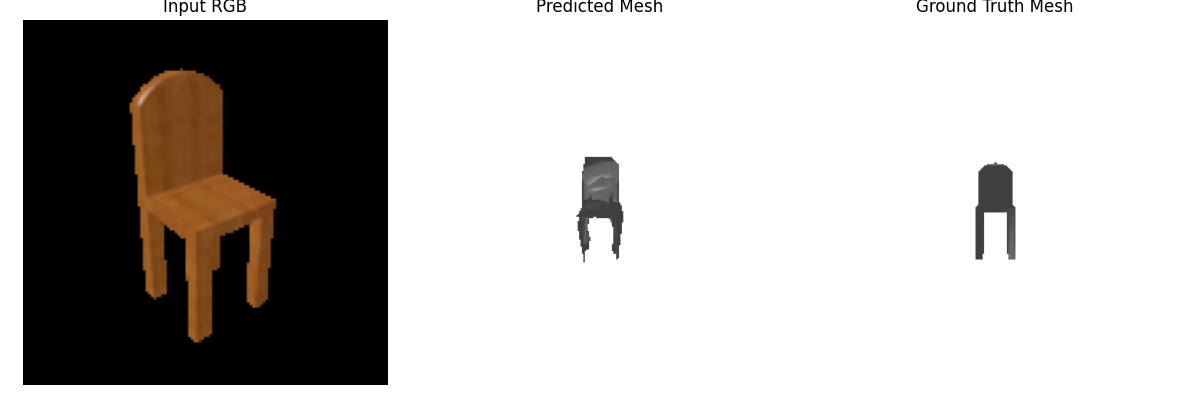
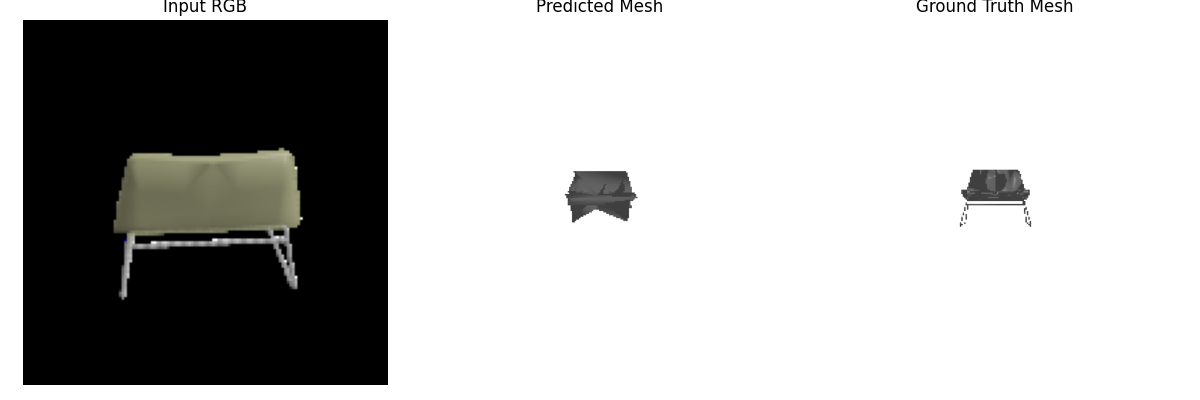
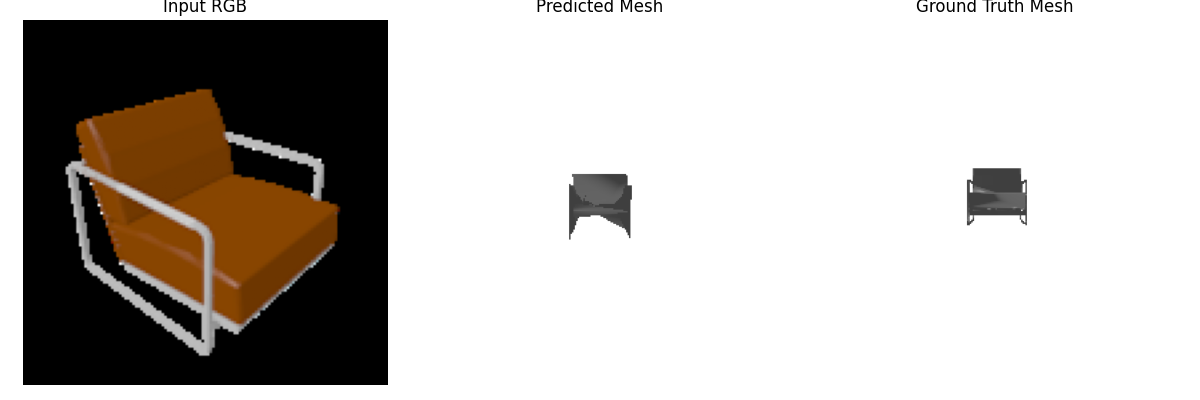
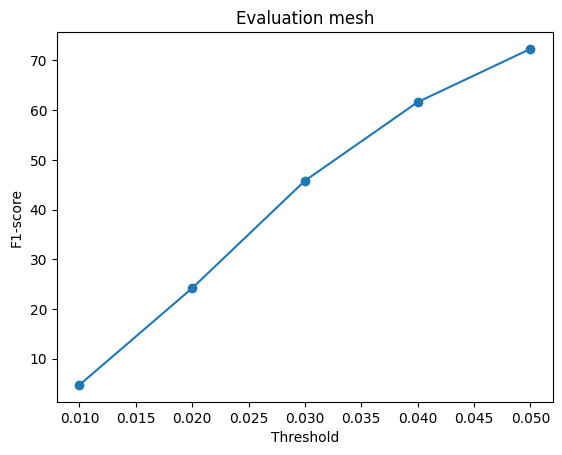
The reconstruction performance at F1@0.05 is:
| Representation | F1@0.05 |
|---|---|
| Voxel grid | 70.3 |
| Mesh | 71.6 |
| Point cloud | 76.6 |
The point cloud representation performs the best, followed by the mesh and then the voxel grid.
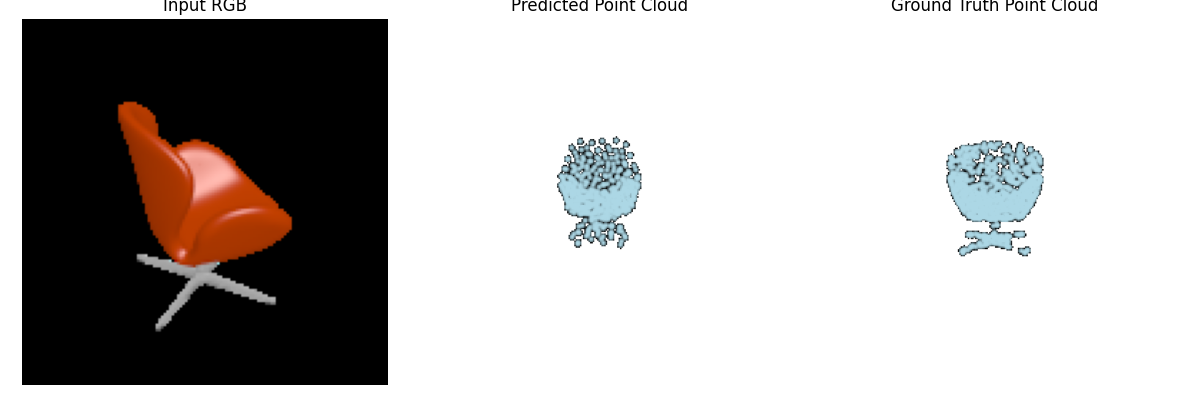
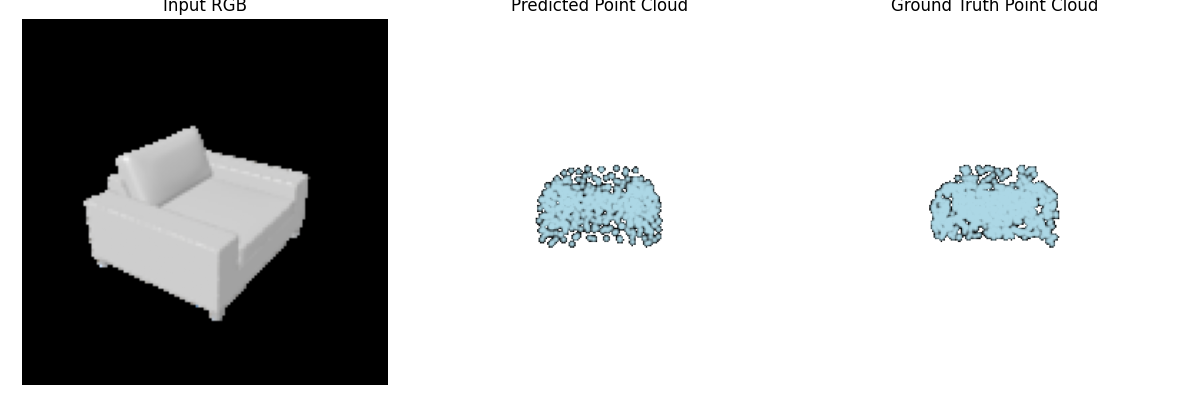
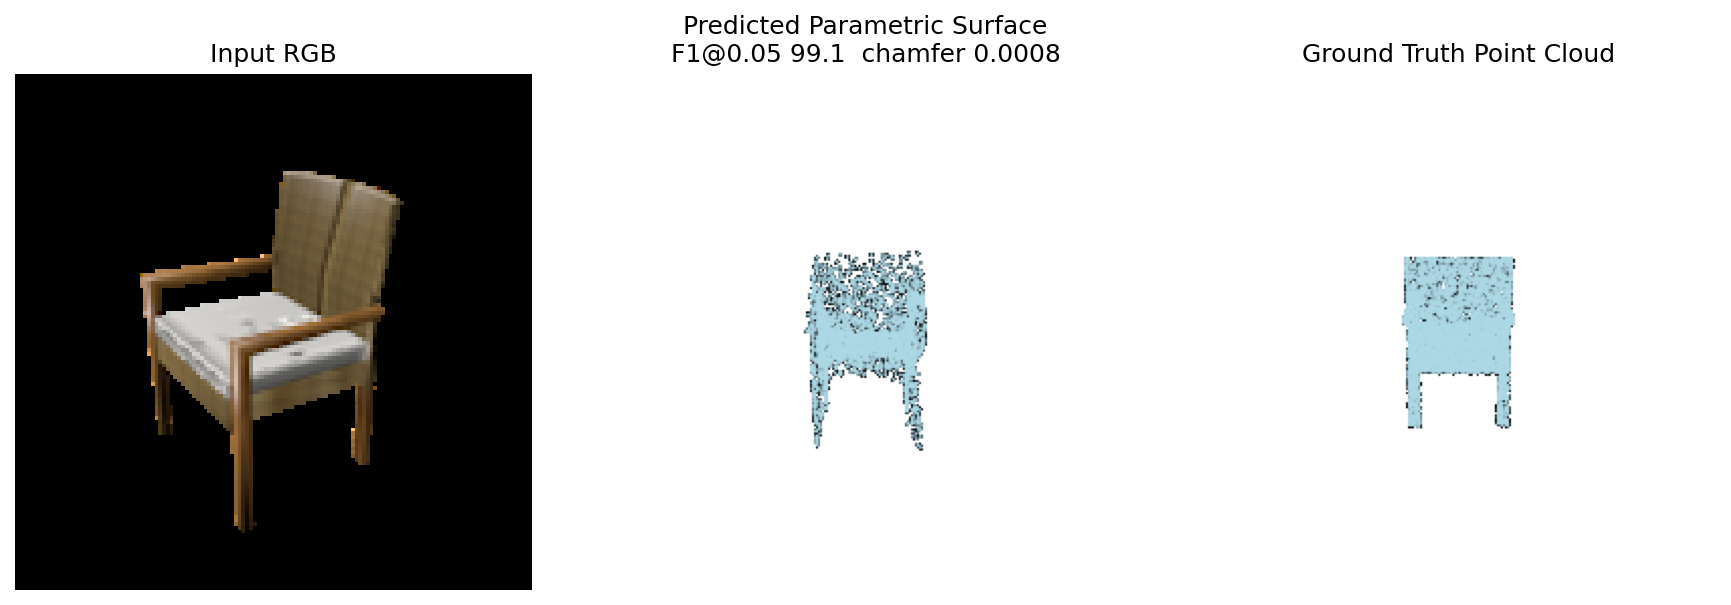
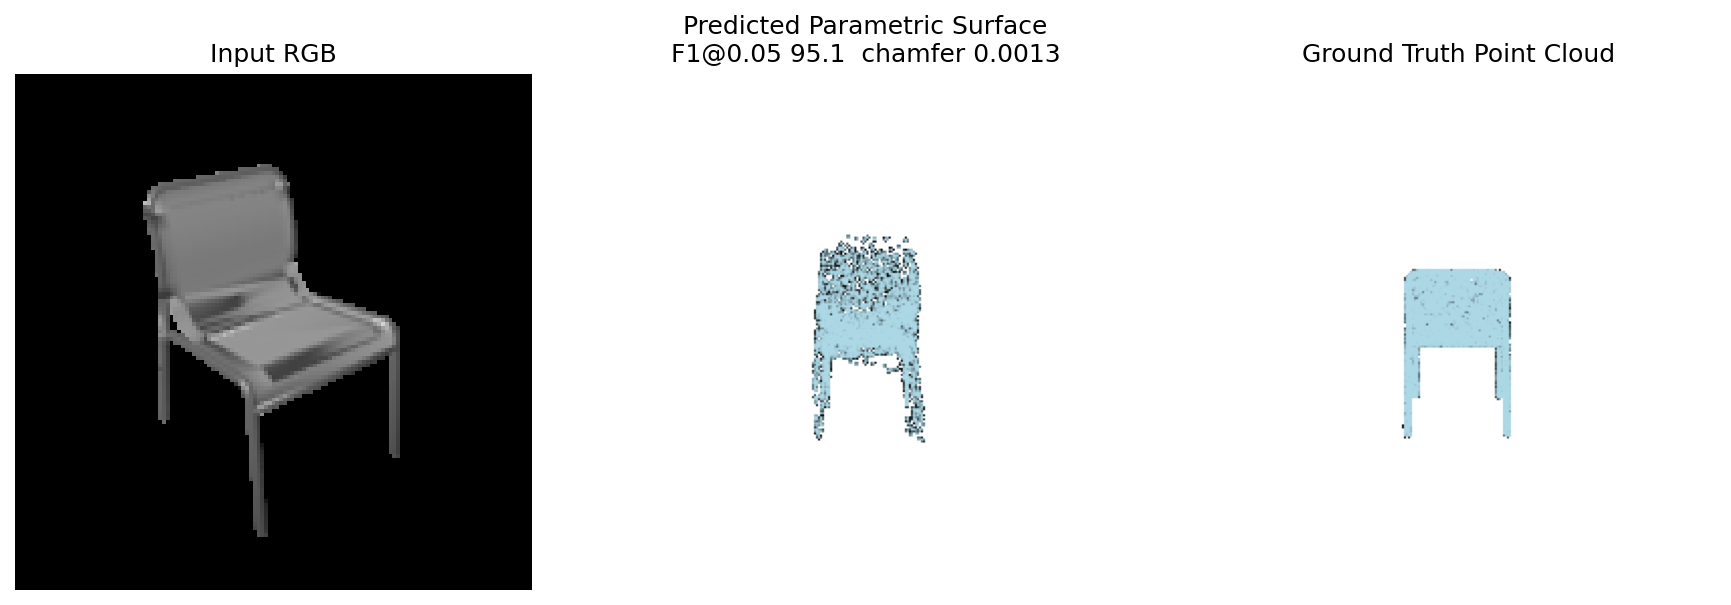
A simple reason is that point clouds directly place points on the surface of the object, so they can match the ground-truth shape well. However, the points can sometimes look a bit scattered.
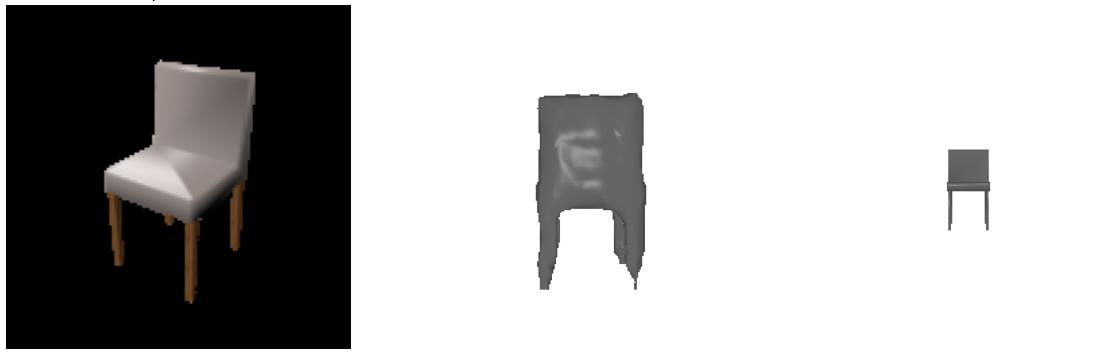
Voxel grids divide the whole 3D space into small cubes. Because the resolution is limited, thin parts like chair legs or narrow edges can become blocky or may be missed.
Meshes give a smooth connected surface, so they usually look more structured than voxels. However, since the vertices are connected, the model has less freedom to place points anywhere compared to a point cloud.
Q2.4
Analyse effects of hyperparams variations
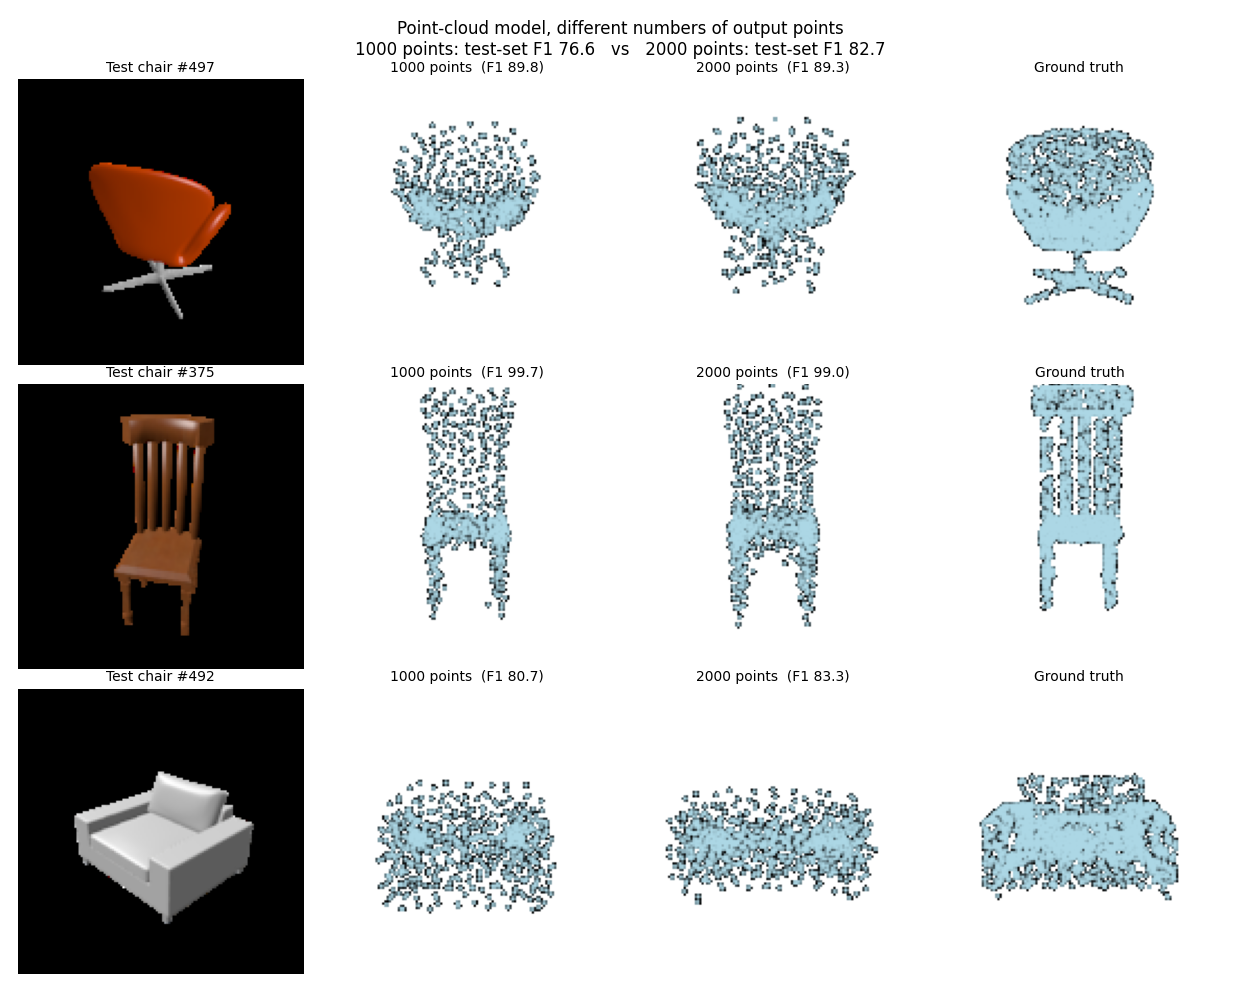
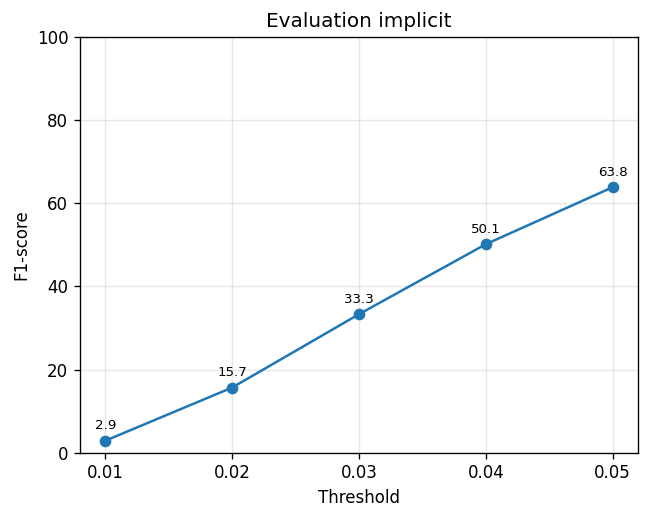
Increasing the number of output points from 1000 to 2000 improves the overall test-set F1 score from 76.6 to 82.7. This increase is partly expected because a denser point cloud places more predicted points around the object surface, increasing the chance that points fall within the evaluation threshold of the ground truth. However, visually the additional points are also more scattered, so the improvement in F1 does not necessarily mean that the reconstructed shape is cleaner or more accurate everywhere. In some examples, the 1000-point prediction is actually more compact, while the 2000-point version provides better coverage but with more noisy or misplaced points.
Q2.5
Interpreting the Model
Reconstruction vs retrieval

This visualization tests whether the network is truly reconstructing shapes or simply retrieving similar training examples. The scatter plot shows that for most test chairs, the model prediction achieves a higher F1 score than the nearest training chair, with an overall average of 76.6 compared to 57.1 for retrieval. This indicates that the model has learned a shape prior and can synthesize a better reconstruction than memorization alone.
Per-point error map
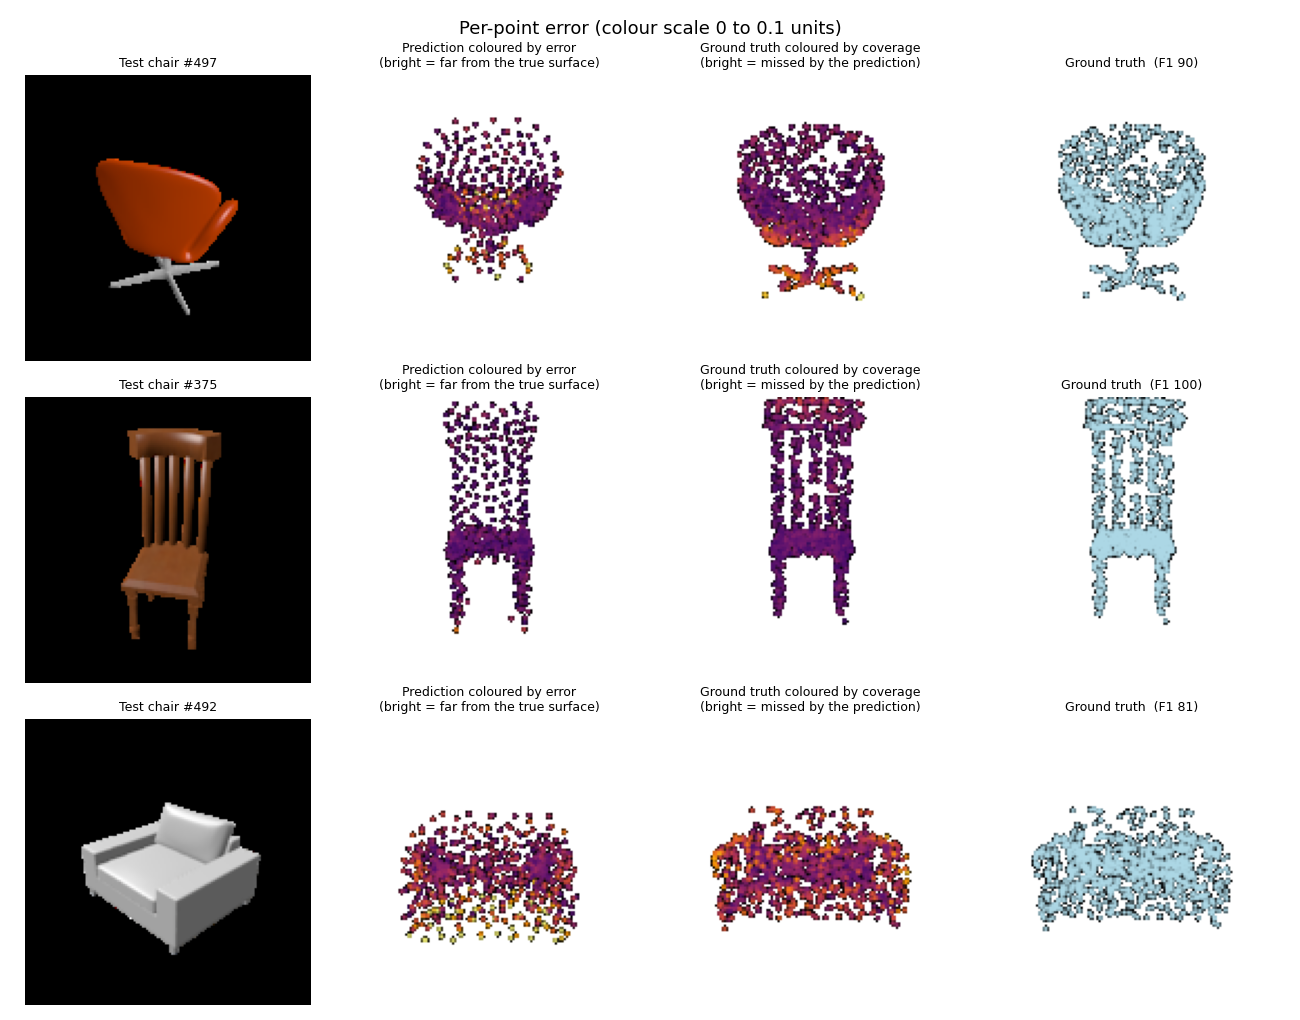
The per-point error visualization provides a more detailed view of model behavior than a single metric. Predicted points are colored by their distance from the ground-truth surface, while ground-truth points are colored by whether they are covered by the prediction. This shows that the model generally captures the coarse structure well, but struggles more with thin parts and fine details such as legs, edges, and narrow support structures.

!jupyter nbconvert --to html index.ipynb
[NbConvertApp] Converting notebook index.ipynb to html
[NbConvertApp] Writing 289247 bytes to index.html