Assignment 5 for 16-825 (Point Cloud Processing)
Setup. Both PointNet models follow the original paper without the transformation blocks. They use a shared per-point MLP (3 → 64 → 64 → 64 → 128 → 1024) and a max-pool. The classifier passes the pooled feature through an MLP (1024 → 512 → 256 → 3). The segmentation model concatenates each point's 64-d feature with the 1024-d global feature and predicts a label per point (1088 → 512 → 256 → 128 → 6). Training: Adam, learning rate 0.001, batch size 32, 250 epochs, 10,000 points per object. The checkpoint with the best test accuracy is used.
1. Classification Model (30 points)
Test accuracy: 97.90% (933 of 953 objects). Per class: chair 99.8%, vase 91.2%, lamp 95.7%.
Random test objects
Two random objects from each class. All six are classified correctly.




Failure cases
One misclassified object per class:


- Chair → lamp. This chair is almost flat, like a cut-out panel, with no depth to the seat. Its thin, flat outline is closer to a lamp shade on a stand than to a normal chair. This is the only chair the model gets wrong.
- Vase → lamp. This vase has a wide, heavy base with a tall, thin panel standing on it. That is the usual layout of a lamp (base, stem, shade), so the model predicts lamp.
- Lamp → vase. This lamp is a closed cylindrical drum with no visible stem or base. From its points alone it looks exactly like a round vase.
Most errors are between vases and lamps. Both are often tall, round objects with a base, and vases are the smallest class in training (11% of the data), so they have the lowest accuracy.
2. Segmentation Model (30 points)
Test accuracy: 90.20% of all points (617 chairs). Colors: cyan = back, red = seat, yellow = arms, blue = legs, magenta and white = two small parts.


| Object | 350 | 13 | 518 | 134 | 351 (bad) | 235 (bad) |
|---|---|---|---|---|---|---|
| Accuracy (%) | 94.7 | 85.2 | 79.3 | 76.8 | 48.1 | 51.4 |
Interpretation. The model does well on chairs with clearly separated parts. Object 350 is a simple four-legged chair at 94.7%, with small errors only where the legs meet the seat. Most errors are at boundaries between parts that touch, like back and arms on the curved shell chair (13) or seat and arms on the boxy armchair (134). In those places the split in the ground truth is somewhat arbitrary. The two bad cases are unusual chairs:
- Object 351 (48.1%) is a barrel chair whose sides go down to the floor. The model labels the whole lower half as legs, because that is where legs usually are, but in the ground truth that region is back and arms.
- Object 235 (51.4%) is a sofa-like box chair. The model makes the seat much larger than in the ground truth and gets the boundary between arms and back wrong.
The model mostly uses the height and position of a point inside the object, so it fails on chairs whose parts are not where a normal chair has them. The smallest part (magenta, 0.13% of all points) is mostly wrong (16% correct).
3. Robustness Analysis (20 points)
I ran nine experiments on the trained Q1 and Q2 models, without retraining. Each one applies one kind of change to every test object at several strengths. The first value in each table is the unchanged input, so it matches the Q1/Q2 results (97.9% and 90.2%). The exception is the density table, whose first value already keeps only half of the points. Each figure shows three test objects. The first column is the unchanged input. In the segmentation figures, the first column is the ground truth and white points (class 0) are drawn in orange so they can be seen.
3.1 Rotation about the up axis
Procedure. I rotate every test object about the vertical (y) axis by a fixed angle and evaluate the Q1 and Q2 models without retraining.
| Angle (°) | 0 | 15 | 30 | 45 | 60 | 90 | 135 | 180 |
|---|---|---|---|---|---|---|---|---|
| Classification (%) | 97.9 | 97.5 | 91.8 | 79.8 | 62.5 | 59.1 | 31.6 | 35.1 |
| Segmentation (%) | 90.2 | 86.6 | 79.6 | 73.9 | 69.2 | 59.5 | 55.3 | 58.1 |


Interpretation. Accuracy drops quickly after about 30°. For classification, almost all the loss comes from chairs: at 180° only 5% of chairs are correct, while vases and lamps stay around 90%, because most vases and lamps look the same from every side. For segmentation, legs are still found (91% at 90°) since they stay at the bottom, but back and arms are mostly wrong. The model learned where the back is in absolute coordinates, not relative to the seat.
3.2 Tilting the object
Procedure. Same as above, but the rotation is about the horizontal x axis, so the object tips forward.
| Angle (°) | 0 | 15 | 30 | 45 | 60 | 90 | 135 | 180 |
|---|---|---|---|---|---|---|---|---|
| Classification (%) | 97.9 | 94.1 | 88.0 | 73.2 | 44.1 | 26.3 | 68.1 | 69.0 |
| Segmentation (%) | 90.2 | 84.0 | 73.1 | 62.2 | 45.6 | 34.6 | 25.9 | 33.7 |


Interpretation. Tilting hurts more than yaw: at 90° classification falls to 26% and segmentation to 35%. All training objects are upright, so the model depends on "up" being up. At 180° classification partly recovers (69%), since an upside-down chair or lamp still has a similar silhouette, but segmentation does not: legs (2%) and back (2%) swap places, and only the seat in the middle stays right.
3.3 Number of points per object
Procedure. I randomly sample fewer points from each test object (the models were trained with 10,000).
| Points | 10000 | 5000 | 2048 | 1024 | 512 | 256 | 128 | 64 | 32 |
|---|---|---|---|---|---|---|---|---|---|
| Classification (%) | 97.9 | 97.7 | 97.5 | 97.4 | 96.6 | 96.1 | 94.7 | 90.6 | 80.9 |
| Segmentation (%) | 90.2 | 90.2 | 90.1 | 89.7 | 88.6 | 86.3 | 82.6 | 78.6 | 73.4 |
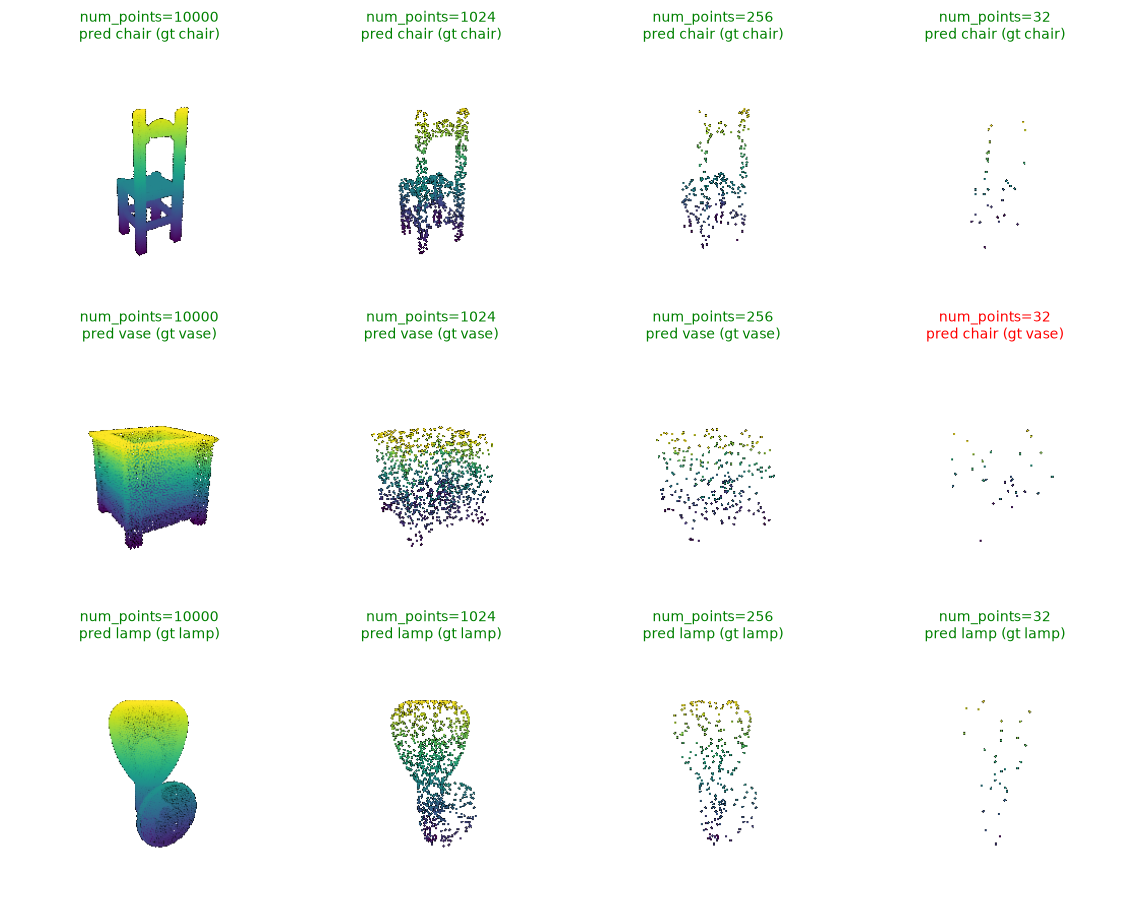
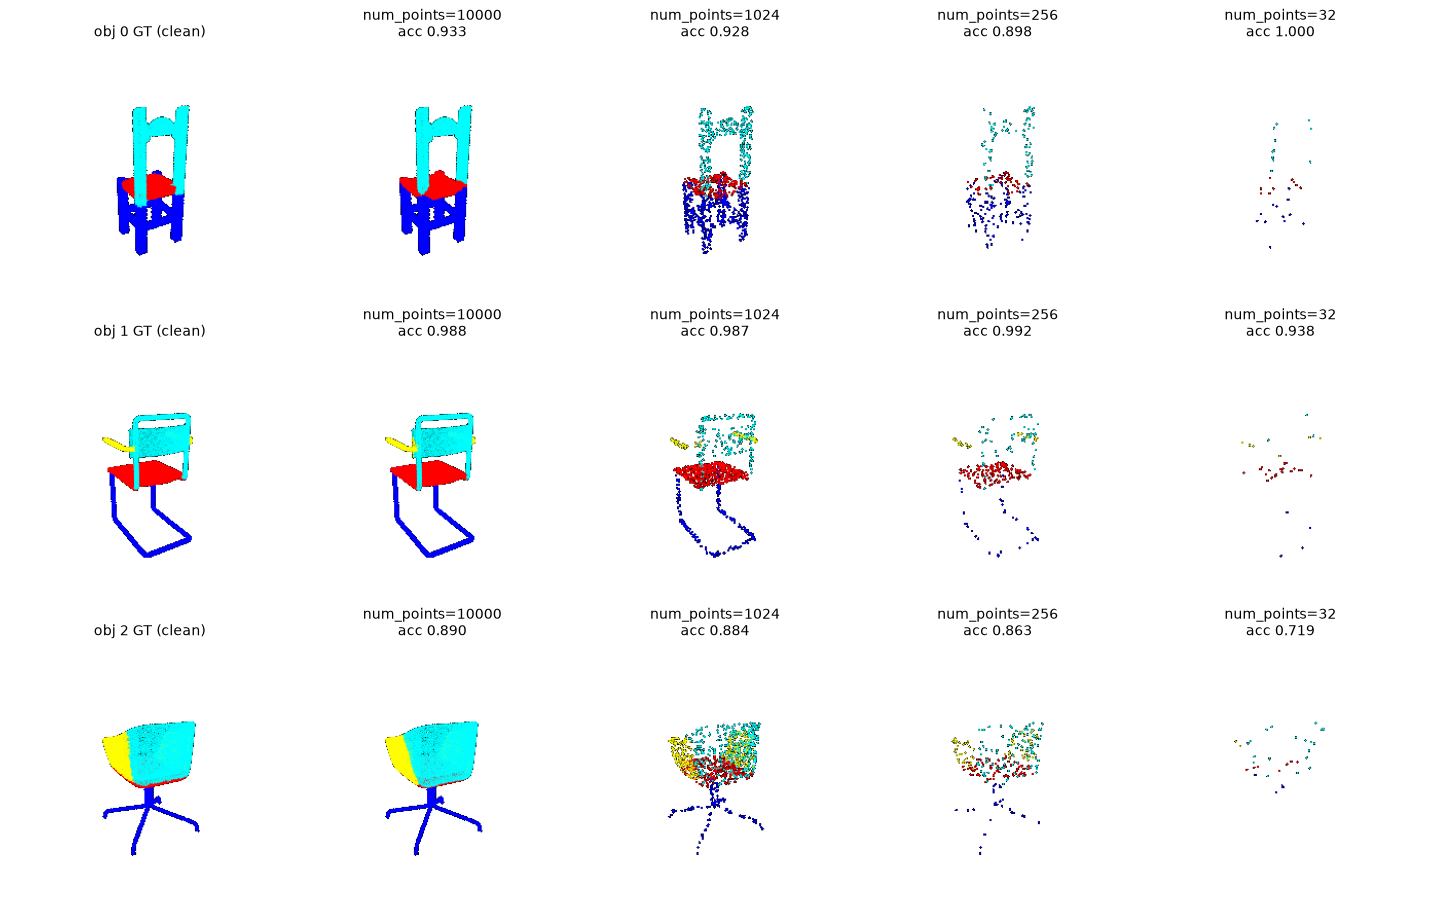
Interpretation. PointNet is very robust to this. With 1,024 points accuracy is almost unchanged, and with only 128 points it still gets 94.7% (cls) and 82.6% (seg). The max-pool only needs a few points on each important part to produce a similar global feature. Vases fail first (8% correct at 32 points), since their shape is a smooth surface with few distinctive points. Small parts in segmentation also get fewer points and are lost first.
3.4 Outlier points
Procedure. I replace a fraction of each object's points with random points drawn uniformly in the cube [−1, 1]³. For segmentation, accuracy is computed only on the real points.
| Fraction replaced | 0 | 0.01 | 0.05 | 0.1 | 0.2 | 0.4 |
|---|---|---|---|---|---|---|
| Classification (%) | 97.9 | 25.5 | 11.2 | 10.7 | 10.7 | 10.7 |
| Segmentation (%) | 90.2 | 72.5 | 66.9 | 65.6 | 65.0 | 65.2 |


Interpretation. This is the weakest point of PointNet. Replacing just 1% of the points drops classification from 97.9% to 25.5%, and at 10% or more the model predicts "vase" for every object (10.7% is exactly the share of vases in the test set). Because of the max-pool, a few points far from the object can set many channels of the global feature, and points filling a box around the object look like a large, solid vase. Segmentation drops to 72.5% with 1% outliers and about 65% beyond that. The shared global feature is corrupted, so arms (12%) and legs (53%) are mostly lost already at 1%.
3.5 Partial object (occlusion)
Procedure. For each object I pick a random direction and remove the given fraction of points that lie furthest along it, as if one side of the object were not seen.
| Fraction removed | 0 | 0.1 | 0.25 | 0.4 | 0.5 | 0.7 |
|---|---|---|---|---|---|---|
| Classification (%) | 97.9 | 96.5 | 89.6 | 78.0 | 69.9 | 51.3 |
| Segmentation (%) | 90.2 | 88.8 | 84.7 | 79.4 | 76.7 | 72.2 |


Interpretation. Accuracy goes down steadily with the missing fraction. With half of the object removed, classification is 69.9% and segmentation 76.7%. Vases are hit hardest in classification (42%), since half a vase is just a curved sheet. In segmentation, the parts that are still there are mostly labelled correctly, but small parts like arms (37%) suffer the most because they are often cut away completely or left as small pieces.
3.6 Gaussian noise
Procedure. I add Gaussian noise with standard deviation σ to every coordinate. The objects span about 1.5 units, so σ = 0.04 is a small amount of noise and σ = 0.16 is very heavy.
| Std σ | 0 | 0.01 | 0.02 | 0.04 | 0.08 | 0.16 |
|---|---|---|---|---|---|---|
| Classification (%) | 97.9 | 97.6 | 96.6 | 90.1 | 77.9 | 31.8 |
| Segmentation (%) | 90.2 | 89.9 | 88.9 | 85.1 | 76.5 | 63.8 |


Interpretation. Small noise (σ ≤ 0.02) changes little. At σ = 0.08 classification drops to 77.9%, and almost all of the errors are lamps being called vases (lamps are 28% correct, vases 100%): noise turns thin stems and shades into a fuzzy blob. In segmentation, thin parts fail first: legs drop to 62% and arms to 44%, while the large back and seat stay above 80%.
3.7 Uneven point density
Procedure. I keep half of the points, but sample them with probability proportional to exp(α · p·d) for a random direction d. With α = 0 the sampling is uniform. With large α most points come from one side of the object, which is how a real sensor sees an object.
| Strength α | 0 | 1 | 2 | 4 | 8 | 16 |
|---|---|---|---|---|---|---|
| Classification (%) | 97.9 | 97.7 | 97.6 | 97.9 | 96.0 | 87.5 |
| Segmentation (%) | 90.2 | 90.3 | 90.3 | 90.3 | 89.0 | 84.9 |


Interpretation. The models are quite robust to this. Up to α = 4 there is no change at all, and even at α = 16, where one side is almost empty, classification is 87.5% and segmentation 84.9%. Unlike occlusion, every part still keeps a few points, and that is enough for the max-pool.
3.8 Stretching the height
Procedure. I scale the y coordinate of each object by a factor, which makes it shorter or taller without changing the width.
| Scale on y | 0.5 | 0.75 | 1.0 | 1.25 | 1.5 | 2.0 |
|---|---|---|---|---|---|---|
| Classification (%) | 90.8 | 94.9 | 97.9 | 97.2 | 95.4 | 90.1 |
| Segmentation (%) | 82.4 | 88.5 | 90.2 | 88.1 | 81.8 | 68.1 |


Interpretation. Classification is fairly robust (above 90% at both 0.5× and 2×), so the model is not just using the height-to-width ratio. Segmentation is more sensitive at 2× (68.1%): the seat (49%) and arms (41%) are predicted at the height where they usually are, not where they moved to.
3.9 Shifting the object
Procedure. I move each object by a fixed distance in a random direction. The training data is always centered.
| Shift distance | 0 | 0.1 | 0.2 | 0.4 | 0.8 |
|---|---|---|---|---|---|
| Classification (%) | 97.9 | 96.3 | 93.7 | 75.9 | 33.3 |
| Segmentation (%) | 90.2 | 88.1 | 83.2 | 68.9 | 45.0 |


Interpretation. Both tasks get much worse with larger shifts: at a distance of 0.8, classification is 33.3% and segmentation 45.0%. PointNet works directly on absolute coordinates, so a shifted chair looks like a new shape to it. Centering the input before inference would remove this problem.
Summary
PointNet handles fewer points and uneven density very well, because the max-pool only needs a few points from each part. It is weak to rotation, shifts and outlier points, because it works on absolute coordinates and every point can change the global feature. Outliers are the worst case: 1% of random points is enough to break the classifier.
4. Bonus: Locality with a Point Transformer (20 points)
Model
I implemented a simplified Point Transformer (Zhao et al., 2021), based on the paper linked in the assignment. The main idea is local vector self-attention. For each point, I find its 16 nearest neighbors. The point's feature is updated with attention over only these neighbors, using a learned encoding of the relative position pi − pj:
yi = Σj ∈ kNN(i) softmaxj( γ(qi − kj + δij) ) ⊙ (vj + δij), δij = MLP(pi − pj)
The attention weights are per channel (vector attention), and γ is a small MLP. The full network is:
- A per-point embedding (3 → 64 → 128).
- Three Point Transformer blocks (linear, attention layer, linear, with a residual connection), width 128, all sharing one kNN graph.
- The outputs of the three blocks are concatenated (384-d per point), lifted to 1024-d and max-pooled into a global feature.
- Classification: the same MLP head as in Q1.
- Segmentation: each point's 384-d local feature is concatenated with the global feature and passed through a per-point MLP (1408 → 256 → 128 → 6).
To keep it simple I left out the transition-down and transition-up layers of the paper, so all blocks work on the full point set. The models were trained for 100 epochs with 2,048 randomly sampled points per object (new samples every batch), Adam with learning rate 0.001 and batch size 32.
Test accuracy
| Model | Points | Classification | Segmentation |
|---|---|---|---|
| PointNet (Q1/Q2) | 10,000 | 97.90% | 90.20% |
| PointNet (Q1/Q2) | 2,048 | 97.17% | 90.15% |
| Point Transformer | 2,048 | 97.90% | 91.60% |
Classification is the same as PointNet. Classification is already almost saturated on this dataset, and the errors left are mostly ambiguous shapes. Segmentation improves by 1.4 points, because each point's label now also depends on its local neighborhood and not only on its own coordinates and the global feature.
Comparison with Q1 and Q2
Classification. The three Q1 failure cases. The Point Transformer fixes the vase (707) but still gets the flat chair (406) and the drum lamp (827) wrong. Their shapes really are closer to the other class. The six random objects from Q1 are classified correctly by both models.


Segmentation. The same six chairs as in Q2. The Point Transformer is better on the four normal chairs, especially the boxy armchair 134 (76.8% → 87.3%), where the boundaries between seat and arms are cleaner. It still fails on the two unusual chairs (351 and 235), where the problem is the unusual layout of the parts, not local detail.


Robustness. I also ran the Q3 experiments on the Point Transformer (2,048 points). The local attention makes segmentation much more robust to missing parts (86.9% vs 72.2% with 70% of the object removed), stretching (87.6% vs 68.1% at 2×) and a few outliers (89.7% vs 72.5% with 1% outliers). It is less robust to very few points (55.7% classification at 128 points), because then the 16 nearest neighbors cover much larger regions than during training.

