Assignment 2 for 16-825 (Single View to 3D)
Experimental setup
- Training. The training script reads the dataset from a pre-extracted, GPU-resident cache instead of parsing
.objfiles at every step (about 200× faster). - Evaluation. F1 uses 5000 points per shape (not the default 1000). The tables report F1 for every test chair over all 10 of its views and 3 point-sampling seeds (6780 images).
1.1 Fitting a voxel grid (4 points)
I define voxel_loss as binary cross-entropy on logits (binary_cross_entropy_with_logits); the optimized grid therefore stores logits, and sigmoid(logits) gives its occupancy. Adam optimizes a randomly initialized grid for 100k iterations, until the loss reaches zero.

1.2 Fitting a point cloud (3 points)
I implement chamfer_loss from scratch using only knn_points. The loss averages the squared distance from each source point to its nearest target point, averages the squared distance from each target point to its nearest source point, and sums the two terms. Adam optimizes 5000 points, initialized from a Gaussian, toward 5000 points sampled from the ground-truth chair mesh.

1.3 Fitting a mesh (3 points)
I define smoothness_loss as the uniform Laplacian smoothing loss (mesh_laplacian_smoothing). Adam deforms an ico_sphere(4) by minimizing the Chamfer loss between points sampled from the two meshes plus 0.1 × the Laplacian term.

2.1 Image to voxel grid (20 points)
Decoder. ResNet18 feature → linear layer → 256-channel 4³ grid → three upsampling blocks (transposed convolution + convolution) to 32³ → one logit per voxel. Loss. Binary cross-entropy on logits with occupied voxels weighted ×2 (pos_weight = 2). Occupied voxels make up only about 3% of a chair grid, and without the weight the predicted occupancy of thin legs falls below the 0.5 threshold (see 2.4). Training. 30k iterations, batch size 32, Adam, learning rate 4e-4 with cosine decay.


Test chairs 10, 250 and 500. Columns: input RGB, predicted voxel grid, ground-truth mesh.
F1@0.05 = 83.8 (± 0.3 across views and point-sampling seeds).
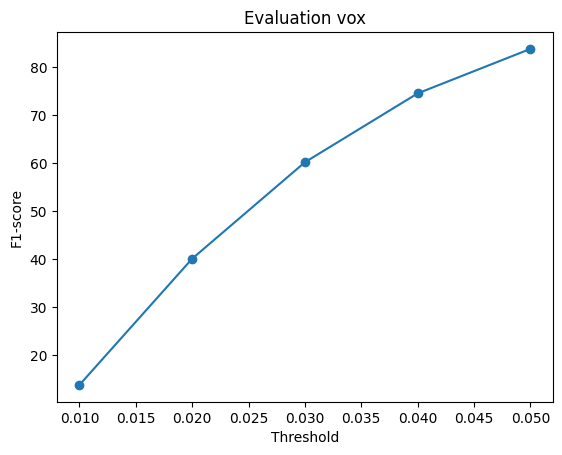
eval_vox.png: F1 score against distance threshold, produced by eval_model.py. Best and worst test chairs (ranked by F1@0.05):


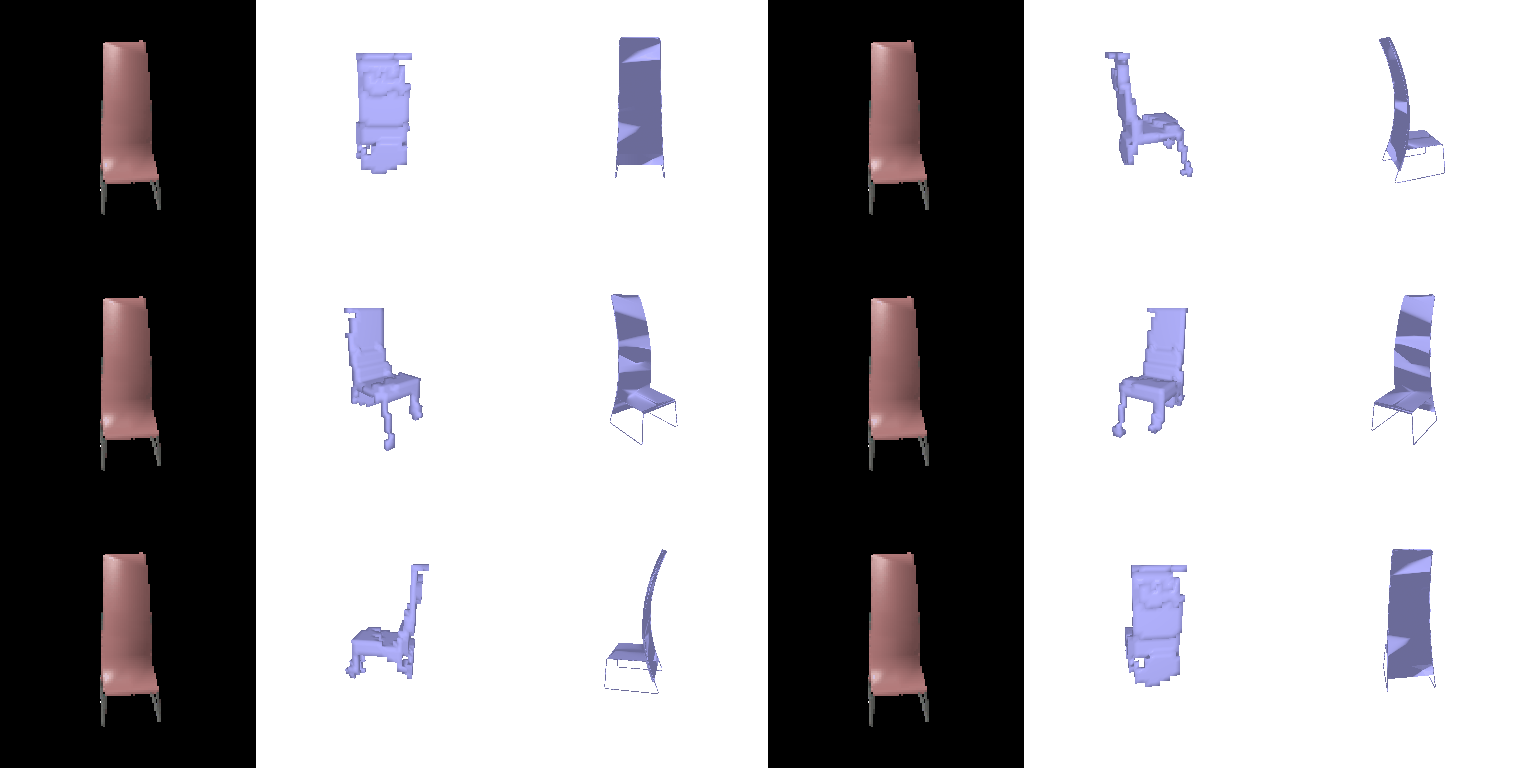
2.2 Image to point cloud (20 points)
Decoder. An MLP (512 → 1024 → 2048 → 5000 × 3) with LeakyReLU activations and a tanh output. Loss. Chamfer distance + 0.1 × a repulsion term, which penalizes predicted points that lie closer than 0.01 to any of their 4 nearest neighbours. With the Chamfer loss alone, about half of the 5000 points collapse into two clusters at the rear corners of the seat (see 2.4). Training. 15k iterations; I keep the checkpoint with the highest validation F1.
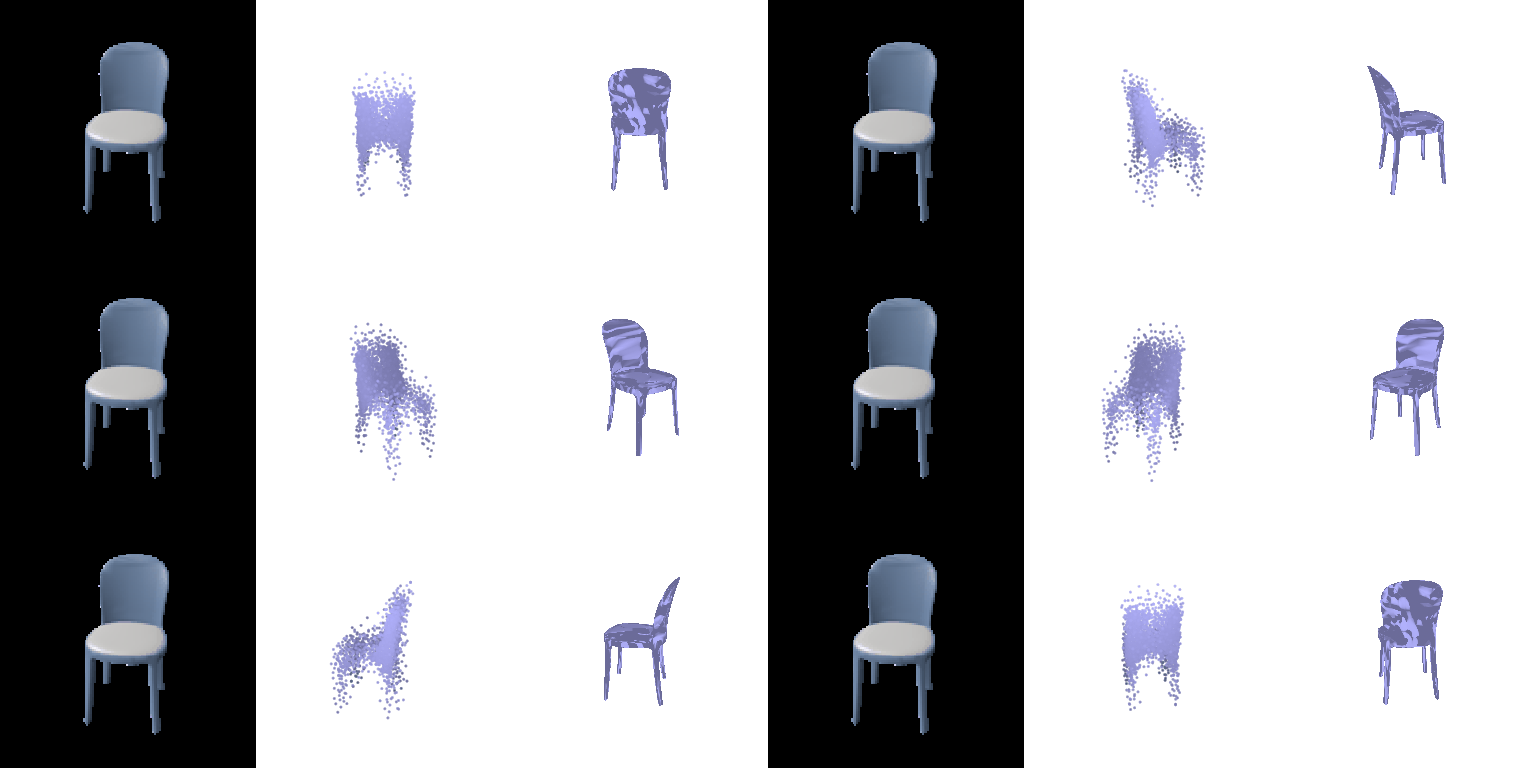
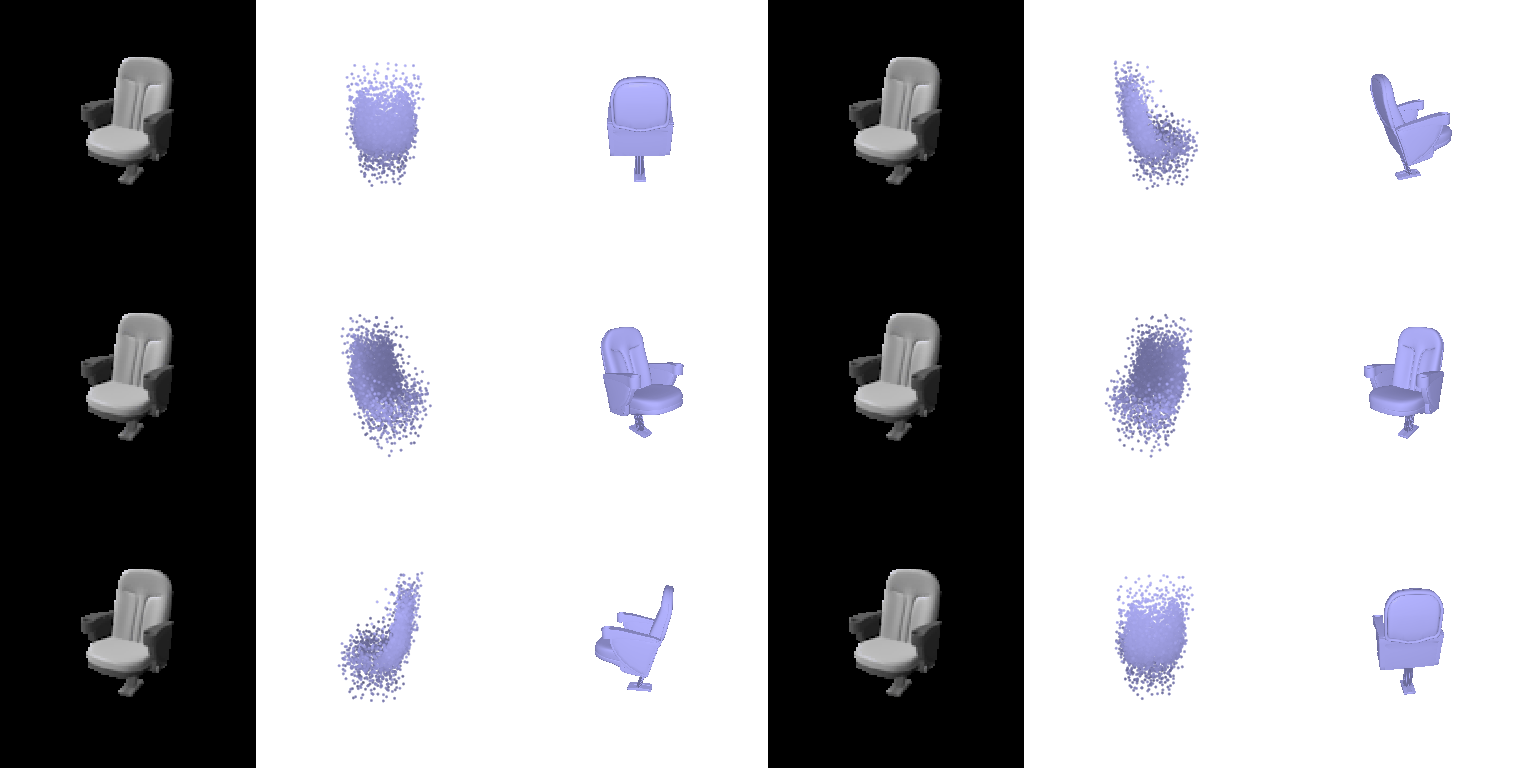
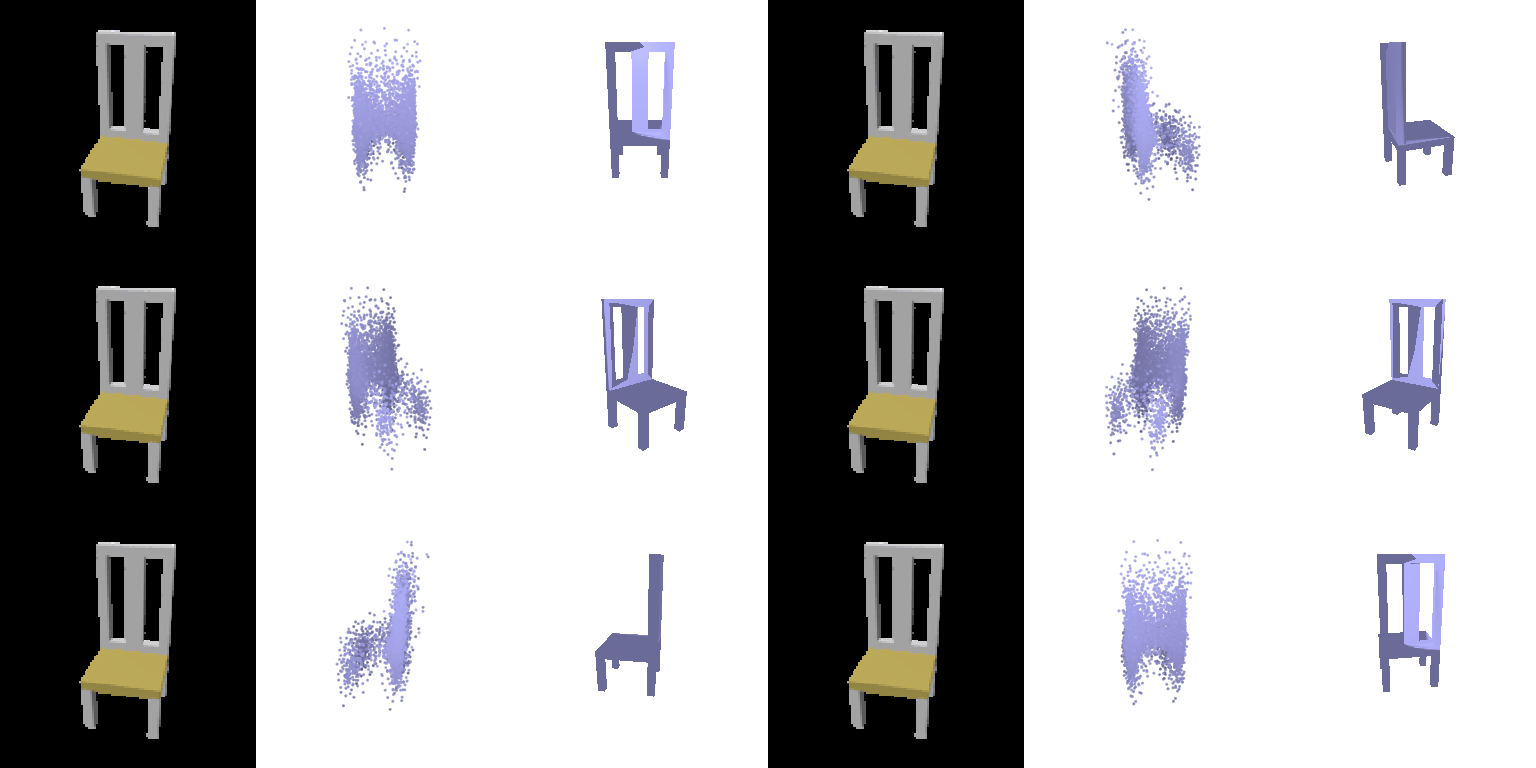
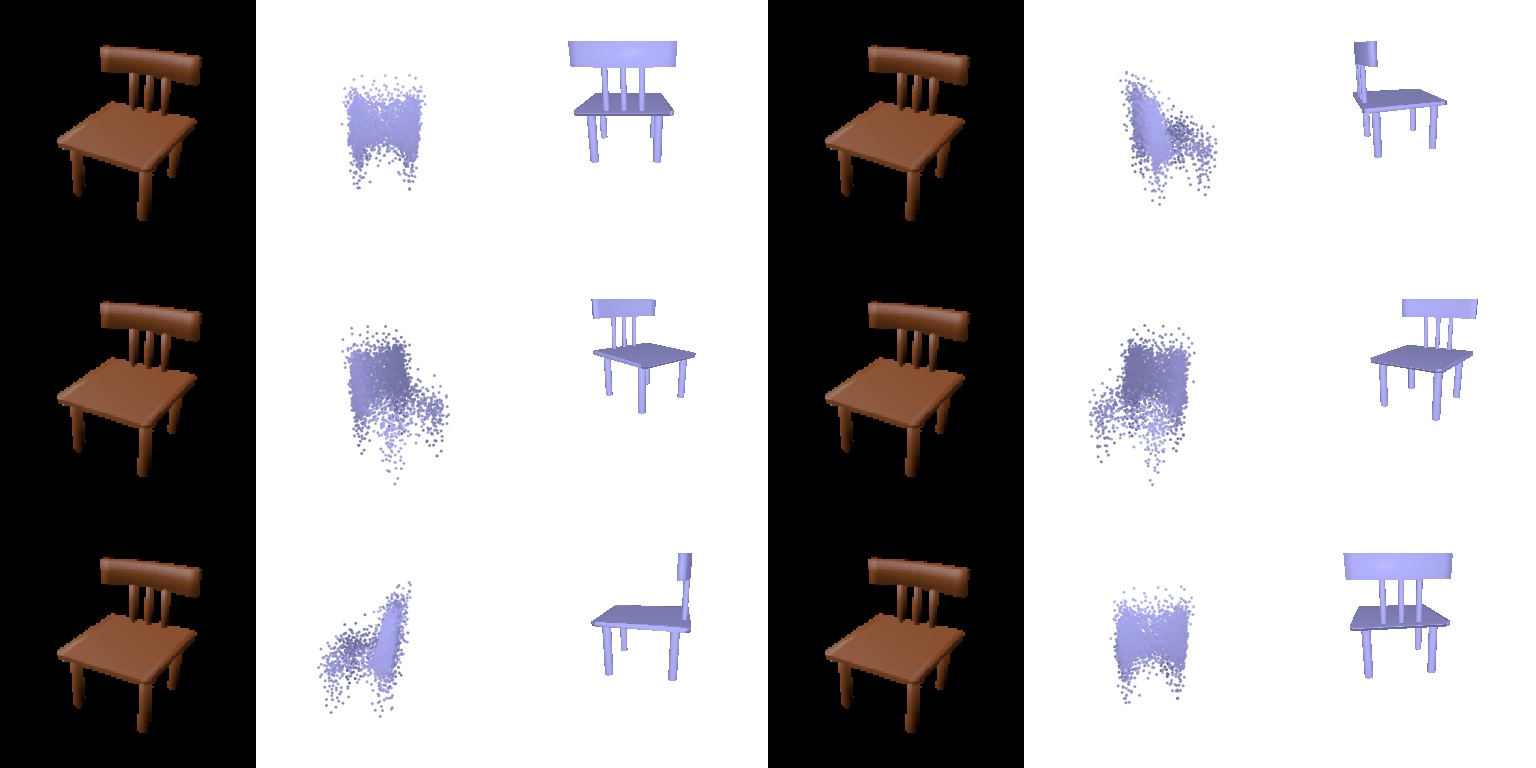
Test chairs 10, 250 and 500. Columns: input RGB, predicted point cloud, ground-truth mesh.
F1@0.05 = 86.2 (± 0.2 across views and point-sampling seeds).
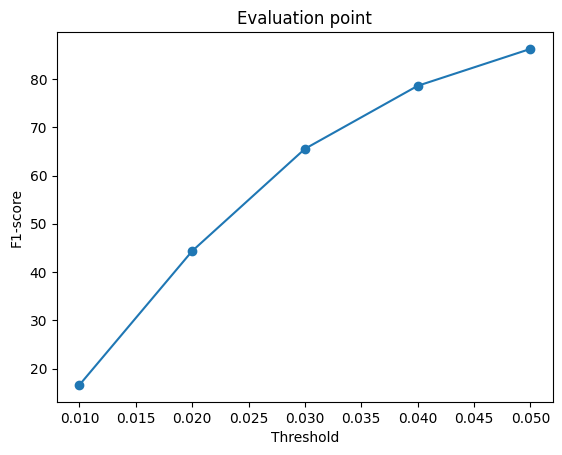
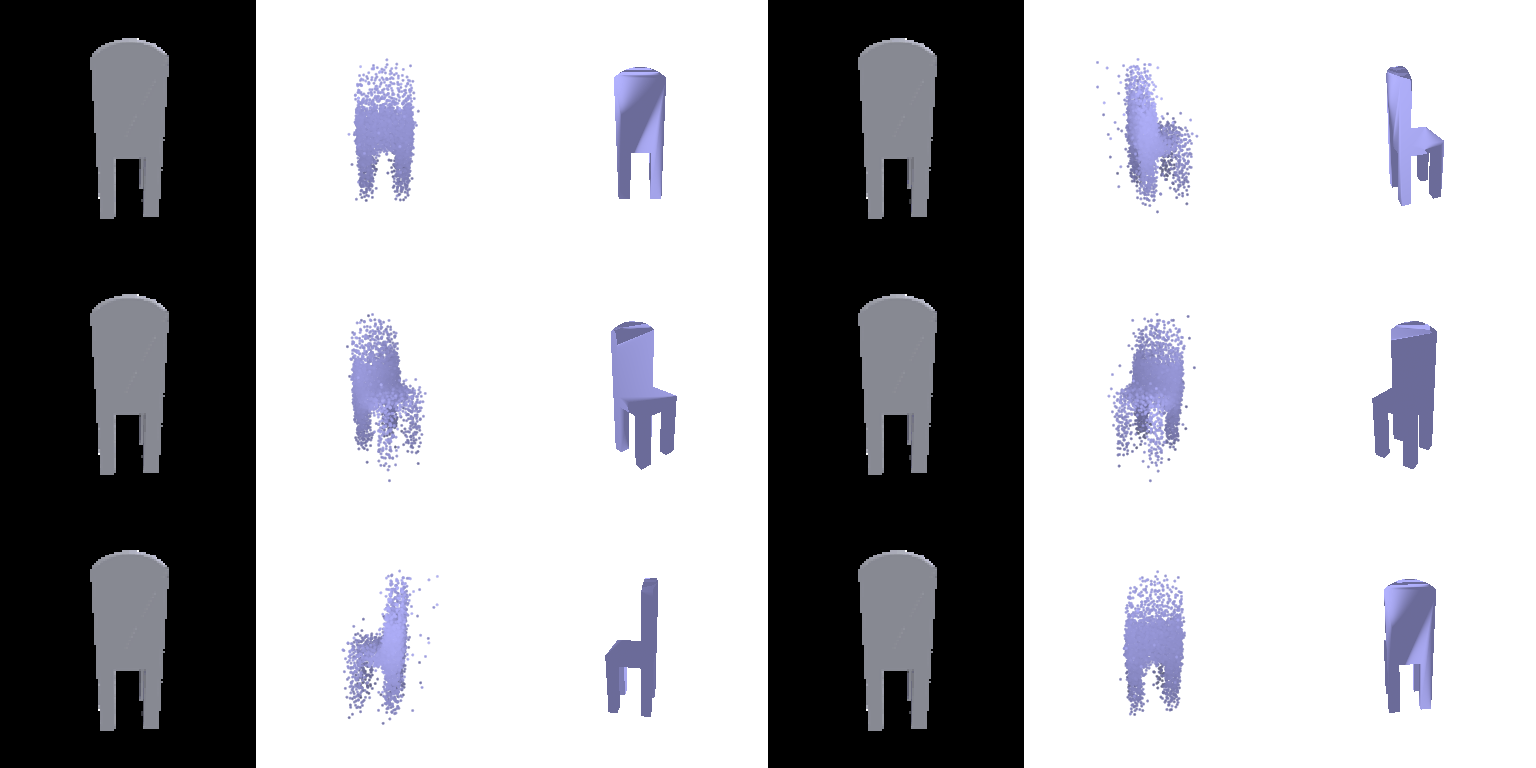
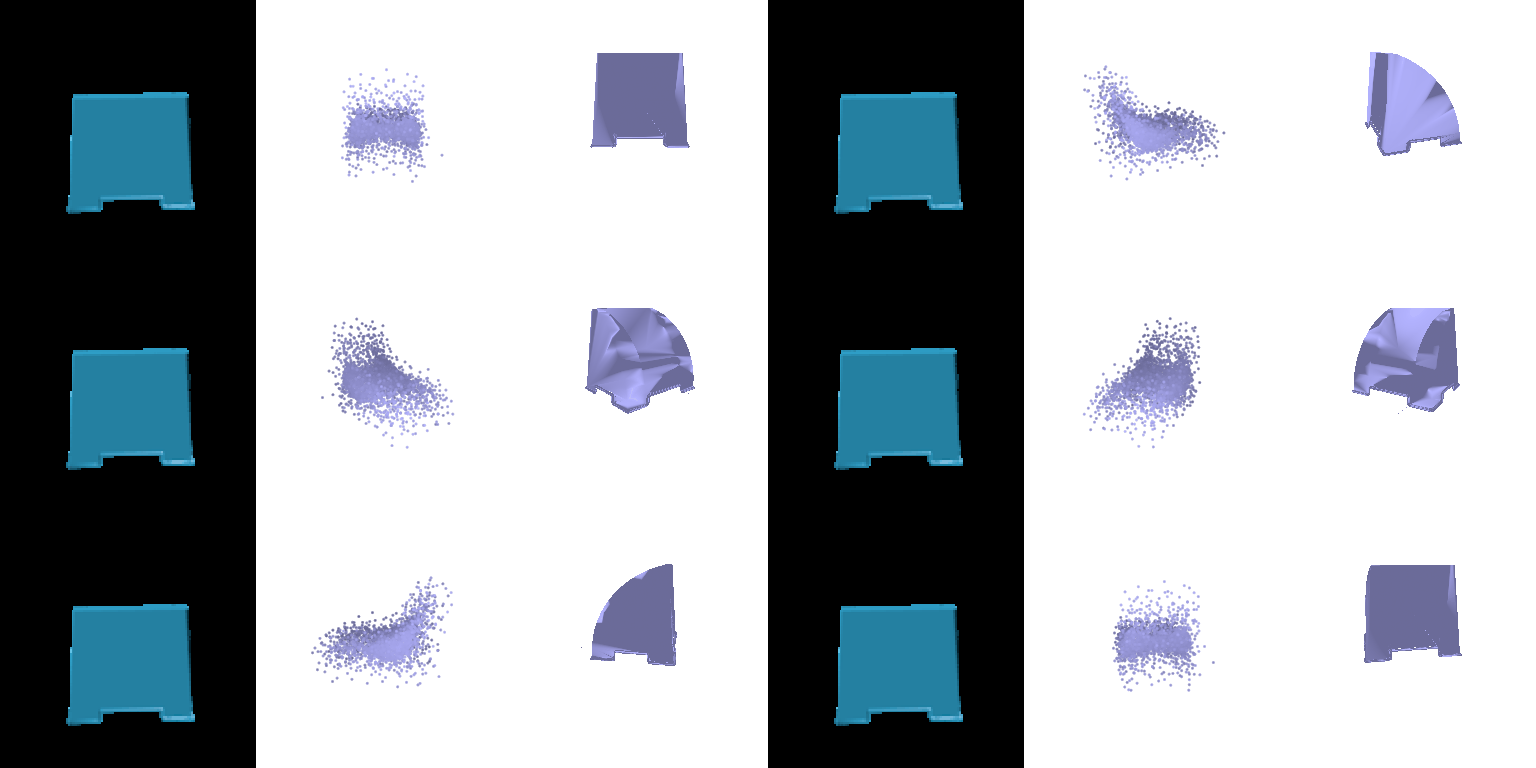
eval_point.png: F1 score against distance threshold, produced by eval_model.py. Best and worst test chairs (ranked by F1@0.05):

2.3 Image to mesh (20 points)
Decoder. An MLP (512 → 1024 → 2048 → 2562 × 3) predicts per-vertex offsets for an ico_sphere(4) template of radius 0.5; training starts from the undeformed template. Loss. Chamfer distance + 0.3 × Laplacian smoothing + 0.03 × normal consistency + 0.5 × edge length.
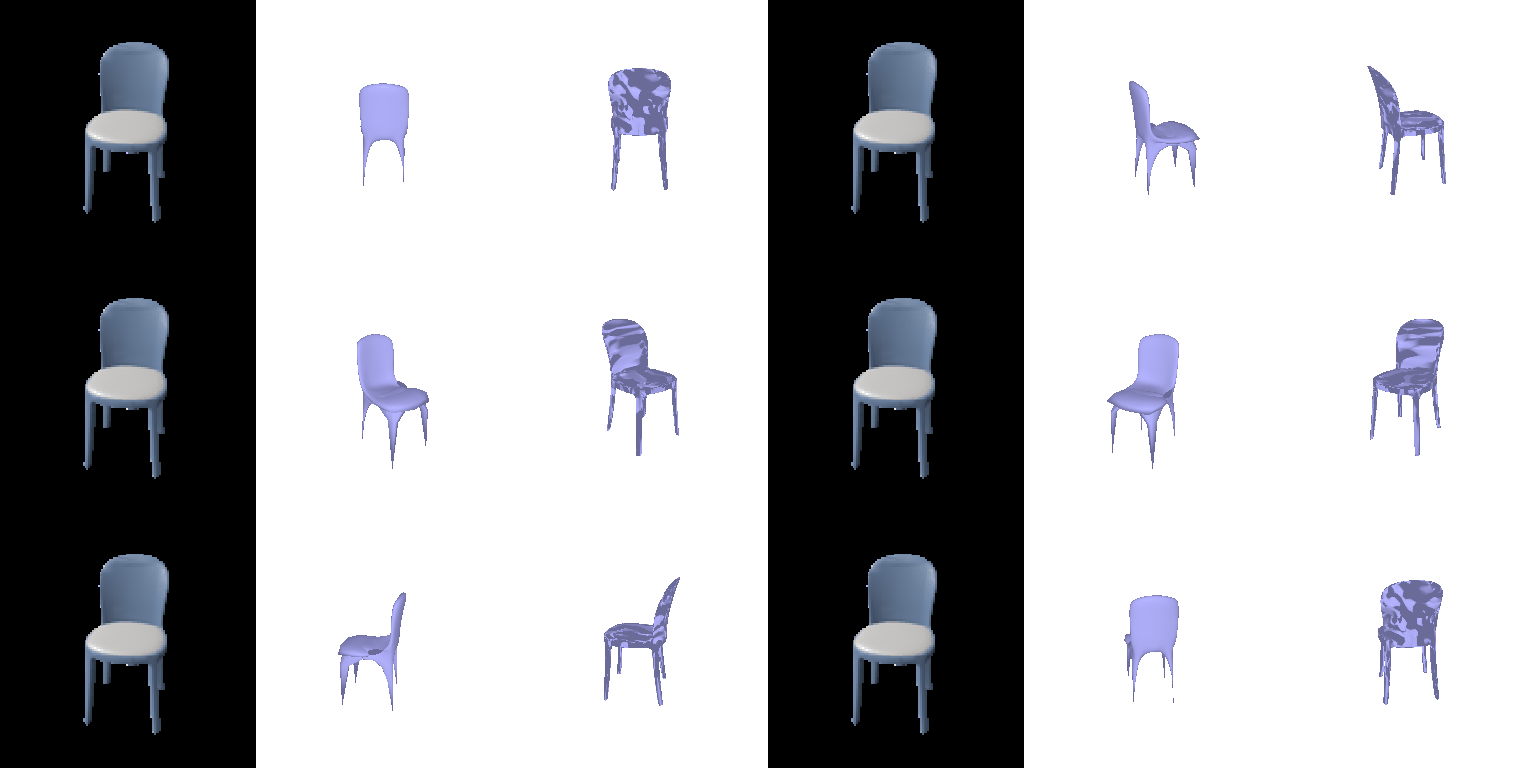
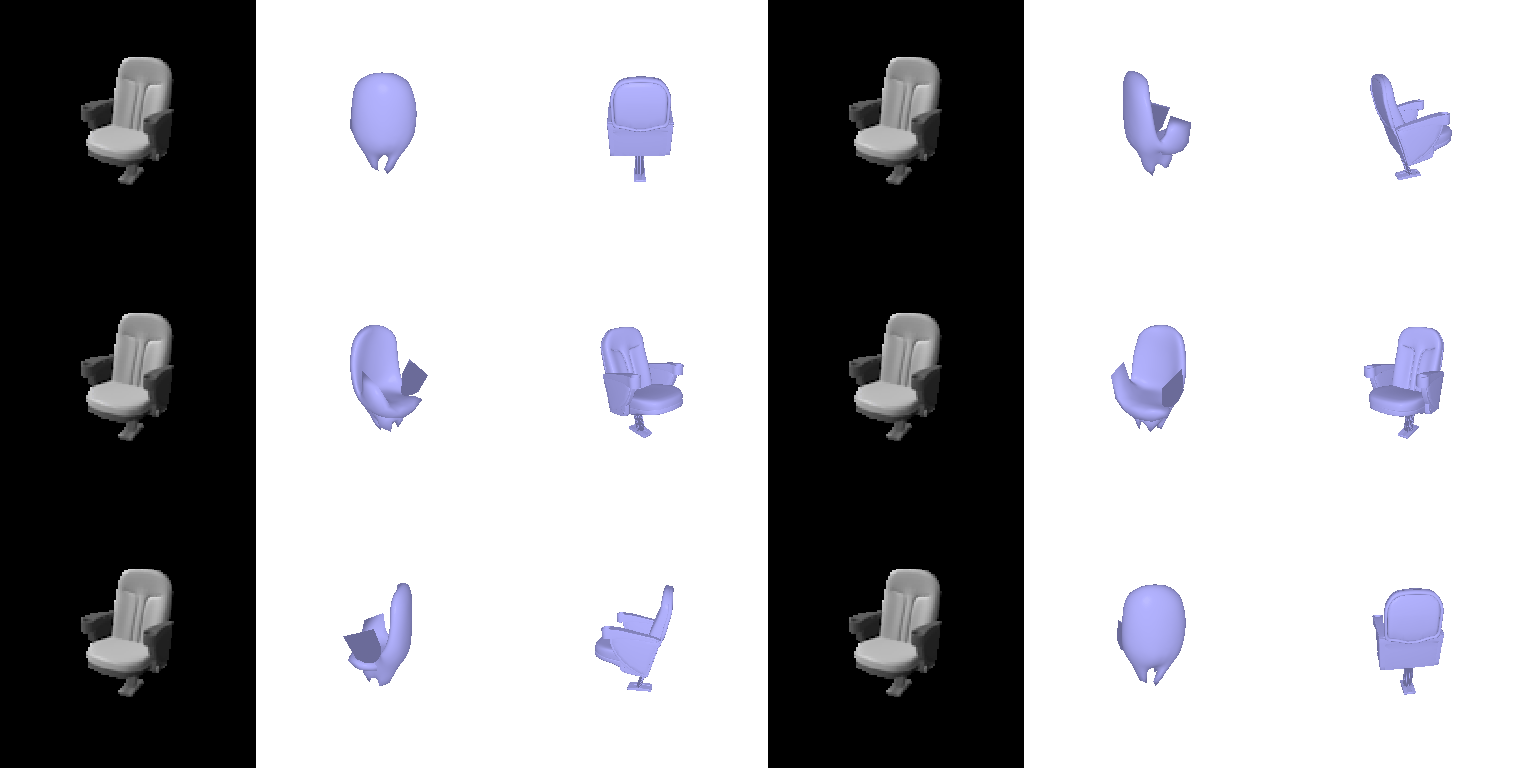

Test chairs 10, 250 and 500. Columns: input RGB, predicted mesh, ground-truth mesh.
F1@0.05 = 75.8 (± 0.4 across views and point-sampling seeds).
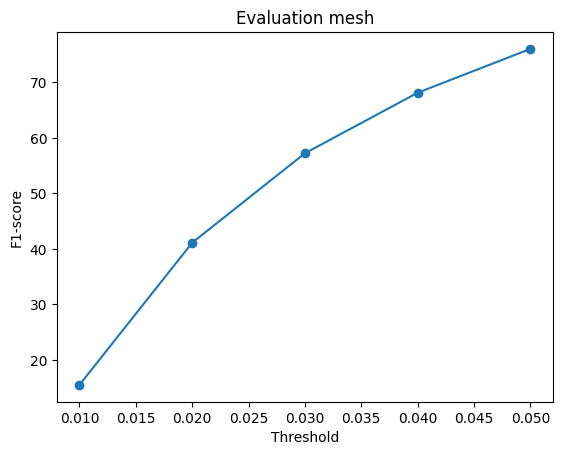
eval_mesh.png: F1 score against distance threshold, produced by eval_model.py. Best and worst test chairs (ranked by F1@0.05):


Comparing voxels, point clouds and meshes
| Representation | F1@0.01 | F1@0.02 | F1@0.03 | F1@0.04 | F1@0.05 | P@0.05 | R@0.05 | View std |
|---|---|---|---|---|---|---|---|---|
| Voxel grid | 13.7 ± 0.1 | 40.0 ± 0.3 | 60.3 ± 0.4 | 74.6 ± 0.4 | 83.8 ± 0.3 | 81.0 | 87.7 | 5.5 |
| Point cloud | 16.7 ± 0.1 | 44.5 ± 0.2 | 65.7 ± 0.3 | 78.7 ± 0.3 | 86.2 ± 0.2 | 82.3 | 91.8 | 5.0 |
| Mesh | 15.5 ± 0.2 | 40.9 ± 0.3 | 56.9 ± 0.3 | 67.8 ± 0.4 | 75.8 ± 0.4 | 75.2 | 77.0 | 9.0 |
Test set: 678 chairs × 10 views × 3 point-sampling seeds; values in %. P and R denote precision and recall. View std is the standard deviation of one chair’s F1@0.05 across its 10 input views, averaged over chairs.

Point clouds achieve the highest F1@0.05 (86.2). The decoder regresses the coordinates of each point without any constraint on topology or resolution, and its Chamfer loss measures the same nearest-neighbour distances that the F1 score thresholds. This flexibility also produces the highest recall (91.8): the predicted points cover every part of the chair.
Voxels follow closely at the 0.05 threshold (83.8) but score lowest at the 0.01 threshold (13.7). Each cell of the 32³ grid is about 0.031 wide, so the grid localizes the surface only to within about half a cell. This quantization error is small relative to 0.05 but exceeds 0.01.
Meshes achieve the lowest F1@0.05 (75.8) and the lowest precision (75.2). The decoder deforms a sphere template, and deformation preserves the topology of the template (genus 0, no holes). The mesh therefore cannot open the gaps in a backrest or between the legs; it spans them with spurious surfaces that lie far from the ground truth. The regularization terms that keep the surface smooth cost a further 2.6 F1 (78.5 without them; see 2.4). Meshes are also the most sensitive to viewpoint: the F1 of one chair varies by about 9 points across its views, against about 5 for voxels and point clouds.
2.4 Effect of hyper-parameters (10 points)
For each representation, I vary the loss weight that most affects its output. Each figure shows the same three test chairs reconstructed by every model in the sweep, with the test F1 of each model below its column. The code folder lists every run and its settings in ablation_runs.md.
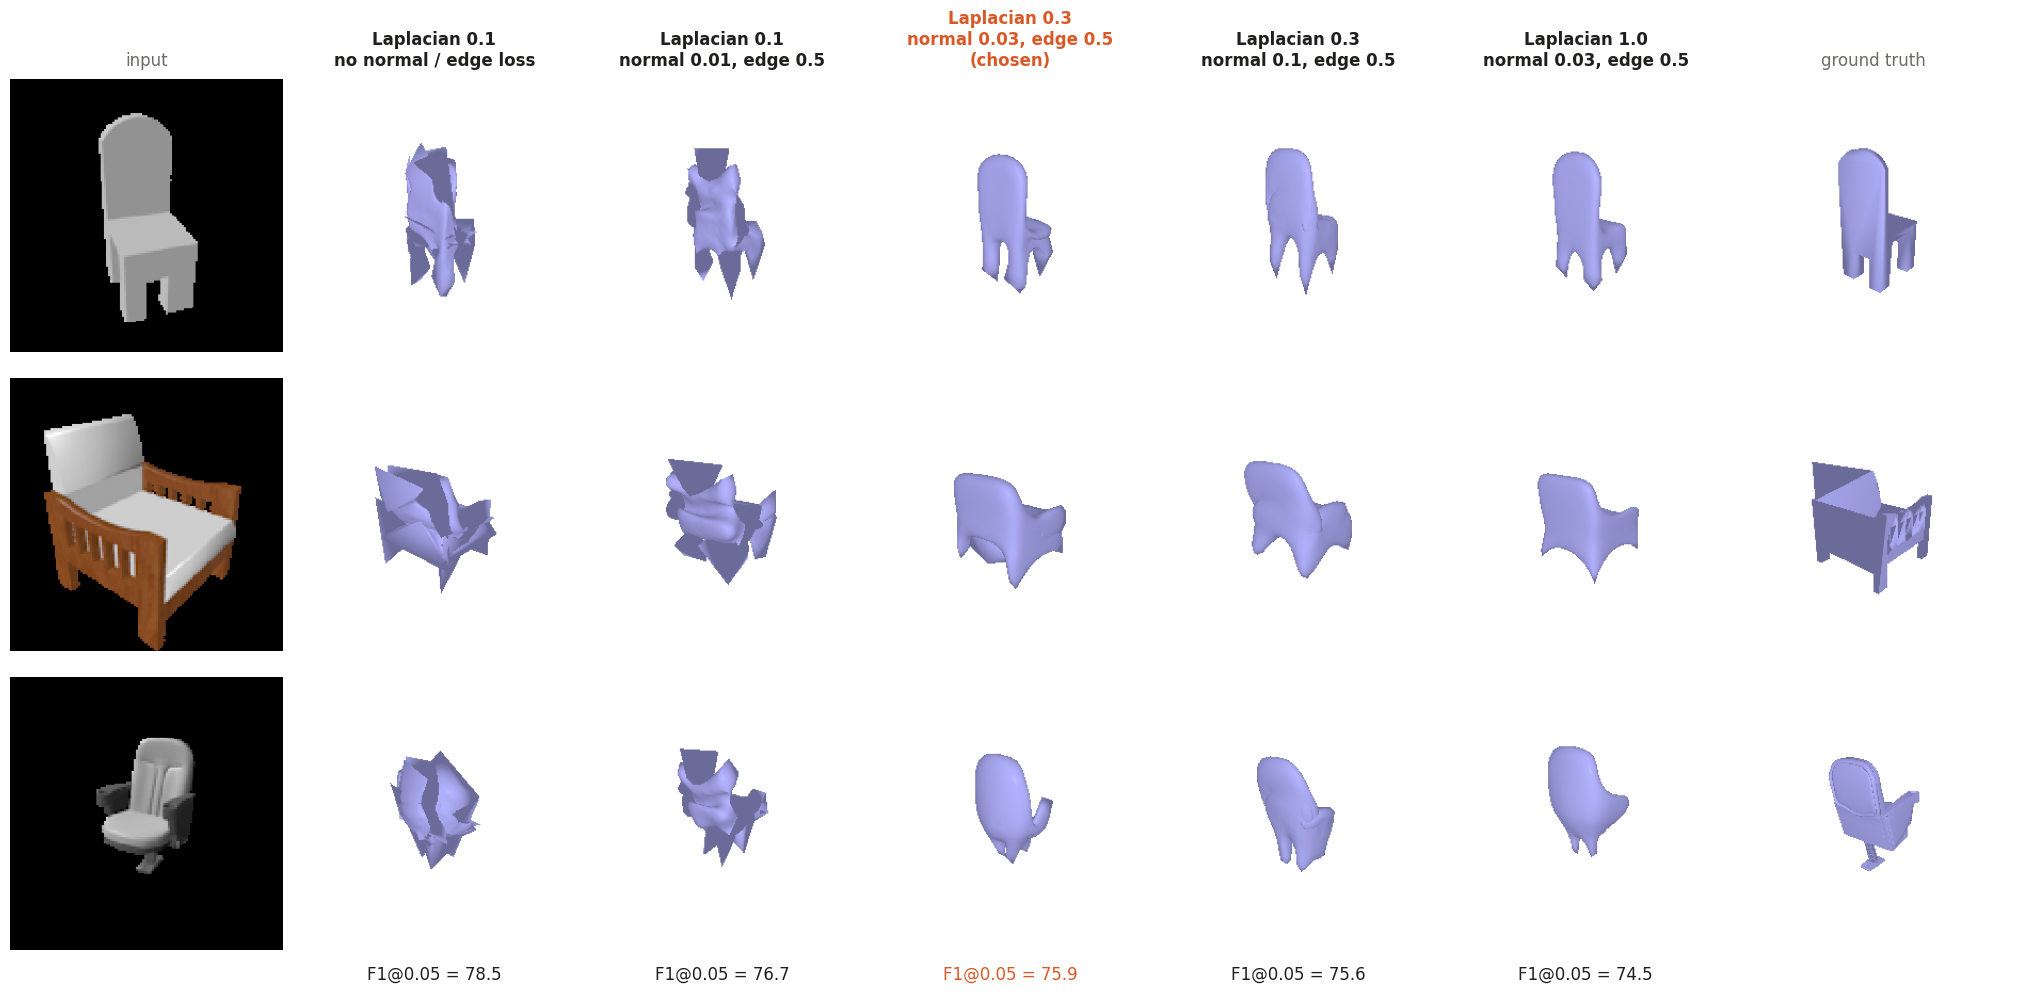
Mesh regularization trades F1 for surface quality. With Laplacian smoothing alone at weight 0.1, the model reaches the highest F1@0.05 (78.5) but produces non-smooth, self-intersecting surfaces: the weighted Laplacian term is about one tenth of the Chamfer term, so it barely constrains the vertices. Adding a normal-consistency term, which penalizes adjacent faces whose normals disagree, and an edge-length term yields smooth chair surfaces. Larger weights reduce F1 further; at a Laplacian weight of 1.0 (F1 74.5) the legs begin to merge. I select the intermediate setting (0.3 / 0.03 / 0.5; F1 75.9), the smallest weights that yield smooth surfaces.
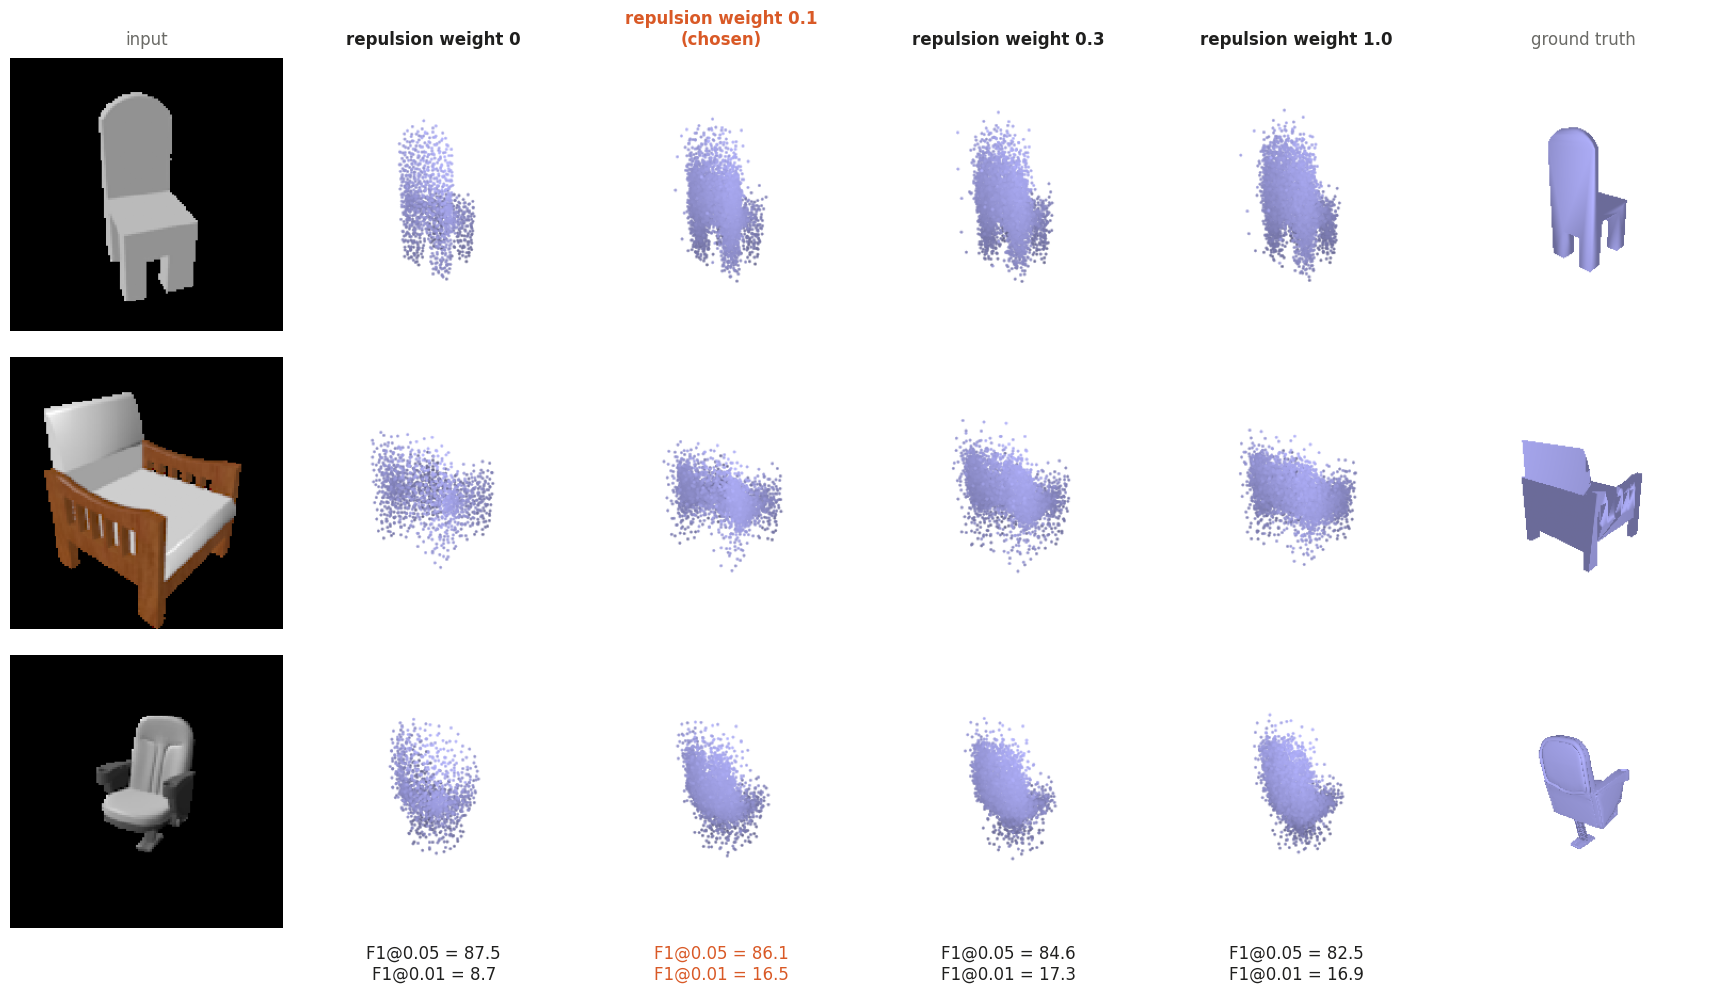
The repulsion term trades a small amount of F1@0.05 for a more uniform point distribution. Without repulsion the model reaches the highest F1@0.05 (87.5), but about half of its points collapse into two clusters, so F1@0.01 is only 8.7. The Chamfer loss does not penalize duplicate points; the repulsion term separates them and roughly doubles F1@0.01 (16.5 to 17.3). Larger weights push points off thin structures, so F1@0.05 decreases from 86.1 at weight 0.1 to 82.5 at weight 1.0. I select weight 0.1, which costs only 1.4 F1@0.05.

pos_weight = 2) recovers legs and armrests; training for 30k instead of 15k iterations sharpens them. Weighting occupied voxels recovers thin structures. About 97% of the voxels are empty, so plain binary cross-entropy (pos_weight = 1) favours predicting empty space. The predicted occupancy of thin structures (legs, armrests) then falls below the 0.5 threshold, and they disappear from the reconstruction (F1 79.4). Weighting occupied voxels ×2 restores them (F1 82.2), and doubling the training length to 30k iterations raises F1 to 84.1.
2.5 Interpreting the model (10 points)
Does the network reconstruct or retrieve?
Single-view reconstruction networks often perform recognition and retrieval rather than reconstruction: they recognize the input and output a shape close to one in the training set (Tatarchenko et al., What Do Single-view 3D Reconstruction Networks Learn?, CVPR 2019). I test my models for this behaviour with two nearest-neighbour experiments over the 6100 training chairs, using Chamfer distance.
- Oracle retrieval baseline. For each test chair, I retrieve the training chair nearest to the ground-truth shape and score it as if it were the prediction.
- Nearest neighbour of the prediction. For each point-cloud prediction, I retrieve the training chair nearest to the predicted shape.

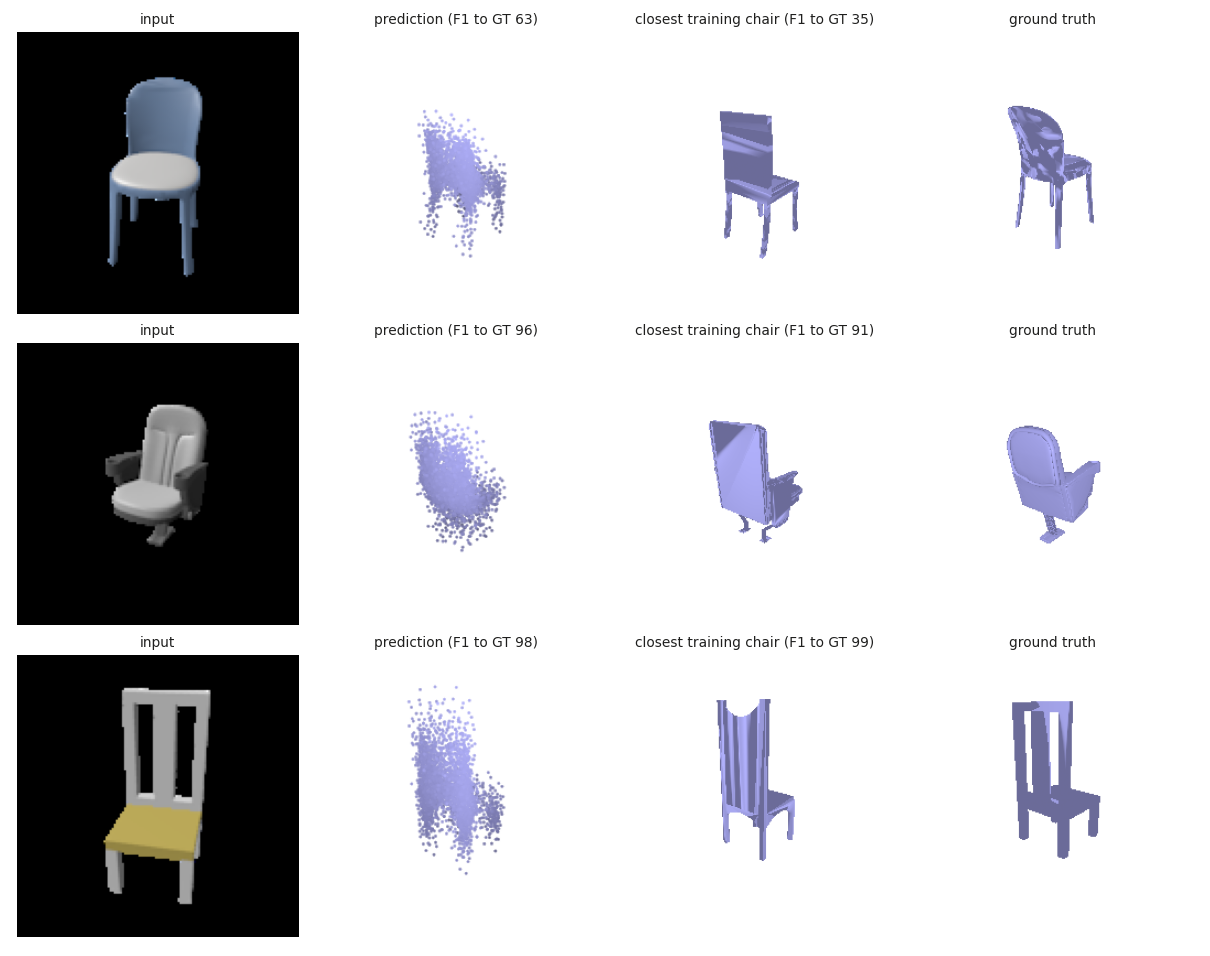
- Oracle retrieval outperforms every network. The oracle reaches F1@0.05 = 93.6, against 84.1 (voxels), 86.0 (point clouds) and 75.9 (meshes); the networks exceed it on only 13%, 22% and 7% of the test chairs. The training set of 6100 chairs almost always contains a shape close to the test shape.
- The predictions resemble training shapes. The point-cloud predictions match their nearest training chairs with a mean F1 of 96.9, and 93% of them match that training chair better than their own ground truth.
- The network does not copy a single training chair. The training chair nearest to the prediction scores F1 69.8 against the ground truth, below the 86.0 of the prediction itself. The network therefore outputs an averaged shape with the correct overall proportions but without instance-specific details.
Which image regions does the network use?
I measure occlusion sensitivity (Zeiler and Fergus, ECCV 2014): a black 24 × 24 patch slides over the input image with a stride of 8 pixels, and I record how much each 3D prediction changes (change in occupancy probability for voxels, Chamfer distance for point clouds and meshes). Bright regions mark the image regions on which the reconstruction depends.

All three models ignore the background and depend only on the object. The voxel model depends on a broad region covering the seat and the centre of the backrest. The point-cloud and mesh models respond most to individual legs: occluding one front leg changes their prediction more than occluding most of the backrest. A plausible explanation is that the leg configuration varies most across chairs and therefore discriminates best between shapes.
How does the prediction vary with viewpoint?

The voxel prediction depends on the input view; the point-cloud and mesh predictions barely change. For this cantilever chair, the voxel model recovers the tubular base from some views and loses parts of it from others (F1 65 to 93). The point-cloud and mesh models output nearly the same shape for every view, which agrees with the retrieval behaviour above. The mesh model cannot form the closed loop of the base, because its sphere template has no holes.
Where do the errors occur?
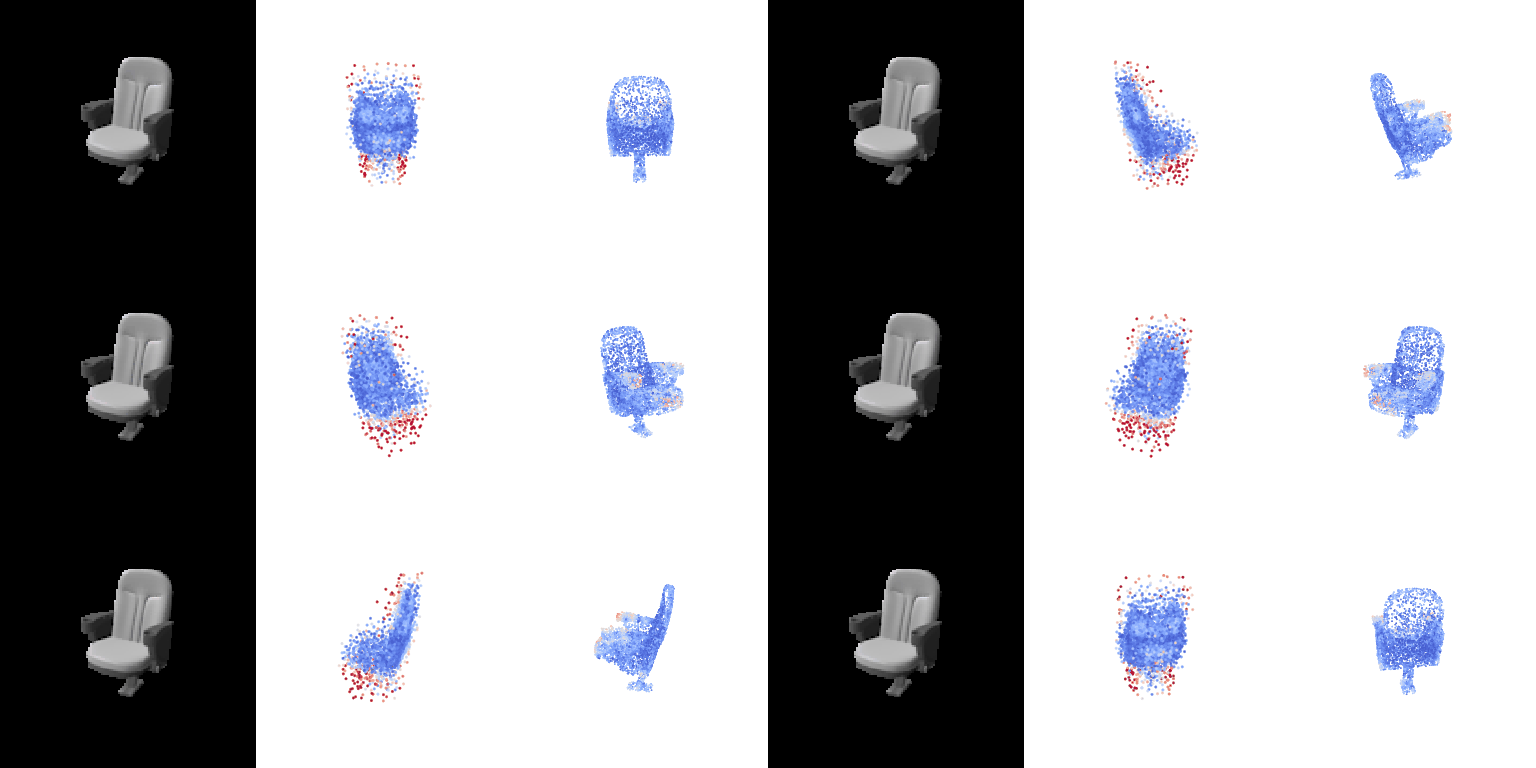
Error map for test chair 250. Middle: predicted points coloured by their distance to the ground-truth surface (blue = 0, red ≥ 0.1). Right: ground-truth points coloured by their distance to the prediction (red marks missed regions).
The errors are false-positive points, not missed regions. The predicted points with large error lie at the extremities of the shape, below the seat and around the outline of the backrest. The ground-truth points are almost entirely blue, so the prediction covers the whole surface.
3.1 Implicit network (10 points)
Network. I implement an occupancy network f(image, xyz) → logit and query it at the 32³ points of a regular grid over (−1, 1)³ to obtain the full occupancy volume. The volume shares the layout of the voxel targets, so the loss (binary cross-entropy with pos_weight = 2), evaluation and rendering of 2.1 apply unchanged.
- Positional encoding. Fourier features (sine and cosine at 6 frequencies) encode xyz, which lets the MLP represent sharp occupancy boundaries.
- Conditioning. Five residual MLP blocks (256 units) process each query point. The global image feature conditions the input projection and every block through feature-wise linear modulation (FiLM); the network computes this conditioning once per image and broadcasts it over all 32,768 query points.
- Local image features. After blocks 2 and 4, each query point attends to the 5 × 5 ResNet18 layer-4 feature map through 4-head cross-attention; the network uses no camera pose.
- Training. 30k iterations with bfloat16 mixed precision.
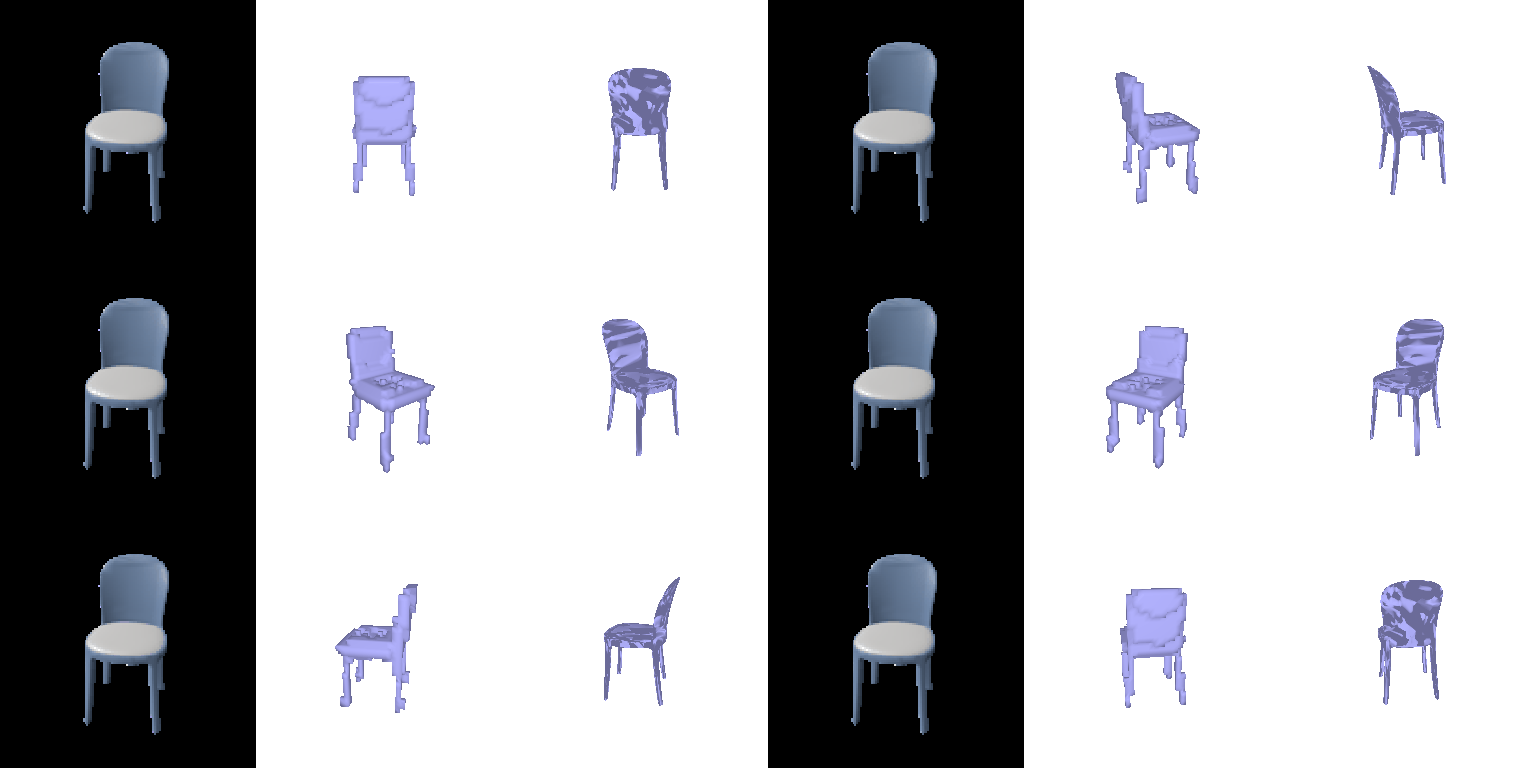
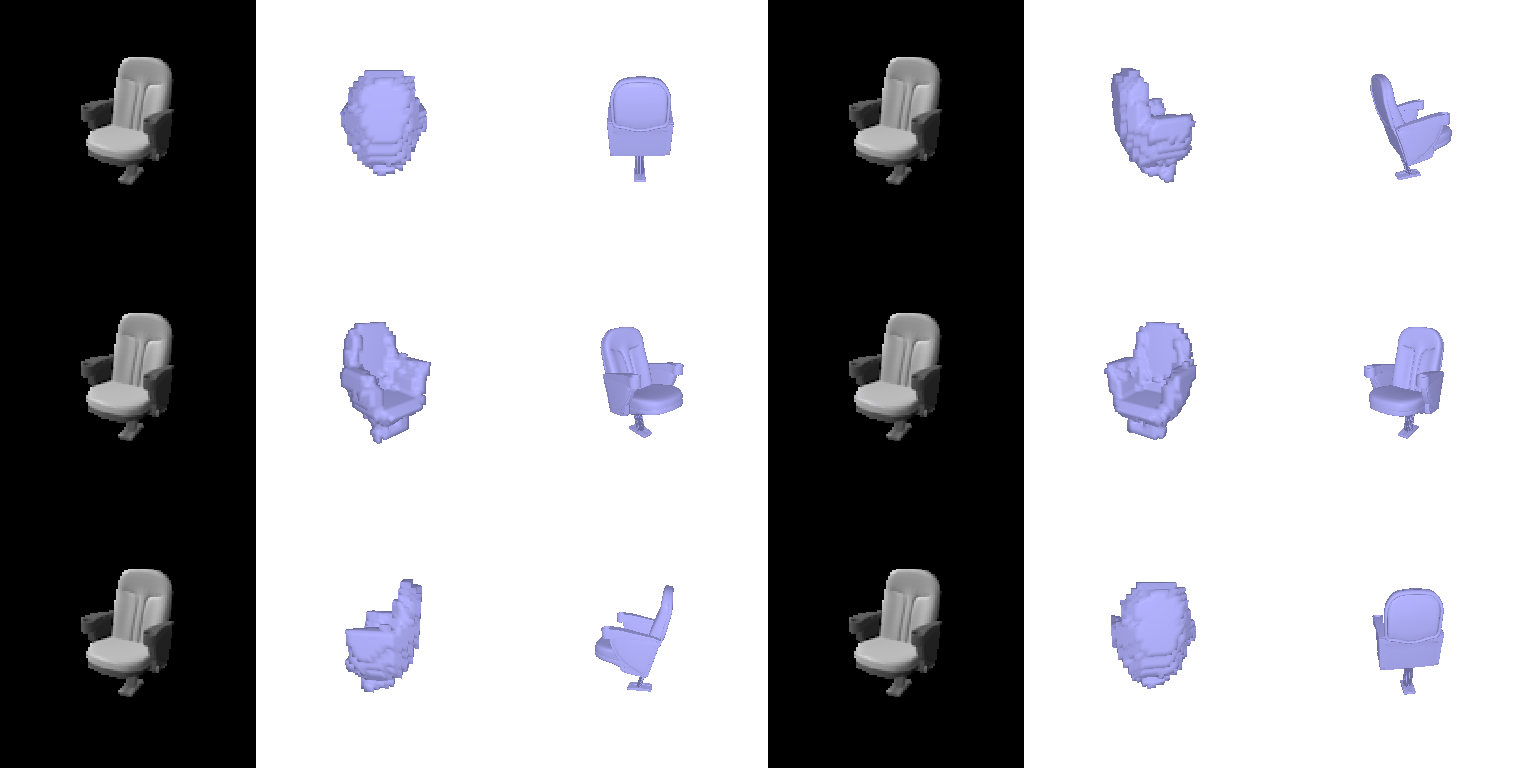
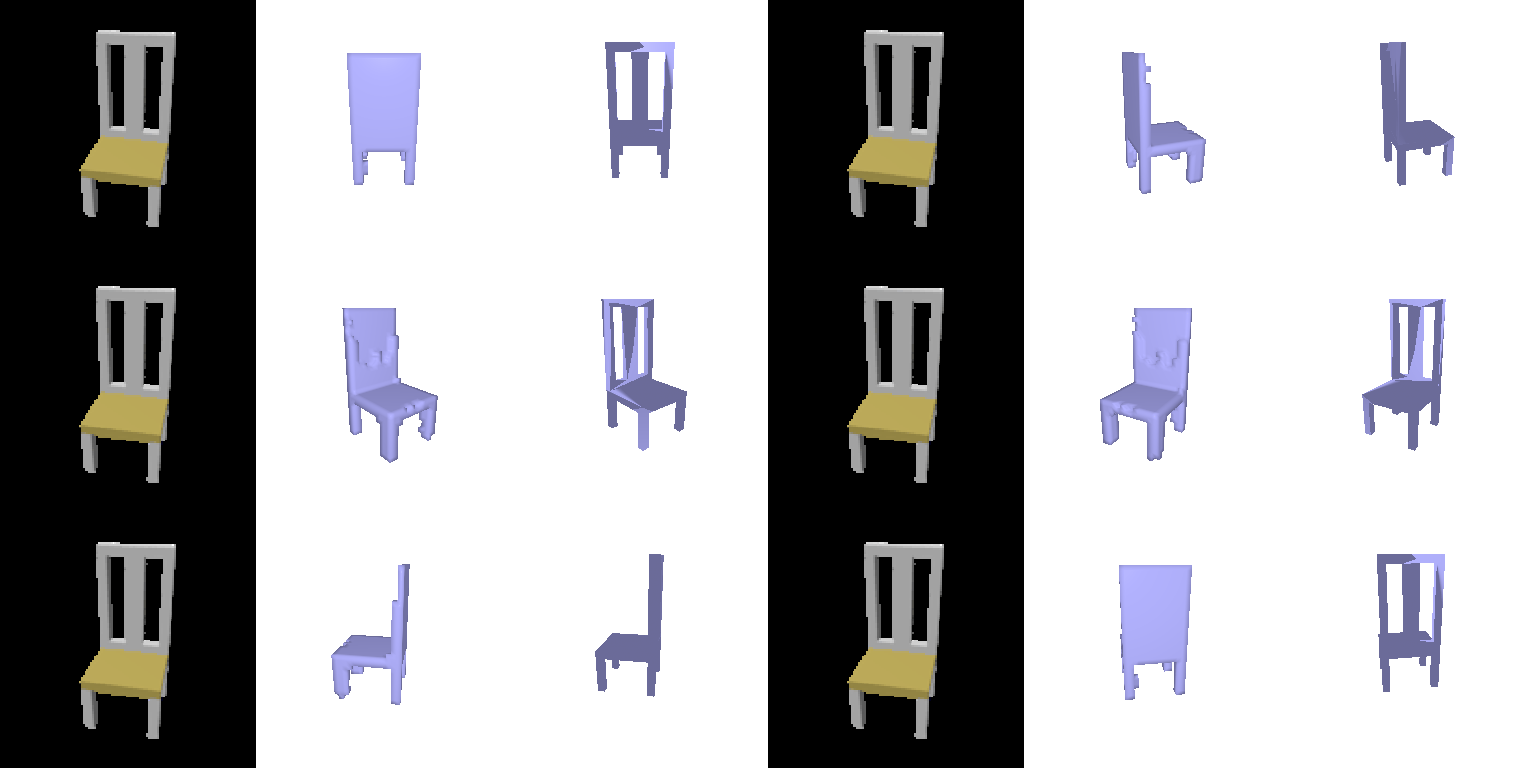
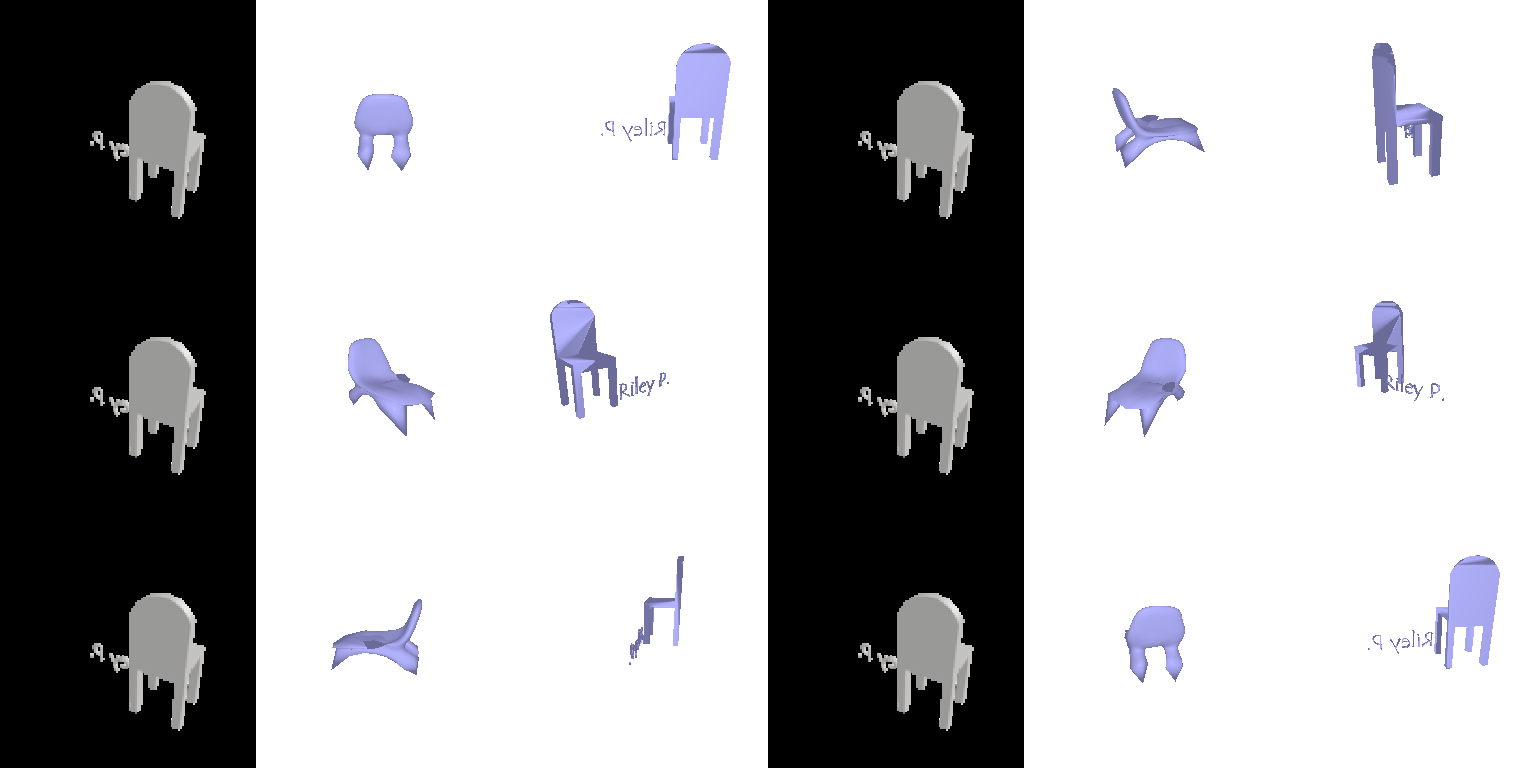
Test chairs 10, 250 and 500. Columns: input RGB, predicted occupancy (voxels with p > 0.5), ground-truth mesh.
The implicit network reaches F1@0.05 = 84.8 ± 0.2, 1.0 above the voxel decoder of 2.1 (83.8) under the same loss and evaluation. Its F1@0.01 is 14.0, its precision 82.9 and its recall 88.0. Precision accounts for most of the gain (82.9 against 81.0): the predictions contain fewer floating artifacts. On the three chairs of 2.1, the implicit network reconstructs a complete backrest for chair 10 and resolves the armrest of chair 250. Its limitation is over-smoothing of fine structure: the slatted backrest of chair 500 becomes a solid panel.
A likely explanation. The voxel decoder upsamples a coarse 4³ feature grid into all 32,768 voxels, so shared convolution kernels couple neighbouring regions. The implicit network evaluates one image-conditioned function independently at each query point, and the positional encoding lets that function change sharply at the surface.
3.2 Parametric network (10 points)
Network. I implement a multi-patch parametric decoder in the style of AtlasNet: f(image, patch k, uv) → xyz. Ten learned patch embeddings each select one deformed unit square, and Fourier features (4 frequencies) encode uv. A 4-block residual MLP maps each sample to a 3D point, conditioned on the global image feature through FiLM in every block. After the second block, each sample also attends to the 5 × 5 ResNet18 layer-4 feature map, which supplies local image features in addition to the global feature; the network uses no camera pose. Training samples uv uniformly at every iteration; evaluation uses a fixed, low-discrepancy (scrambled Sobol) set of 500 samples per patch. The loss and schedule match 2.2.
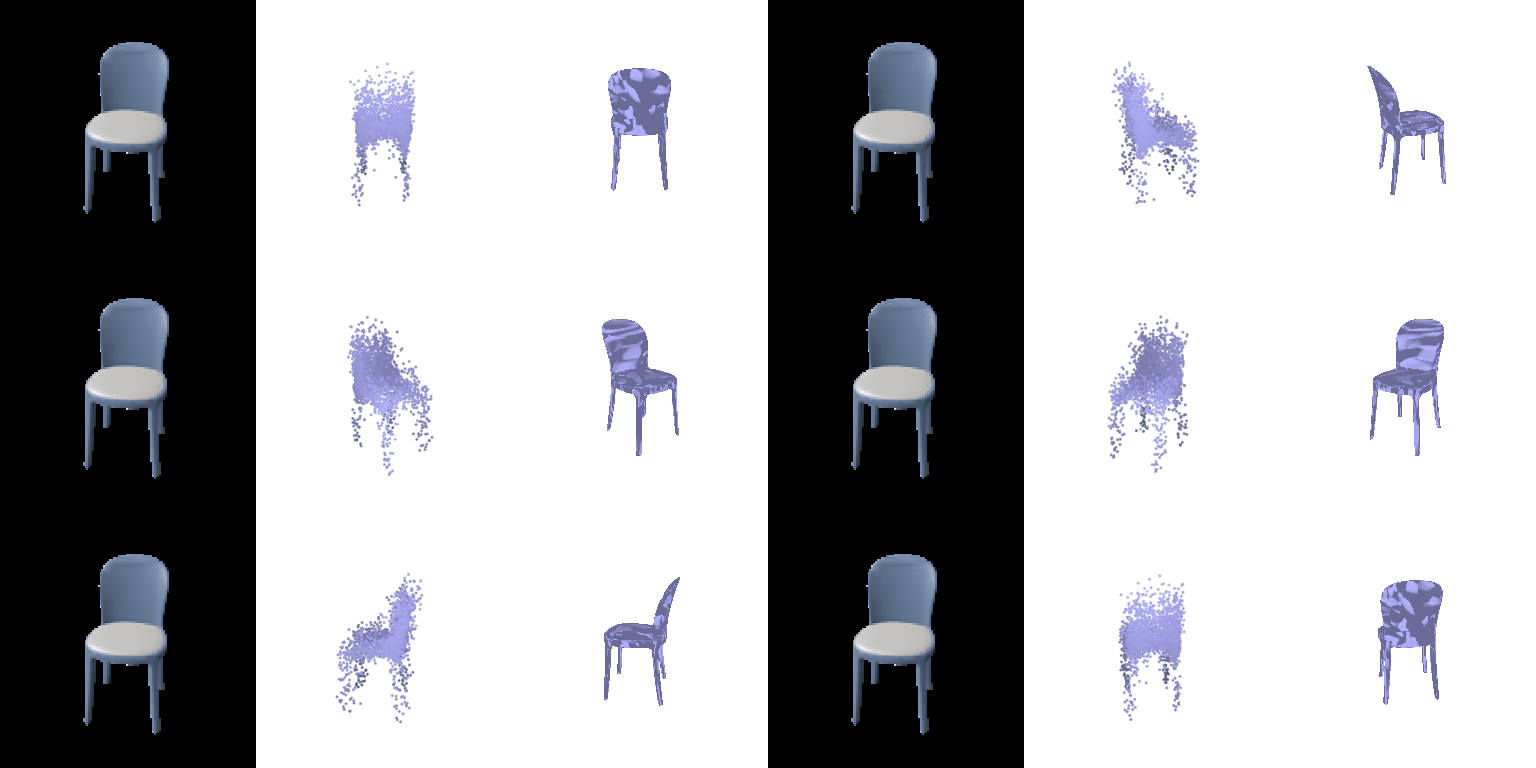
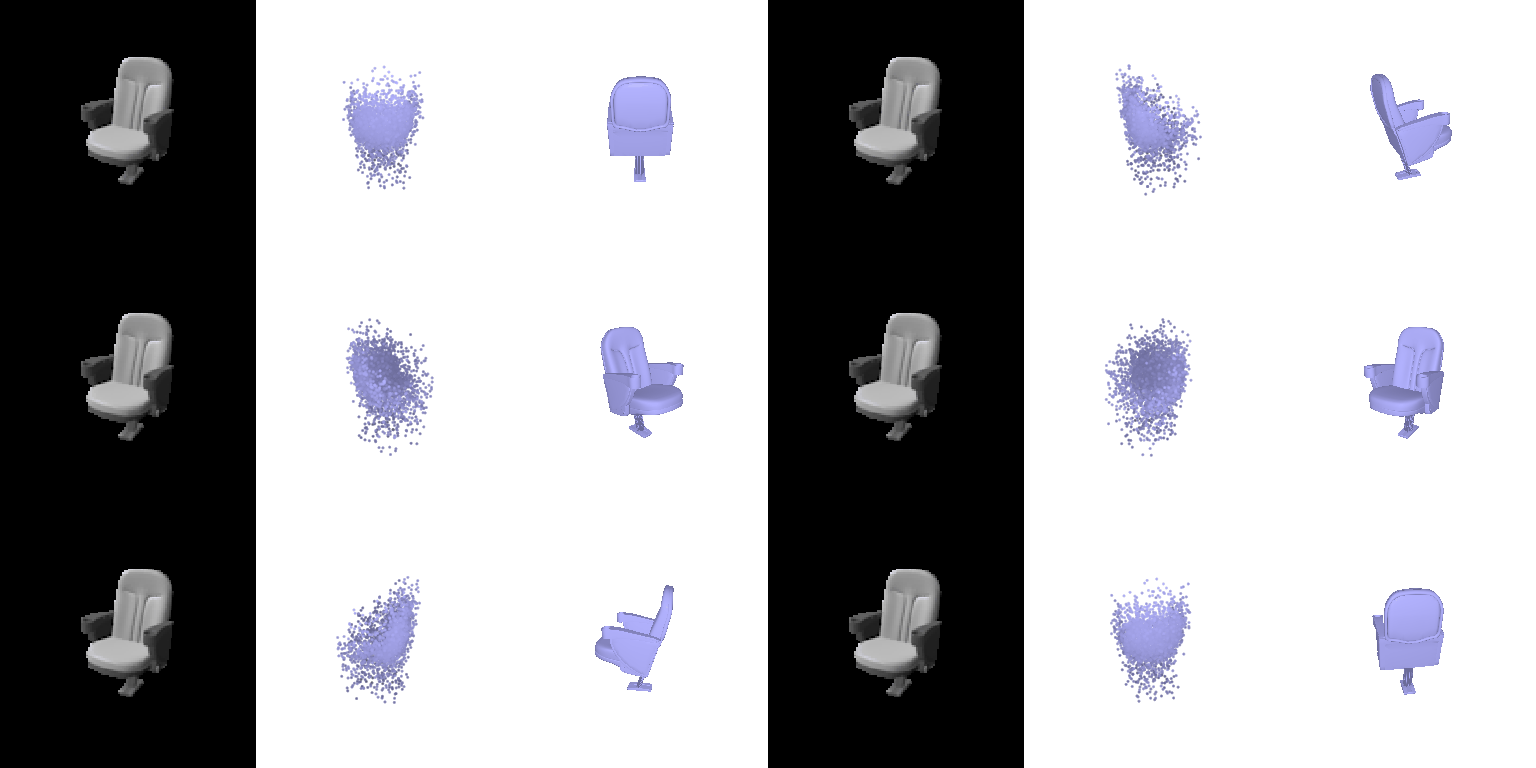
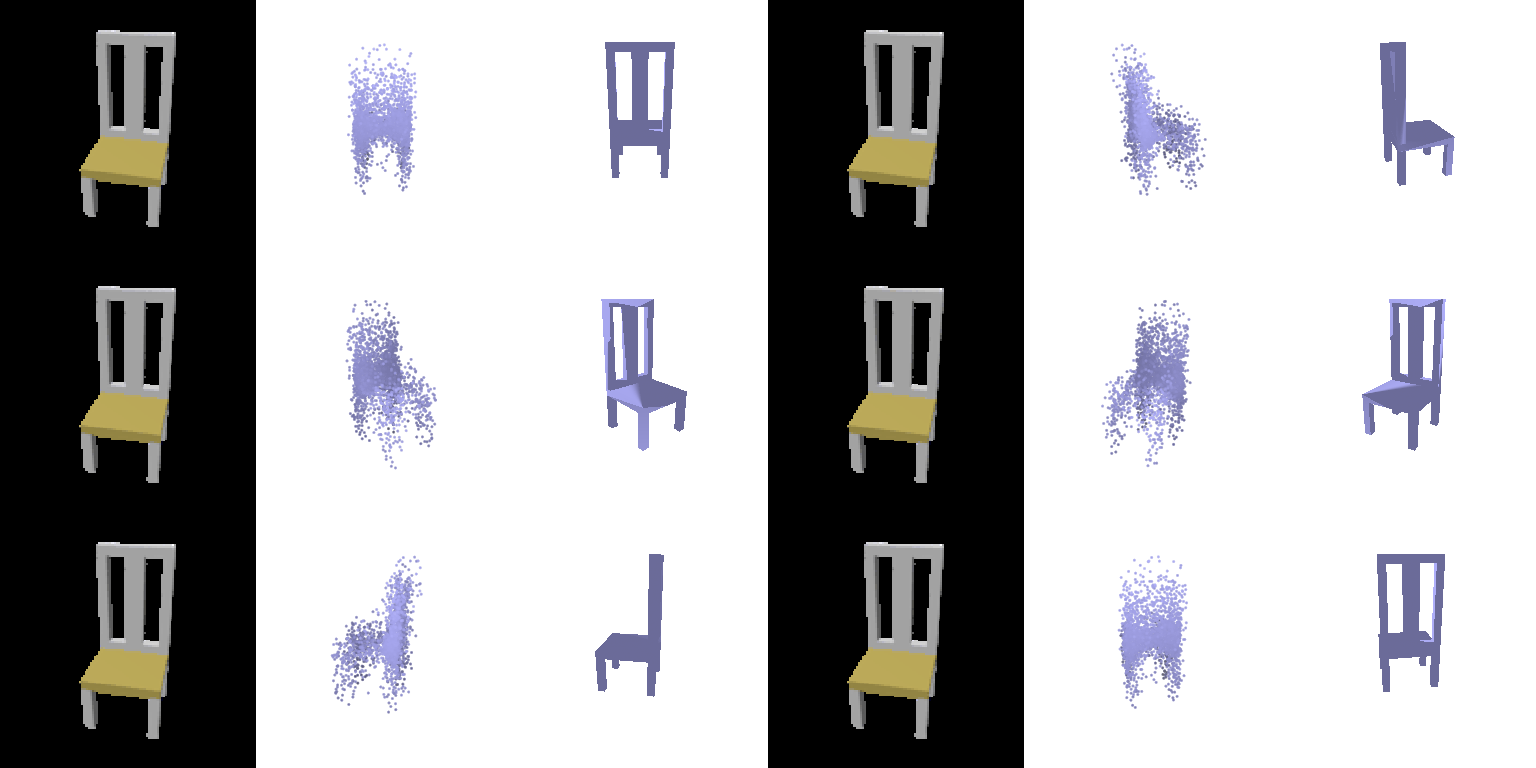
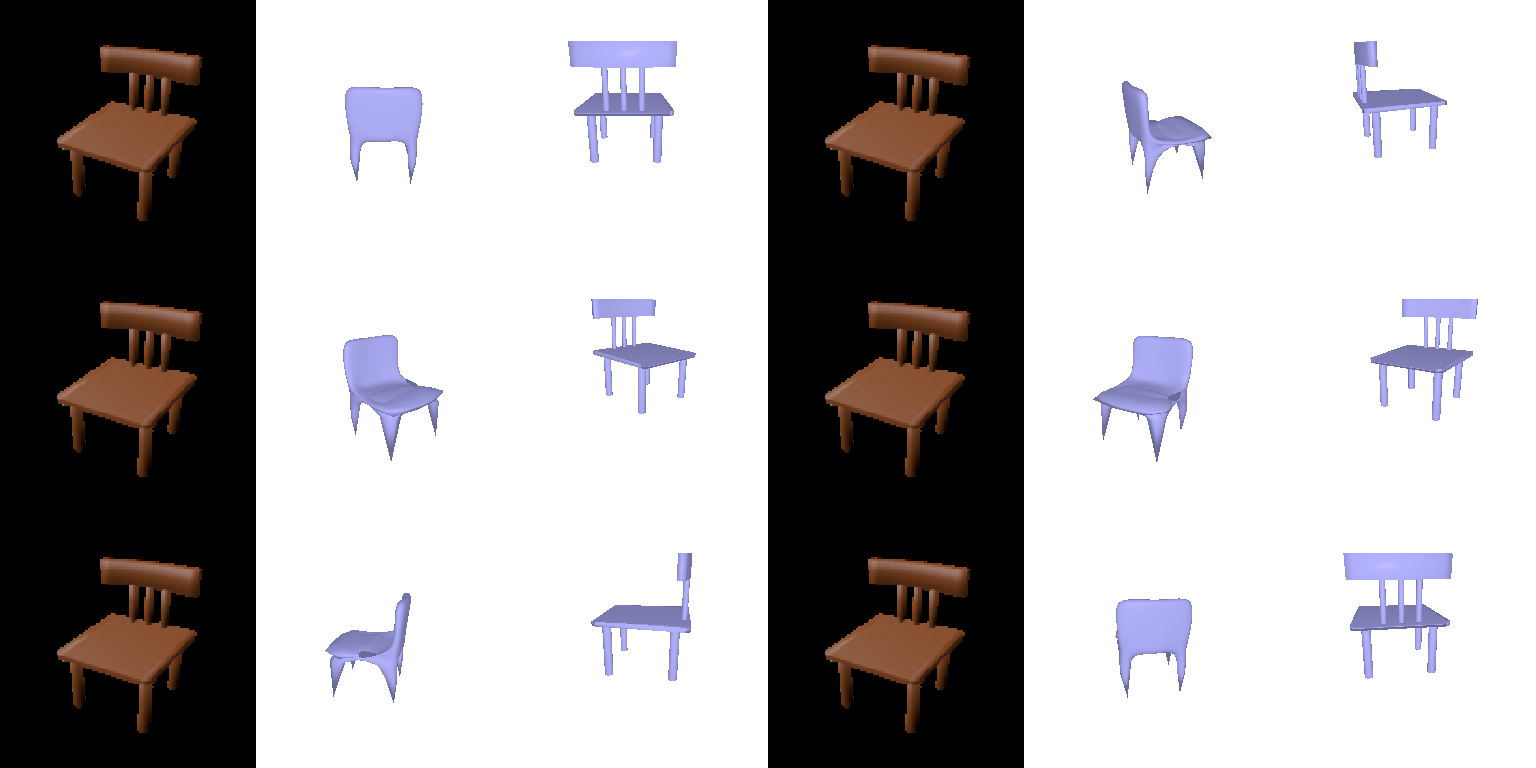
Test chairs 10, 250 and 500. Columns: input RGB, parametric-network prediction, ground-truth mesh.
The parametric network reaches F1@0.05 = 84.2 ± 0.2, 2.0 below the MLP point decoder of 2.2 (86.2) under the same evaluation. Its F1@0.01 is 15.4, against 16.7. Validation F1 peaks after 4k of the 15k iterations and then declines, which indicates overfitting. Qualitatively, the points of each patch form a surface-like sheet, but thin legs remain diffuse.
The local image features did not make the parametric decoder better than the MLP baseline. A likely reason is the missing camera pose: the network must learn which of the 25 coarse feature-map cells corresponds to each 3D point, and this correspondence changes with the viewpoint. Projecting each 3D point into the image with the known camera, as pixel-aligned methods such as DISN and PIFu do, would supply this correspondence directly.
3.3 Extended dataset for training (10 points)
Setup. I retrain the point-cloud model of 2.2 with the same decoder, loss and 15k-iteration budget on the 3-class training split: 3640 planes, 3146 cars and 6100 chairs. I evaluate both models on the 3-class test split. The chairs in both splits are identical to those of the single-class dataset, so the chair column compares the two models on the same test images.
| Trained on | Chair F1@0.05 | Car F1@0.05 | Plane F1@0.05 | All F1@0.05 | Chair F1@0.01 |
|---|---|---|---|---|---|
| Chairs only | 86.2 ± 0.2 | 82.1 ± 0.4 | 72.9 ± 0.5 | 81.4 ± 0.3 | 16.7 ± 0.1 |
| Chairs + cars + planes | 87.4 ± 0.2 | 96.4 ± 0.1 | 97.6 ± 0.1 | 92.5 ± 0.1 | 17.2 ± 0.1 |
3-class test set (678 chairs, 368 cars, 405 planes); all views × 3 point-sampling seeds; values in %.
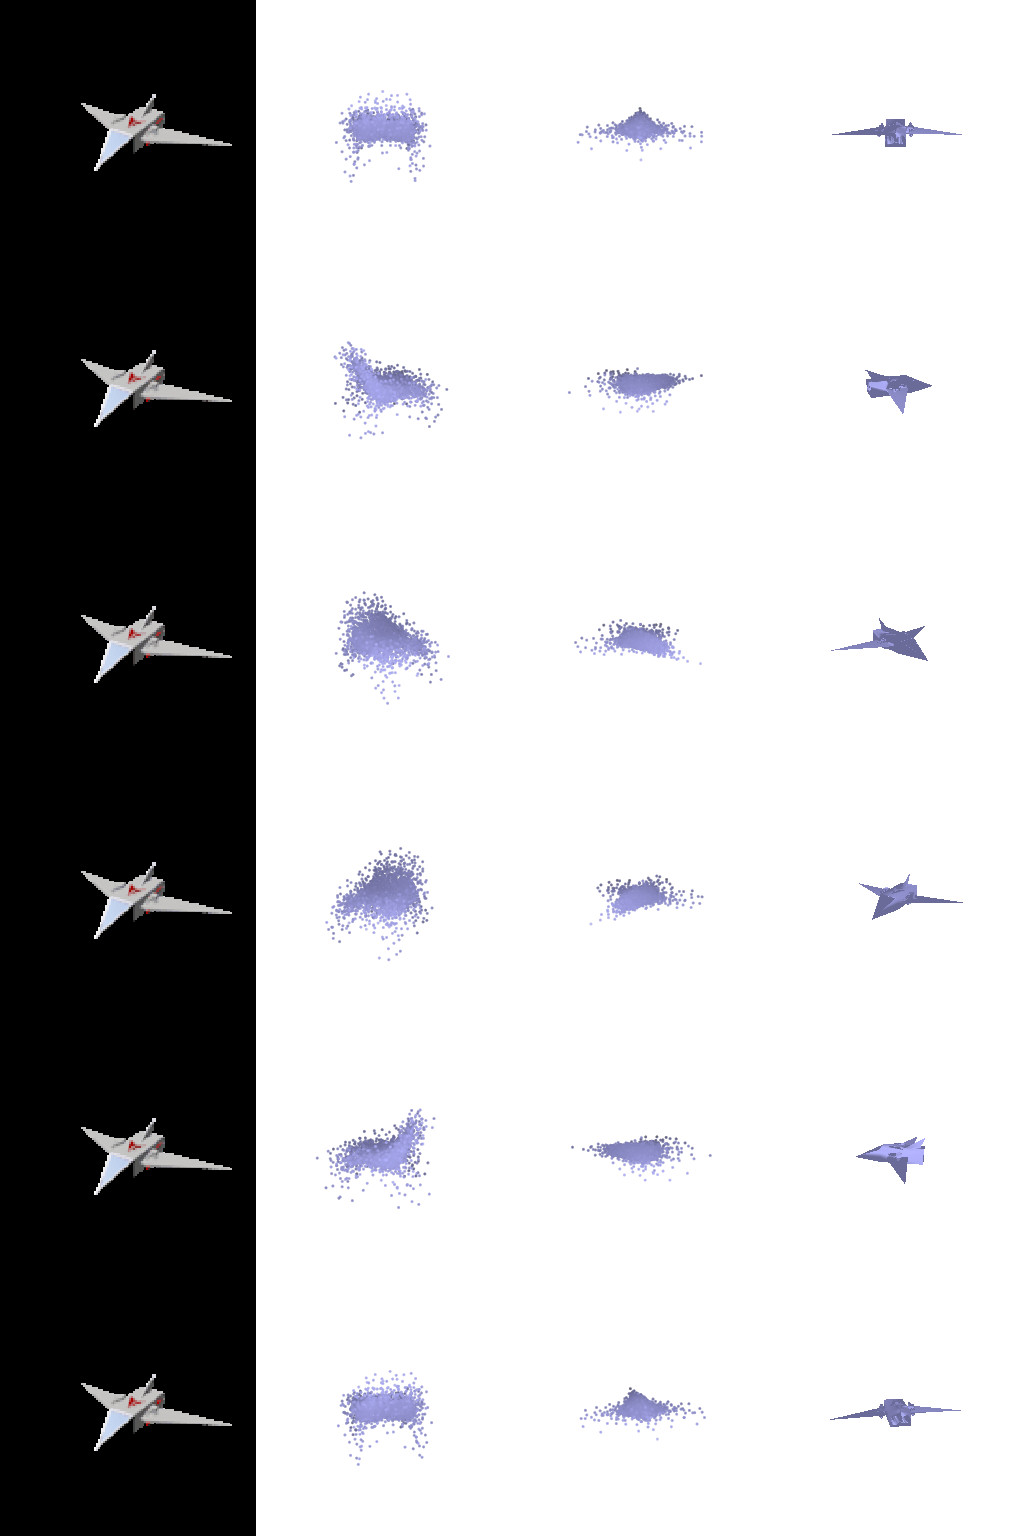


A plane, a car and two chairs (test chairs 10 and 250 of 2.2). Columns: input RGB, model trained on chairs only, model trained on 3 classes, ground-truth mesh.
Training on three classes raises F1@0.05 from 82.1 to 96.4 on cars and from 72.9 to 97.6 on planes. The chairs-only model has learned only the shape distribution of chairs, so it maps every input to a chair-like shape: it reconstructs the plane and the car above as diffuse, chair-sized point clouds. The 3-class model has learned the shape distributions of cars and planes and reconstructs their characteristic geometry: a flat fuselage with wings, and a long, low car body. Cars and planes also score higher than chairs, probably because their shapes vary less within the class and contain fewer thin structures.
Chairs improve by 1.2 F1@0.05 (86.2 → 87.4), although chairs make up fewer than half of the 3-class training set. A plausible explanation is that the more diverse training set regularizes the image encoder; the chair reconstructions of the two models are visually similar.