


GT: chair
GT: chair
GT: chair
GT: lamp
Test Accuracy: 97.17%
Random Test Point Clouds:
|
|
|
|
|---|---|---|---|
| Pred: chair GT: chair |
Pred: chair GT: chair |
Pred: chair GT: chair |
Pred: lamp GT: lamp |
Failed Predictions:
| Ground Truth | Point Cloud | Predicted | Interpretation |
|---|---|---|---|
| Chair |  |
lamp | This point cloud shows a chair in a folded form. There’s no clear ledge that could be a seat, so it’s understandable the model might not classify it as a chair. Unlike the depicted object, vases are pillar-like. The depicted point cloud has an arch, like the neck of a lamp, so it makes sense it’s classified as one. |
| Vase |  |
lamp | This point cloud readily appears to me like a prototypical vase, so I’m suprised the model misclassified it. With that said, the model might have been confused by the flower bulb, thinking it appears like a light bulb, so misclassifying it as a lamp. |
| Lamp |  |
vase | I’ve never seen a lamp before that looks quite like this one, so it’s understandable to me the model wouldn’t readily classify it as one. There’s no seat, so it’s clearly not a chair. The depicted object is compact and has a volume-holding body, like most vases, which is possible why the model misidentified it as one. |
Test Accuracy: 89.79%
Segmentation Results:
| Object | Ground Truth | Prediction | Accuracy |
|---|---|---|---|
| 586 | 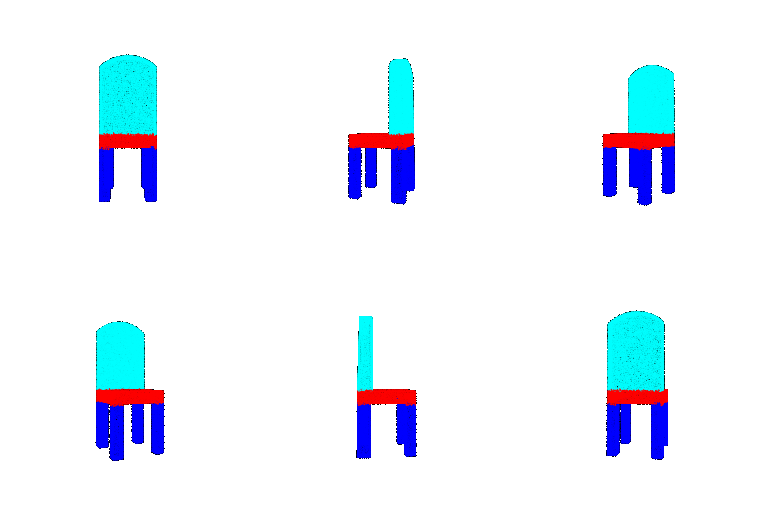 |
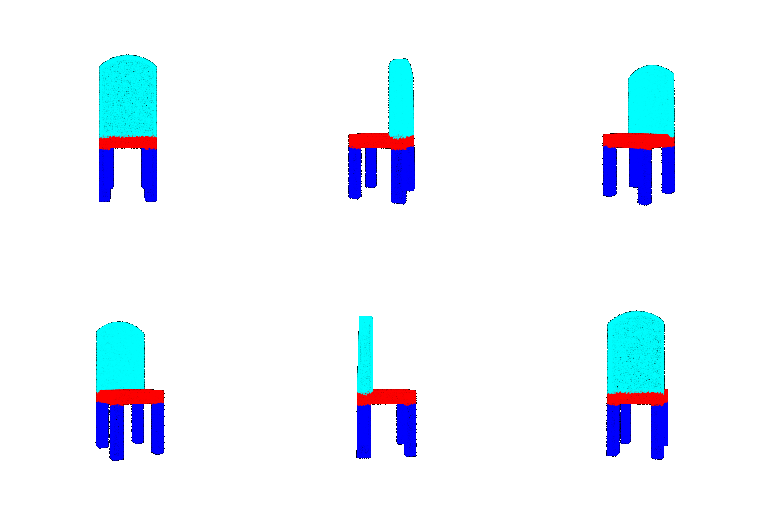 |
97.9% |
| 532 | 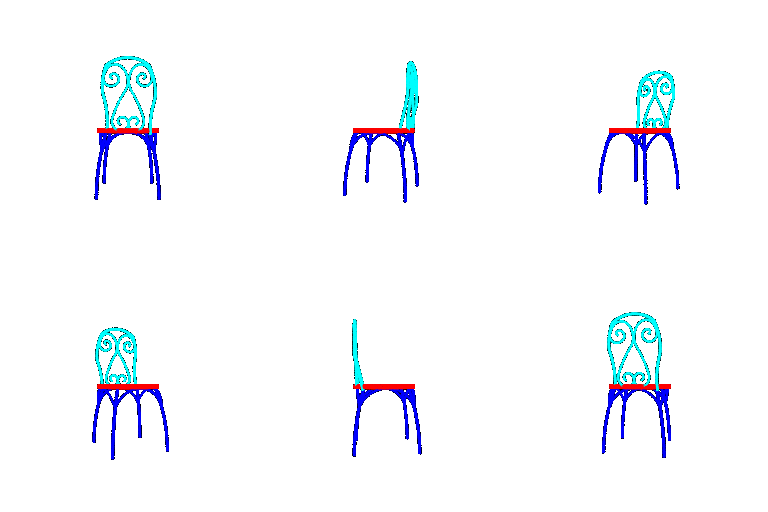 |
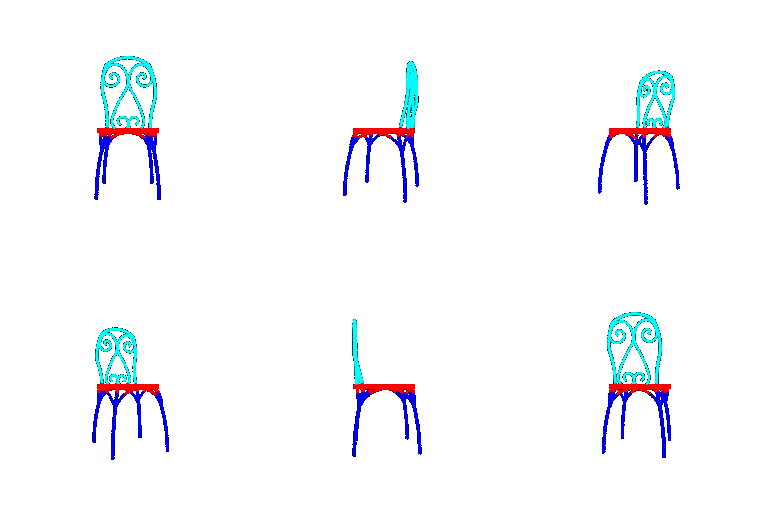 |
95.0% |
| 524 | 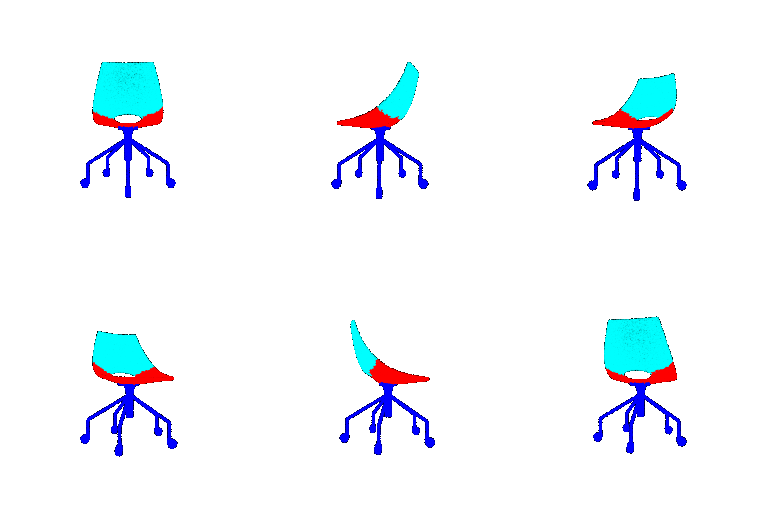 |
 |
93.9% |
| 235 (bad) | 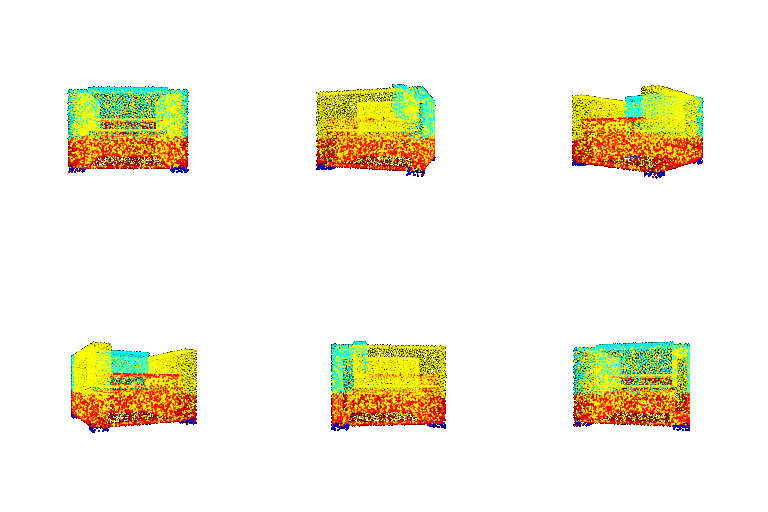 |
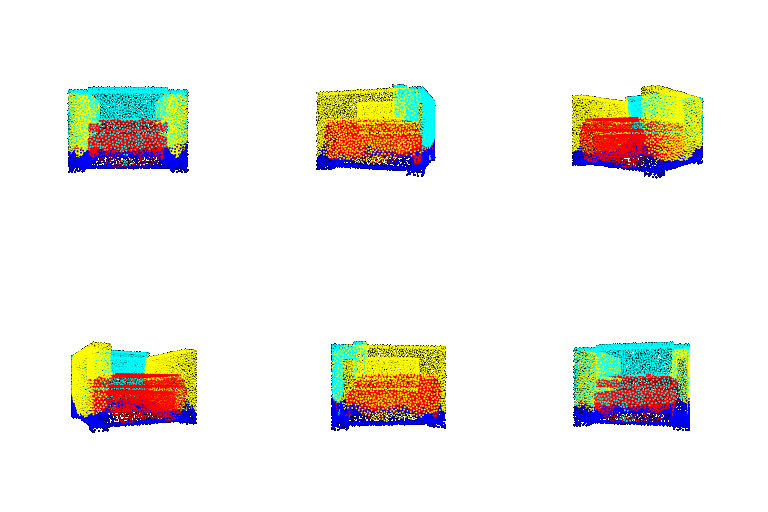 |
48.1% |
| 351 (bad) | 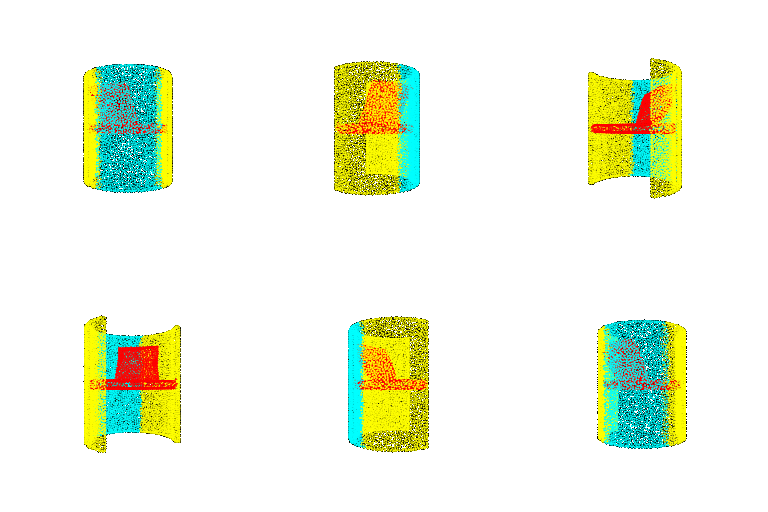 |
 |
41.2% |
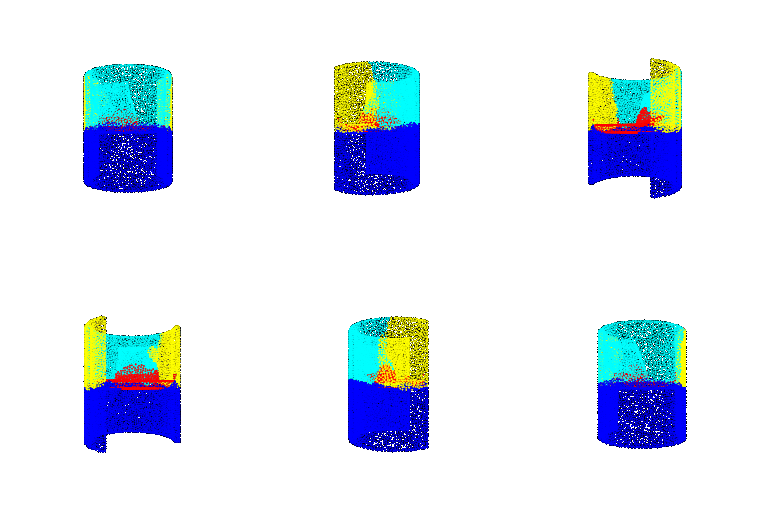
Overall, the model classifies points fairly well, as evidenced by the model classifying 89.79% of test points correctly. The randomly sampled objects show the model does especially well on slender, long-legged chairs (objects 586, 532, 524 in the table) where it has an accuracy over 90%, and visually the model-segmented regions align well with the ground truth. The model appears to struggle much more with sofa-like chairs (235 and 351 in the table) where the distinction between the chair back and the chair body is less clear.
In object 235, the legs are short and stubby. The model classifies the actual legs and also a bit more from the frame as legs, perhaps because it learned from the totality of training examples that legs should be longer than they are in object 235, so overstates the leg length in its segmentation. PointNet in particular might be vulnerable to this type of failure because it only has global and point features, not local neighborhood features, so it might tend to classify based on overall location of the point, rather than exactly where the other points immediately around it are.
In object 351, interestingly, I think the model did a better job classifying the points in the object than the ground truth did. Strictly speaking, the whole chair is its legs (there’s no distinct leg protrusions), so the model did what is in my opinion a very fair thing which is say all the chair below the seat is the legs vs. the ground truth said none of the chair is the legs. This gets us into philosophical territory of what exactly is a chair leg, which I’ll call beyond the scope of this model.
Evaluate the model’s accuracy for test samples with only n points, where n is swept across 10, 100, 1000, and 10000 using the following bash command:
for n in 10 100 1000 10000; do uv run eval_cls.py --num_points $n --viz --output_dir output/q3_pts$n; uv run eval_seg.py --num_points $n --viz --output_dir output/q3_pts$n; done | tee output/q31.log
The model is not retrained.
Test Accuracy:
| Task | 10 pts | 100 pts | 1000 pts | 10000 pts (Q1/Q2) |
|---|---|---|---|---|
| Classification | 59.60% | 91.50% | 96.22% | 97.17% |
| Segmentation | 68.93% | 82.85% | 89.40% | 89.79% |
Classification Samples:
| Object | Ground Truth | 10 pts | 100 pts | 1000 pts | 10000 pts (q1) |
|---|---|---|---|---|---|
| 257 | chair |  Pred: chair |
 Pred: chair |
 Pred: chair |
 Pred: chair |
| 486 | chair |  Pred: chair |
 Pred: chair |
 Pred: chair |
 Pred: chair |
| 808 | lamp |  Pred: lamp |
 Pred: lamp |
 Pred: lamp |
 Pred: lamp |
Segmentation Samples:
| Object | Ground Truth | 10 pts | 100 pts | 1000 pts | 10000 pts (q2) |
|---|---|---|---|---|---|
| 392 |  |
 70.0% |
 89.0% |
 83.4% |
 83.7% |
| 315 |  |
 70.0% |
 89.0% |
 96.4% |
 95.0% |
| 523 |  |
 40.0% |
 88.0% |
 88.3% |
 88.7% |
The model is remarkably robust against a reduced number of points in the input point cloud. For classification, test accuracy stays above 90% and above 80% for segmentation even when the number of points is as low as 100 (vs the 10,000 used in q1/q2). Note, that by random chance, the visualized samples in the table actually were all classified correctly, so the test accuracy table gives the better idea of the trend. This has to do significantly with the fundamental architecture of the model. The max pooling layer to create the global embedding means that a maximum of 512 points (the dimension of the global embedding) can even contribute to that global embedding. This means the model has to learn the global object structure from far fewer points than are in the total point cloud, making it relatively robust against reduced point inputs. Taken to the extreme though, when the input only has 10 pts, the model performance drops significantly (to less thaan 60% on classification and less than 70% on segmentation). With less than 10pts contributing to the global feature, there’s just not a lot of information to distinguish the shape of the object or what it is.
Evaluate the model’s accuracy for test samples where the test point cloud is rotated by theta degrees about the x-axis, where theta is swept across 0, 30, 60 and 90 using the following bash command:
for d in 0 30 60 90; do uv run eval_cls.py --rot $d --viz --output_dir output/q3_rot$d; uv run eval_seg.py --rot $d --viz --output_dir output/q3_rot$d; done | tee output/q32.log
The model is not retrained.
Test Accuracy:
| Task | 0° (Q1/Q2) | 30° | 60° | 90° |
|---|---|---|---|---|
| Classification | 97.17% | 70.72% | 31.48% | 31.79% |
| Segmentation | 89.79% | 71.92% | 32.13% | 25.35% |
Classification Samples:
| Object | Ground Truth | 0° | 30° | 60° | 90° |
|---|---|---|---|---|---|
| 257 | chair |  Pred: chair |
 Pred: chair |
 Pred: lamp |
 Pred: vase |
| 486 | chair |  Pred: chair |
 Pred: chair |
 Pred: lamp |
 Pred: vase |
| 808 | lamp |  Pred: lamp |
 Pred: lamp |
 Pred: lamp |
 Pred: vase |
Segmentation Samples:
| Object | Ground Truth | 0° | 30° | 60° | 90° |
|---|---|---|---|---|---|
| 392 |  |
 83.7% |
 67.8% |
 45.6% |
 19.2% |
| 315 |  |
 95.0% |
 81.4% |
 18.5% |
 10.2% |
| 523 |  |
 88.7% |
 79.1% |
 31.9% |
 33.0% |
Changing the angle of the input point cloud immediatly and significantly degrades the model performance on both classification and segmentation. This is not suprising, because the model does not have any built-in rotation-invariance, and none of the training set included point clouds of the objects rotated about the global x frame, which is what this experiment tests. Classification success drops from over 97% at 0 deg to around 70% at 30deg rotation to around 30% at 60 and 90 deg rotation, and segmentation test accuracy drops from around 90% at 0 deg to around 70% at 30 deg rotation, around 30% at 60 deg rotation and 25% at 90 deg rotation. The visualization of the segmentation results I think is particularly revealing about one way the model fails. It seems that regardless of the chair orientation, the model classifies the lower portion of points as leg points, suggesting the model learned a strong hueristic that lower down points are the chair legs, which was true for the ground truth samples, but not once the chair cloud was rotated.
I implemented the simplified version of the local grouping in DGCNN. I expand each point in the input point cloud into a new local-aware feature by concatenating on the offsets to the k nearest points (I used k=9), which I then pass into the cls and seg models.. Each point goes from being a 3 dimension feature to being a 3 + k * 3 = 30 dimension feature. To accomodate the larger feature, I expand the input dimension of the previously defined cls and seg models to be (3 + k * 3) wide, but leave those models otherwise unchanged.
Test Accuracy:
| Task | PointNet (q1/q2) | kNN-Local (q4) |
|---|---|---|
| Classification | 97.17% | 96.75% |
| Segmentation | 89.79% | 90.07% |
Classification Samples:
| Object | Ground Truth | PointNet (q1) | kNN-Local (q4) |
|---|---|---|---|
| 257 | chair | Pred: chair |
 Pred: chair |
| 486 | chair | Pred: chair |
 Pred: chair |
| 808 | lamp | Pred: lamp |
 Pred: lamp |
Segmentation Samples:
| Object | Ground Truth | PointNet (q2) | kNN-Local (q4) |
|---|---|---|---|
| 392 | |
83.7% |
 83.0% |
| 315 | |
95.0% |
 95.4% |
| 523 | |
88.7% |
 83.1% |
My encorporation of locality did not significantly change the performance of the model. I suspect this is because I set k=9 which is too low, because the 9 nearest points are extremely nearby on the given point clouds so it doesn’t give a wide enough local neighborhood to be semantically informative.