| Ground Truth | Optimized |
|---|---|
|
|
| Ground Truth | Optimized |
|---|---|
 |
 |
| Ground Truth | Optimized |
|---|---|
 |
 |
| Example 1 | Example 2 | Example 3 | |
|---|---|---|---|
| Input |  |
 |
 |
| Ground Truth | 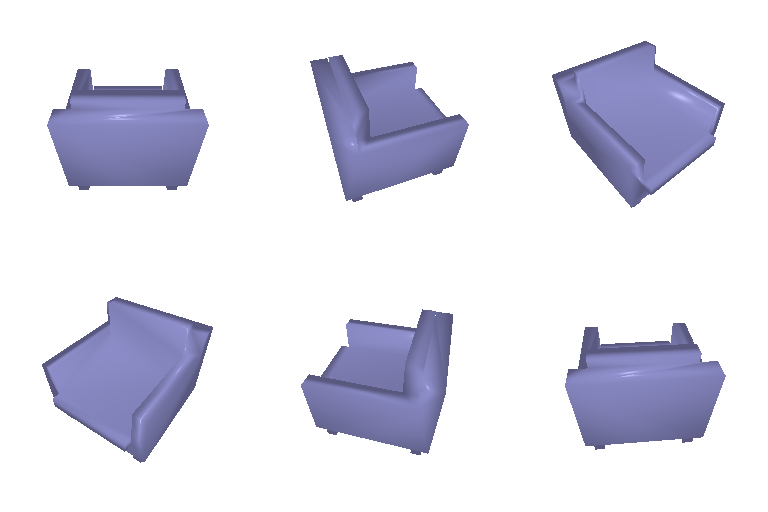 |
 |
 |
| Predict | 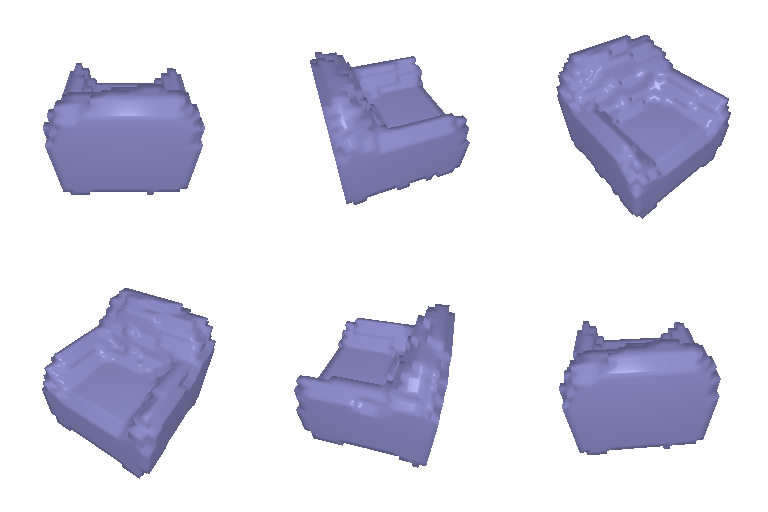 |
 |
 |
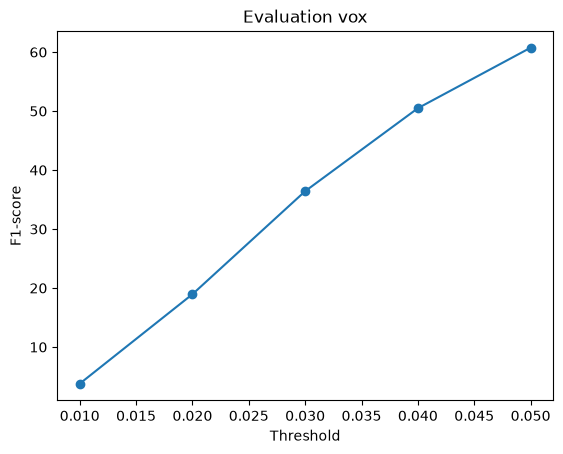
F1@0.05: 60.743
| Example 1 | Example 2 | Example 3 | |
|---|---|---|---|
| Input |  |
 |
 |
| Ground Truth | 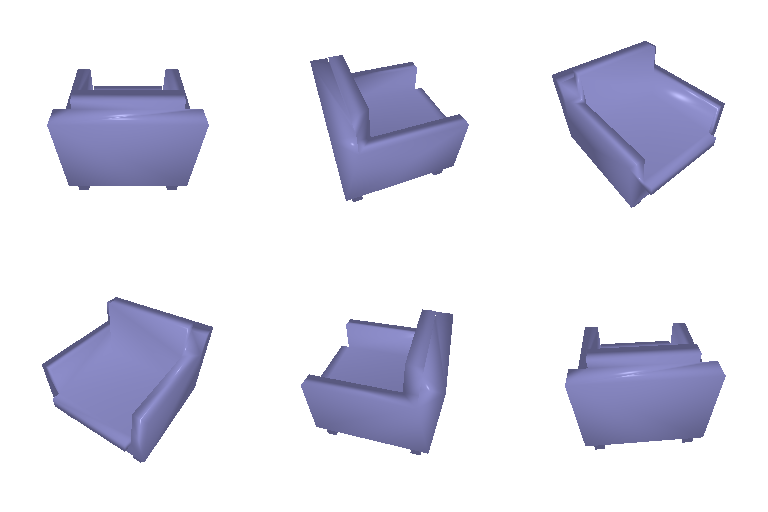 |
 |
 |
| Predict | 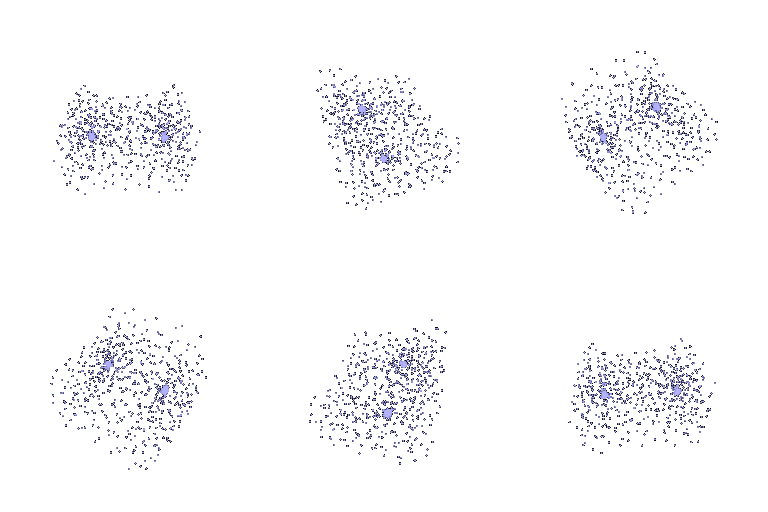 |
 |
 |
F1@0.05: 80.974
| Example 1 | Example 2 | Example 3 | |
|---|---|---|---|
| Input |  |
 |
 |
| Ground Truth | 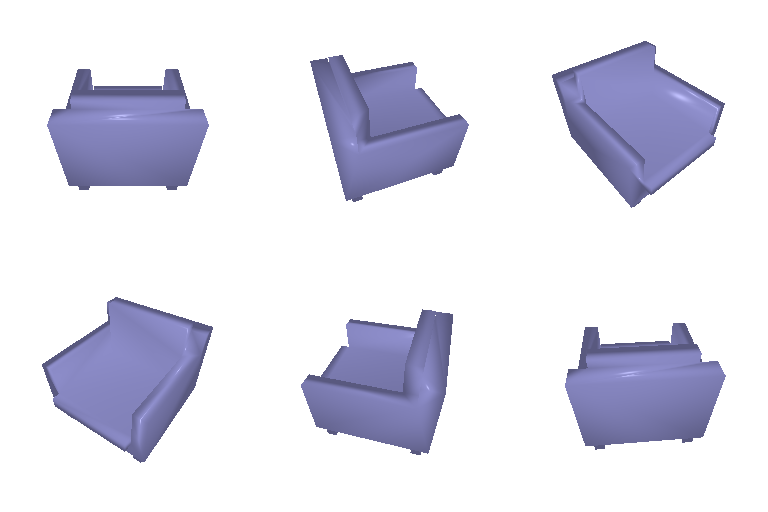 |
 |
 |
| Predict | 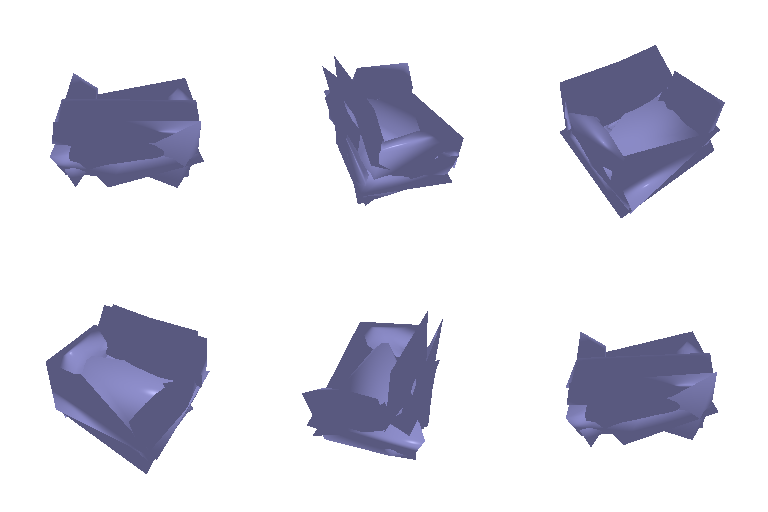 |
 |
 |
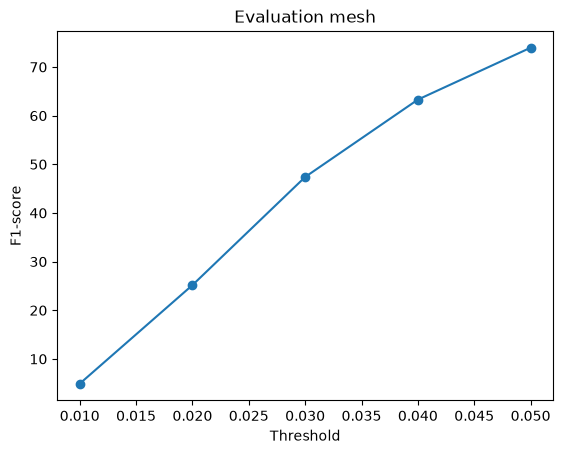
F1@0.05: 73.966
| Representation | F1@0.05 |
|---|---|
| Voxel grid | 60.743 |
| Point cloud | 80.974 |
| Mesh | 73.966 |
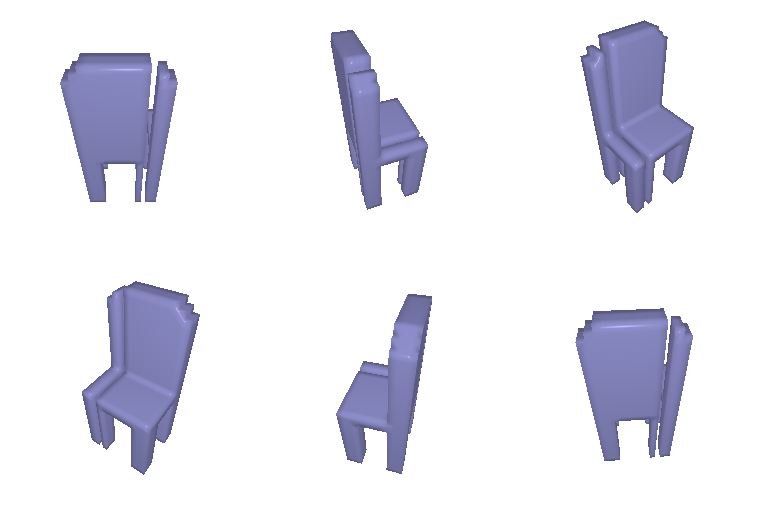
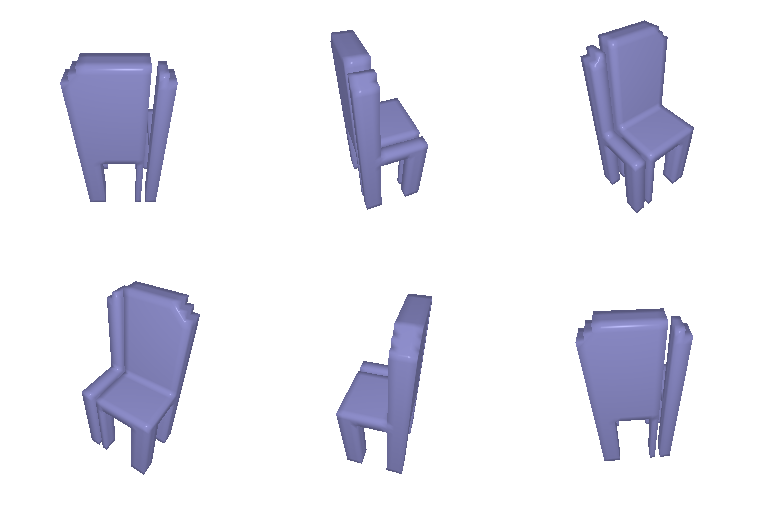
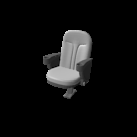
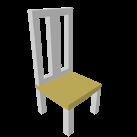
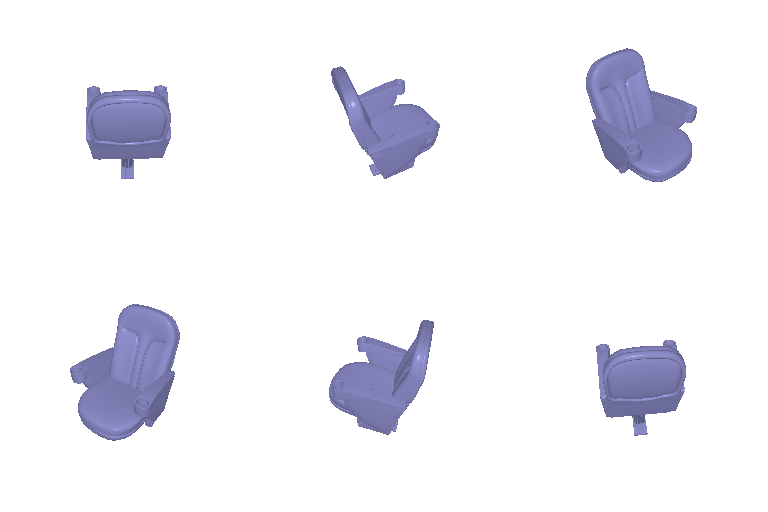
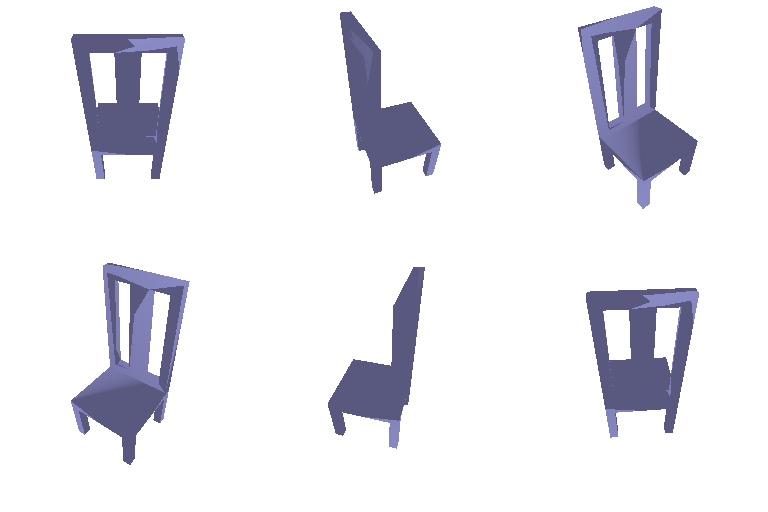
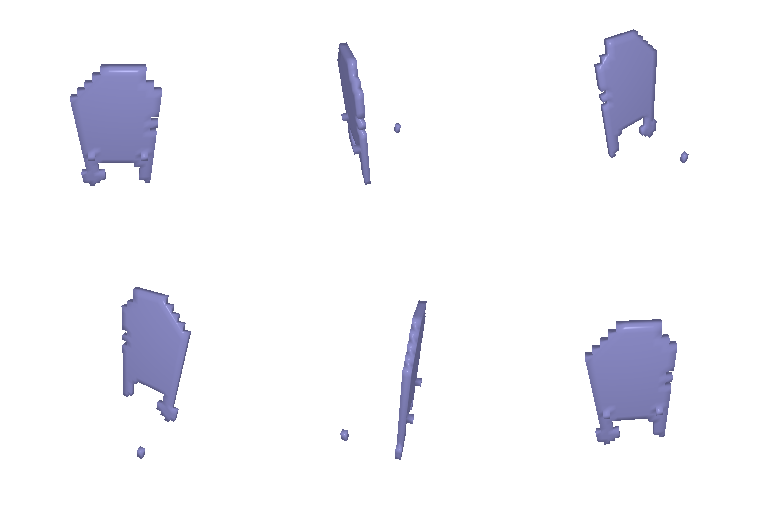
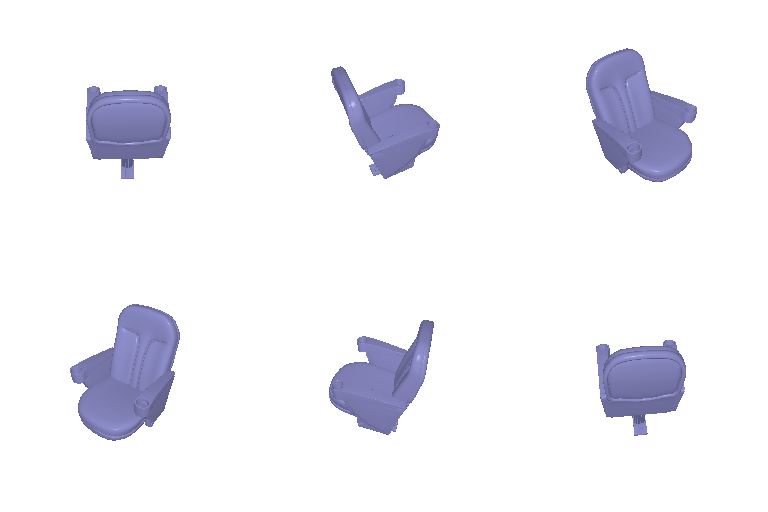
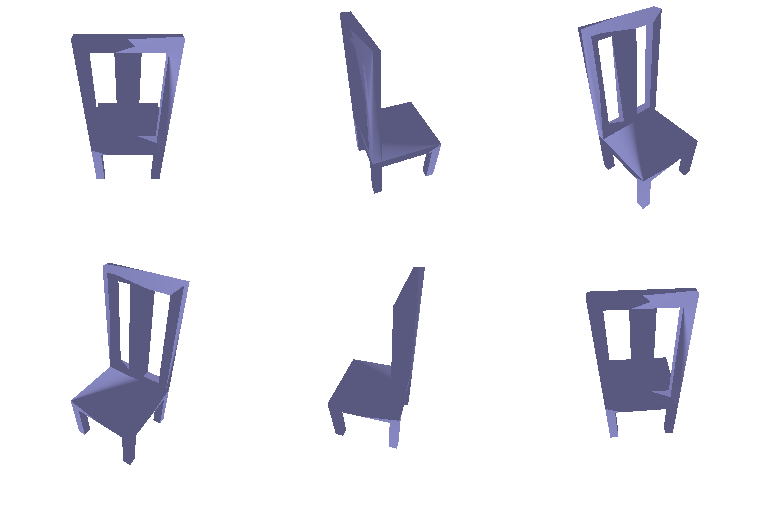
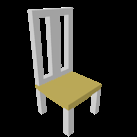
The voxel grid representation splits the mesh into discrete cube-sized chunks. At only 32 cubes in each direction, each cube is relatively large, making it so thin parts of the chair occupy a small portion of some cubes. This makes the network less certain about whether the cell is occupied, leading to a lower cell prediction, often below the 0.5 marching cubes threshold for inclusion in the mesh. This means many thin features are entirely excluded from the prediction, dropping the F1 score (see how the thin chair seat is missing in voxel grid prediction 3). Further, F1 is based on point predictions, which requires running a marching cubes algorithm which itself distorts the prediction. Combined, these lead the voxel grid representation to have the lowest average F1 score at around 60.743.
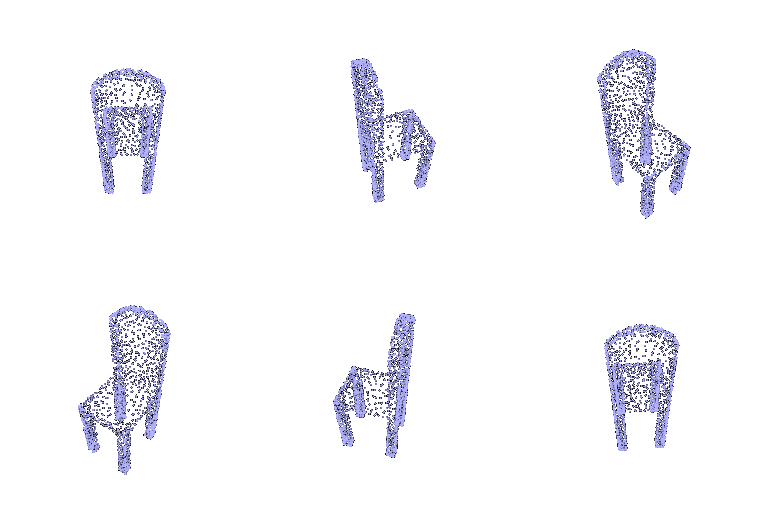
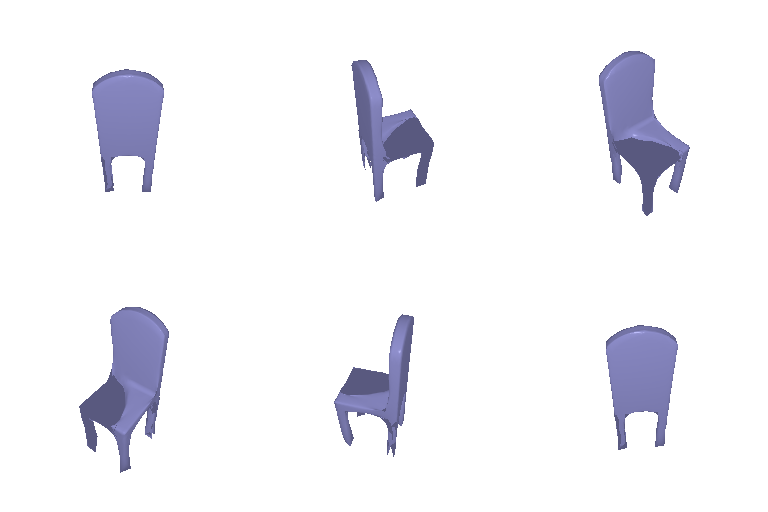
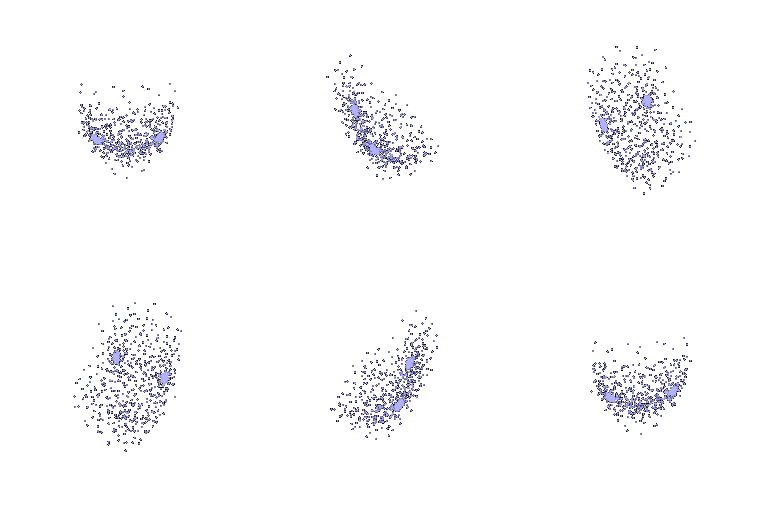
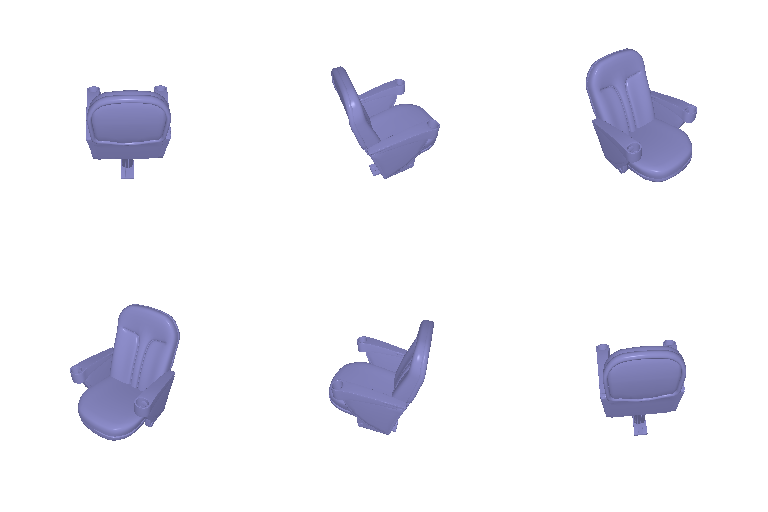
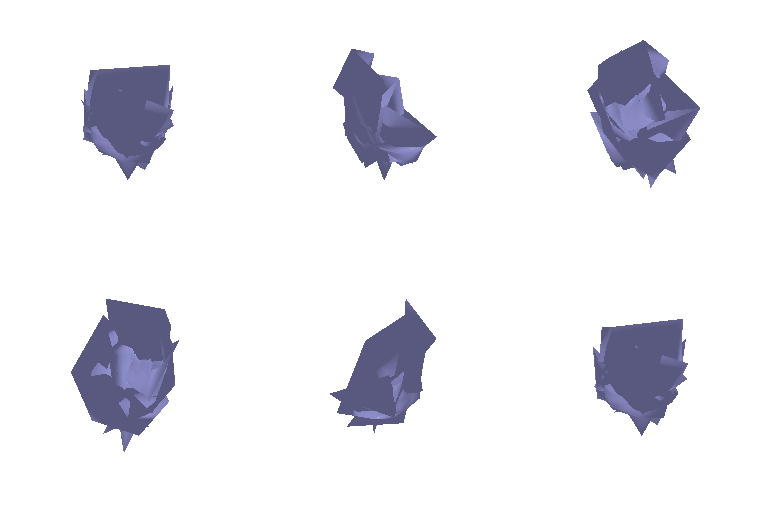
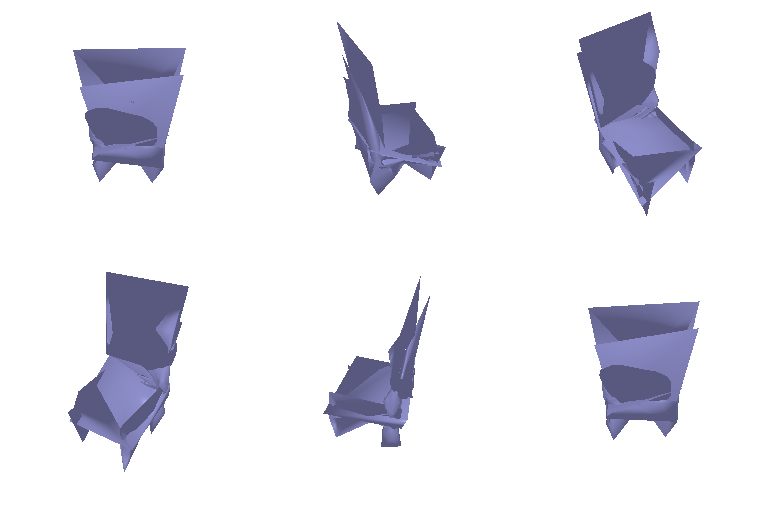
The mesh representation with an average F1 score of 73.966 is better than the voxel grid representation but worse than the point cloud. The mesh representation is trained using a chamfer loss which is a much more direct analogue to an F1 score, than the voxel grid’s BCE loss. Further, there’s no discretization constraint so it makes sense the mesh does better than the voxel grid. The mesh representation is constrained by the topology of the original shape (in our case a sphere), which means the predicted mesh can’t have any holes. This is a major limitation, as for example, predicted mesh 3 shows the mesh covering the holes in the chair back, dropping the F1 score.
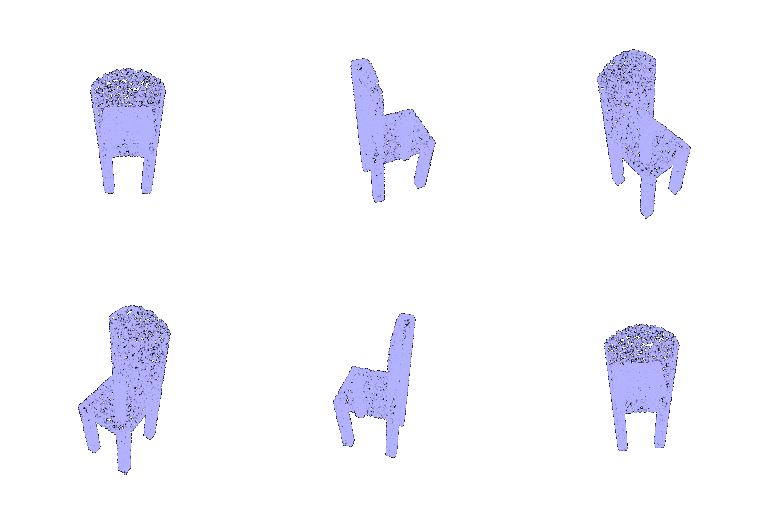
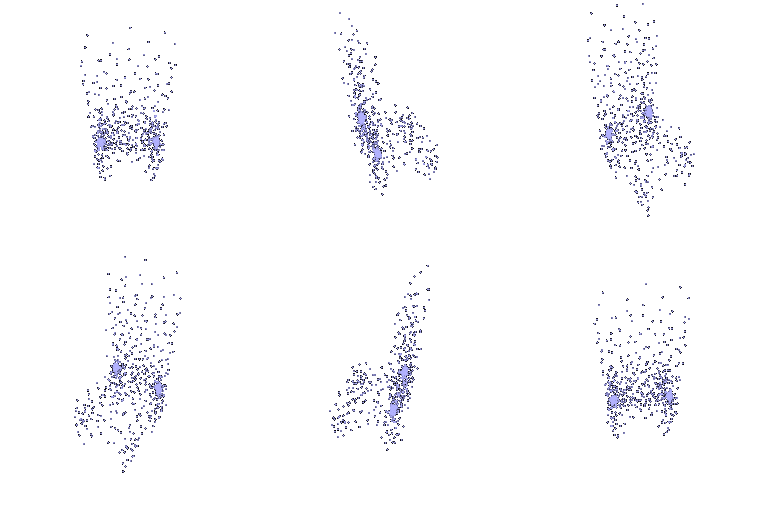
With an F1 score of 80.974, the point cloud representation does the best. It’s like the mesh in being trained on the chamfer loss which is similar to the F1 score, but unlike the mesh representation it has no limiting topological prior so the points can move more freely.
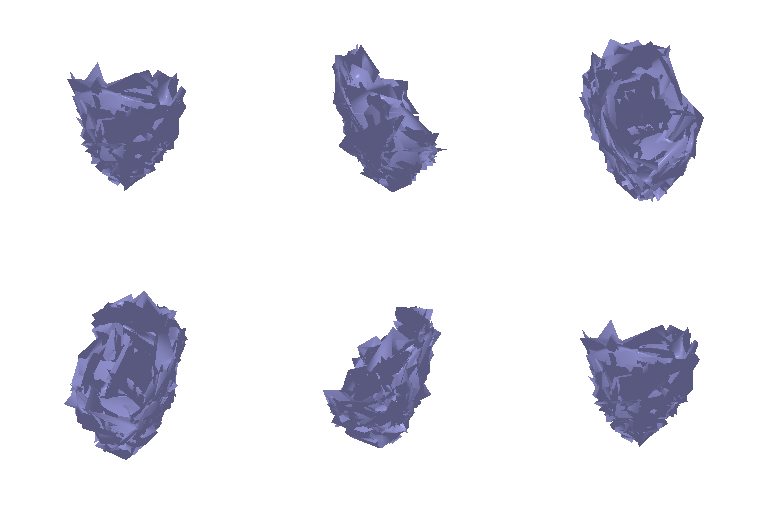
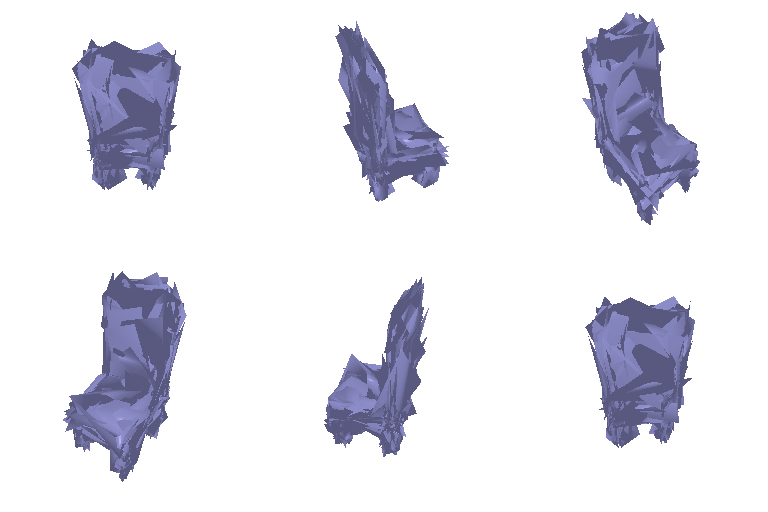
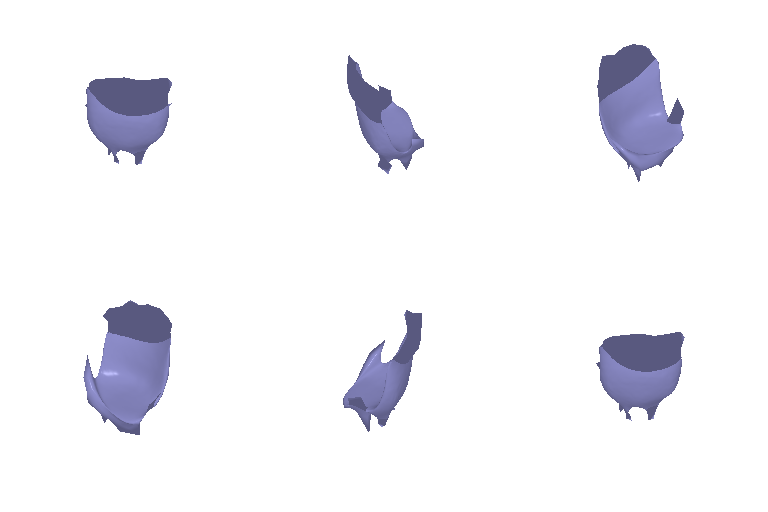
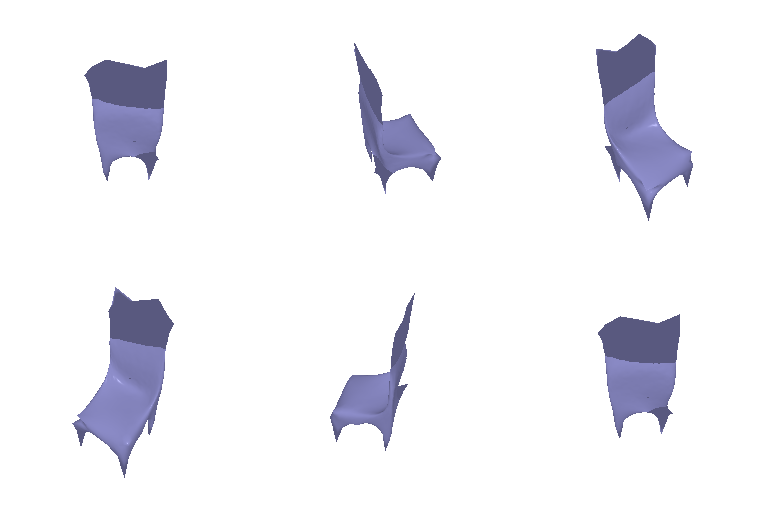
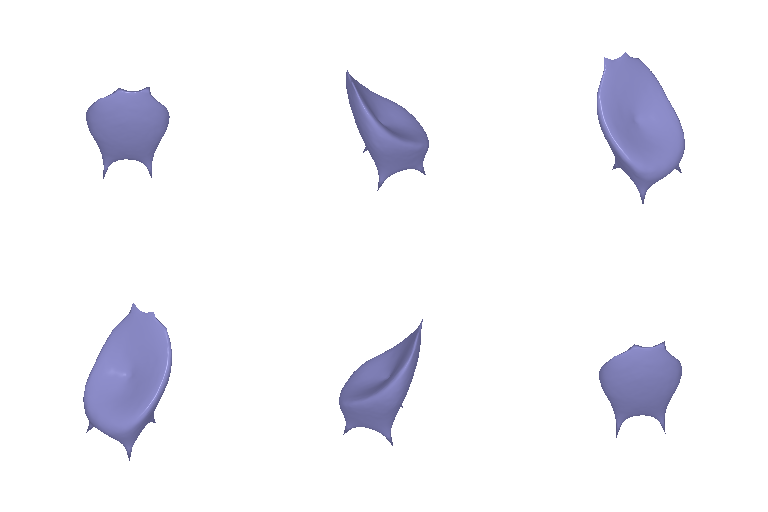
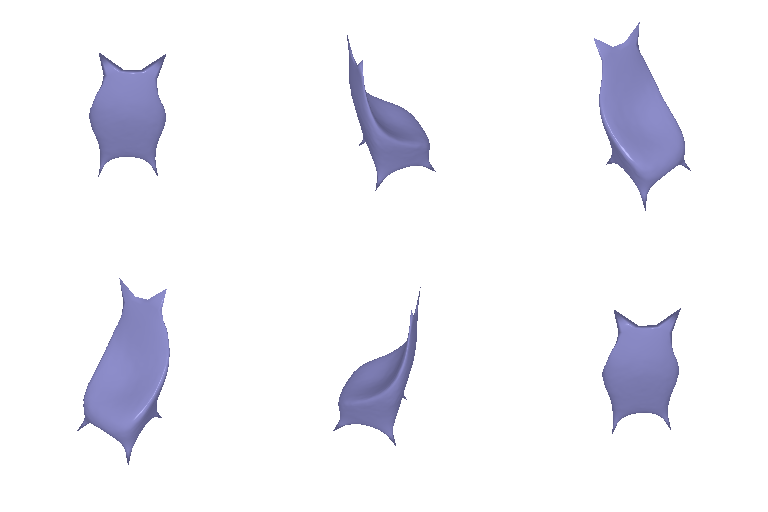
I noticed that the predicted mesh above looks a bit jagged, so I did a sweep of the w_smooth regularizer across values 0 (no regularization), 0.1 (default), 1, and 10.
| Example 1 | Example 2 | Example 3 | F1@0.05 | |
|---|---|---|---|---|
| Input | |
|
|
|
| Ground Truth | |
|
|
|
| Predict ws = 0 | 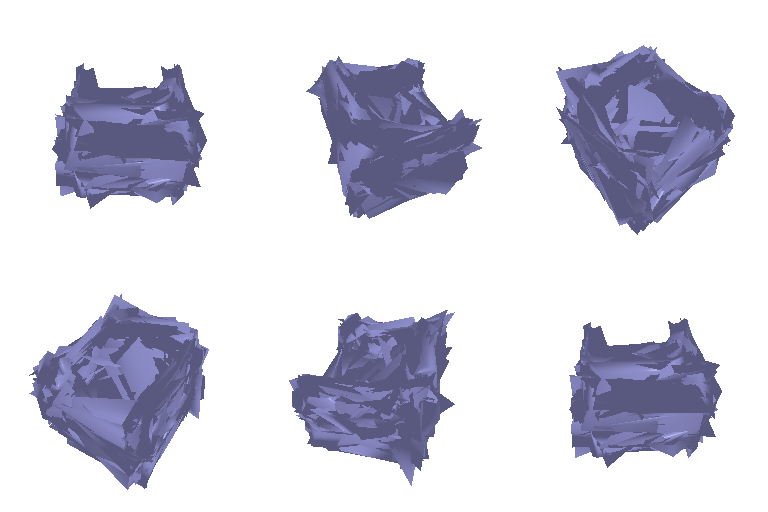 |
 |
 |
75.416 |
| Predict ws = 0.1 | |
|
|
73.966 |
| Predict ws = 1 | 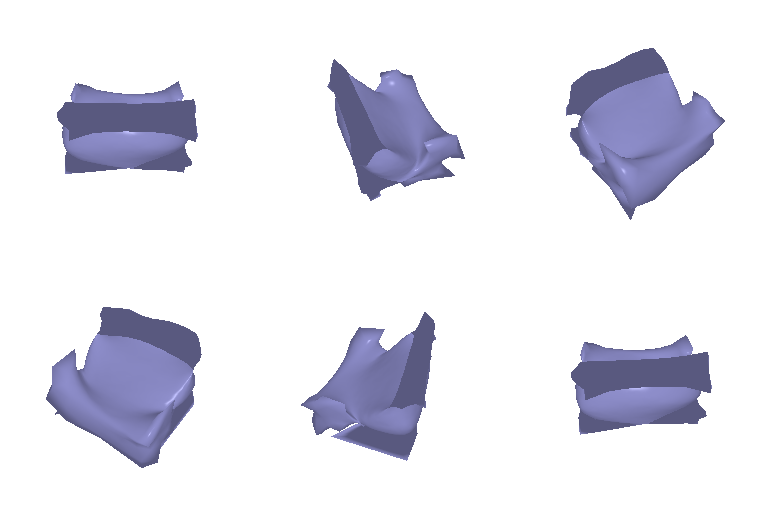 |
 |
 |
71.595 |
| Predict ws = 10 | 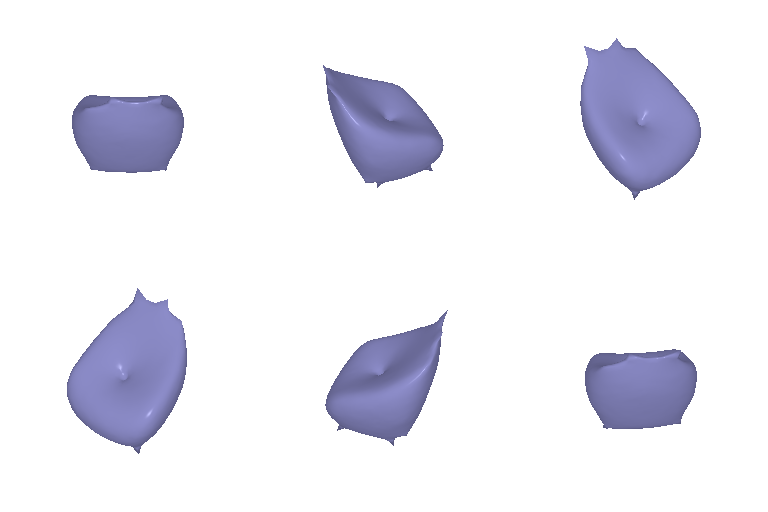 |
 |
 |
59.127 |
As expected, increasing the smoothing parameter w_smooth made the predicted mesh smoother, and only significantly compromised point-by-point accuracy (lower F1 score) at the most extreme smoothing value. As seen in the F1 column, ws=0, ws=0.1, and ws=1 have a somewhat similar F1@0.05 score in the mid-to-low 70s (75.416, 73.966, 71.595 respectively), and only with extreme smoothing ws=10 does the F1@0.05 score drop off significantly (drops to 59.127). Both extremes make sense – ws=0 had the highest F1 score, because without smoothing, its chamfer loss dominates, driving F1 up, compared with ws=10 which had the lowest F1 score because smoothness is rewarded over accuracy. This has a real qualitative impact. The best scoring prediction in terms of F1 score is also the worst looking (F1 doesn’t reward surface smoothness). Compared with the default w_smooth value of 0.1, using a ws smoothing value of 0 significantly increases the raggedness and ws = 1 decreases ragged artifacts in the default prediction, while still retaining most of the same chair shape. Qualitatively, ws=1 feels like the best tradeoff between smoothness and shape fidelity. Increasing w_smooth to 10 is, in my opinion, the most interesting result. The chair surface gets entirely smoothed, but the concavities and protrusions in the ground truth get smoothed over too. This gives the chair a 60s space-age aestetic (reminds me of my trip to the TWA hotel), and actually I kind of like it.
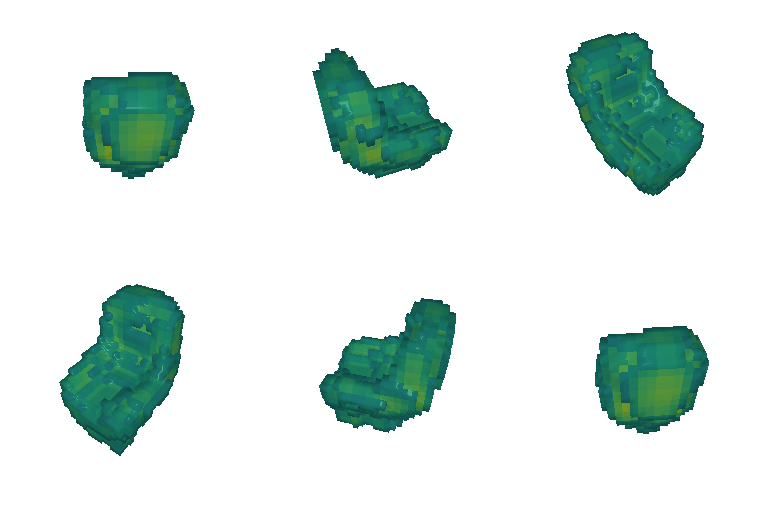
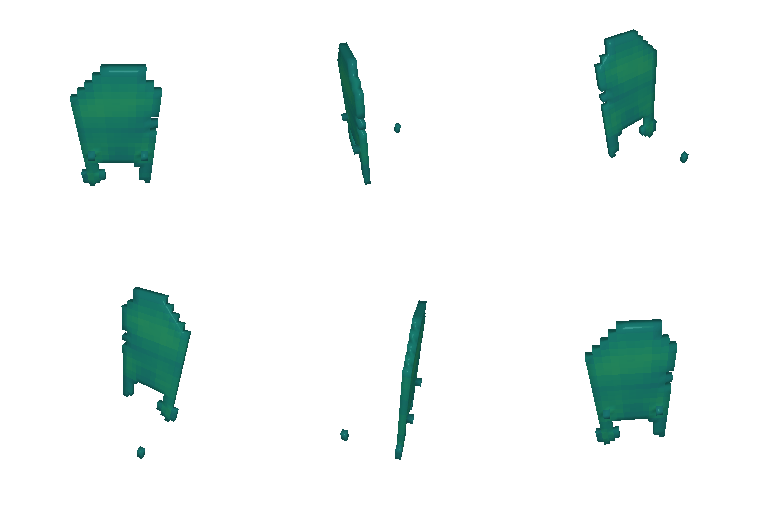
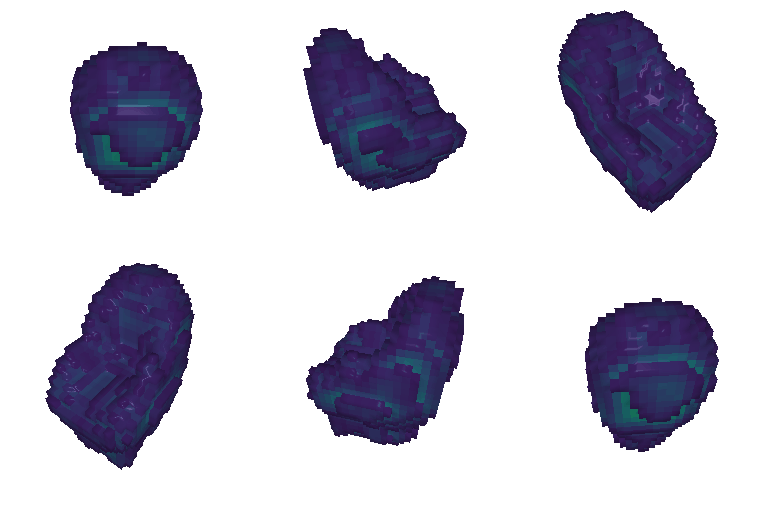
The voxel grid representation uses a hard 0.5 prob cutoff to decide what cells to fill. This obscures the details of how confident the model is. I want to manifest that uncertainty to better understand how the model handles the boundary, so I’m visualizing voxels colored by their predicted value.
| Example 1 | Example 2 | Example 3 | |
|---|---|---|---|
| Input | |
|
|
| Ground Truth | |
|
|
| Predict | |
|
|
| Predict prob, threshold = 0.5 | 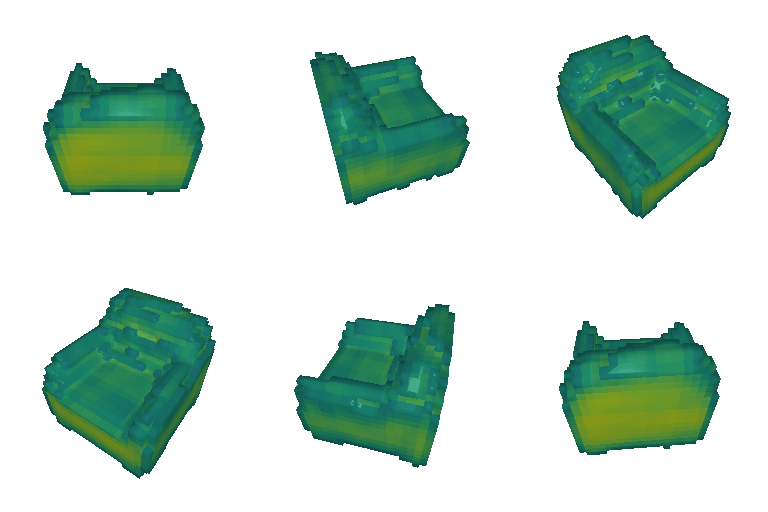 |
 |
 |
| Predict prob, threshold = 0.1 | 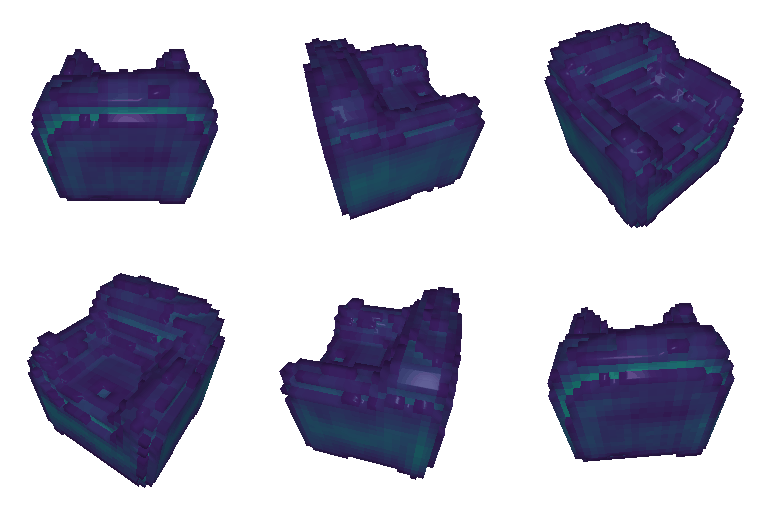 |
 |
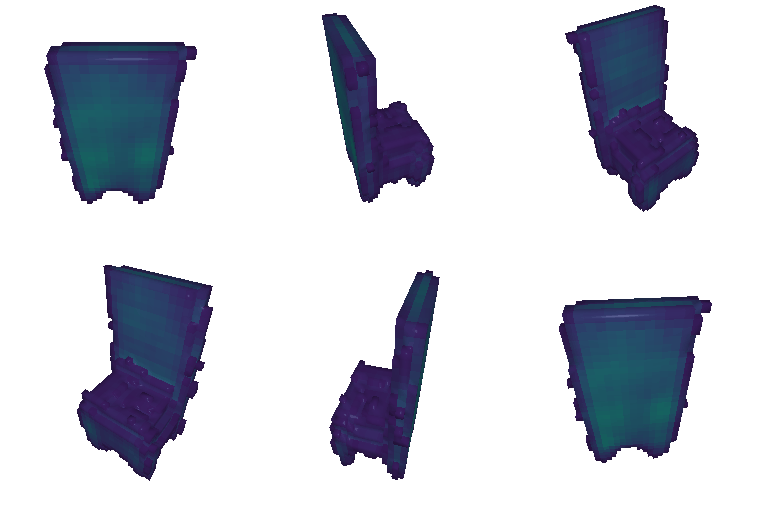 |
Voxels are colored so voxels predicted with low probability are dark purple, mid probability is green, and high probability yellow. My main takeaway here is that the model is learning much more of the chair shape than our threshold 0.5 prediction mesh shows, because the model lacks confidence. In particular, consider example three where the baseline predicted mesh shows little more than the chair backboard. We can see in the “Predict prob, threshold = 0.1” row that the model does predict the legs and seat (note: it looks so dark because we lowered the threshold so a lower probability shell is wrapping the higher probability core). It’s just not confident, which shows up as bloated legs, with probability dispersed over many cells so that no one cell is above the marching cubes threshold.
| Example 1 | Example 2 | Example 3 | F1@0.05 | |
|---|---|---|---|---|
| Input | |
|
|
|
| Ground Truth | |
|
|
|
| Predict (2.1) | |
|
|
60.743 |
| Predict (implicit) | 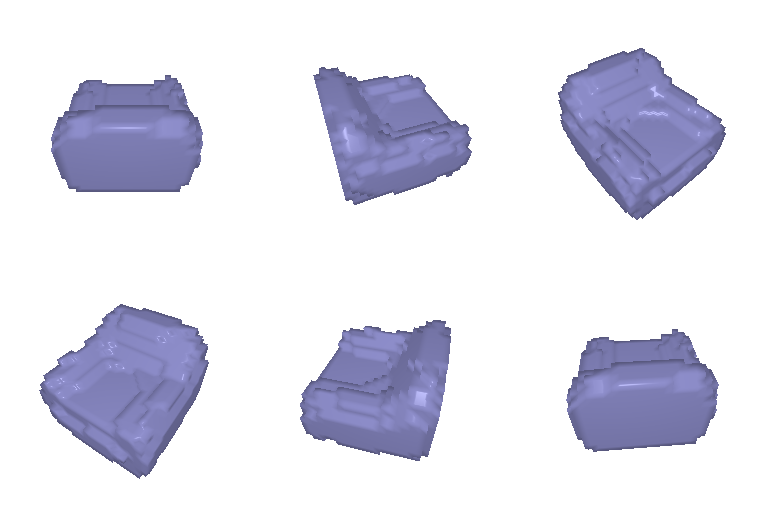 |
 |
 |
46.211 |
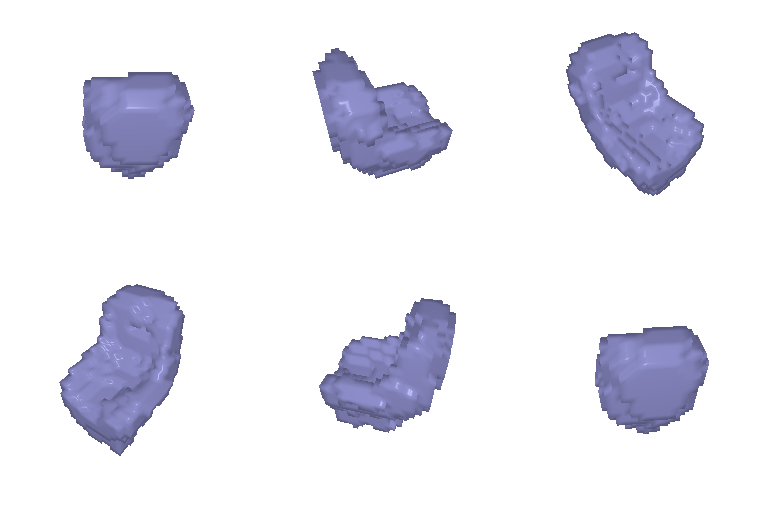
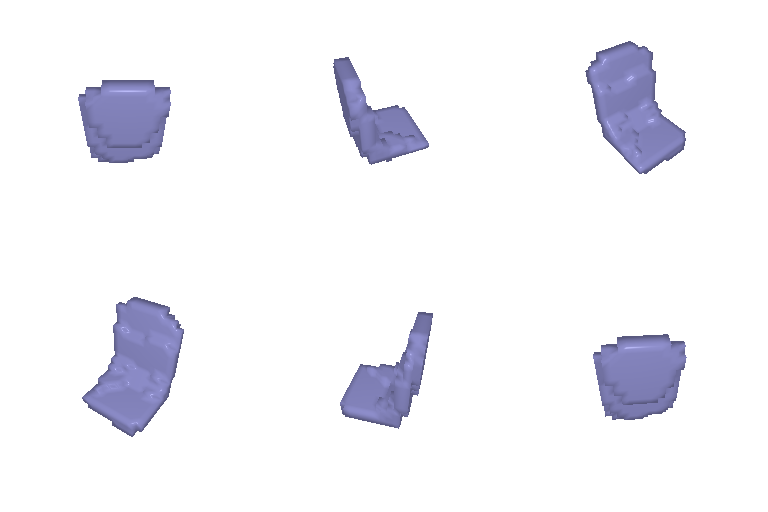
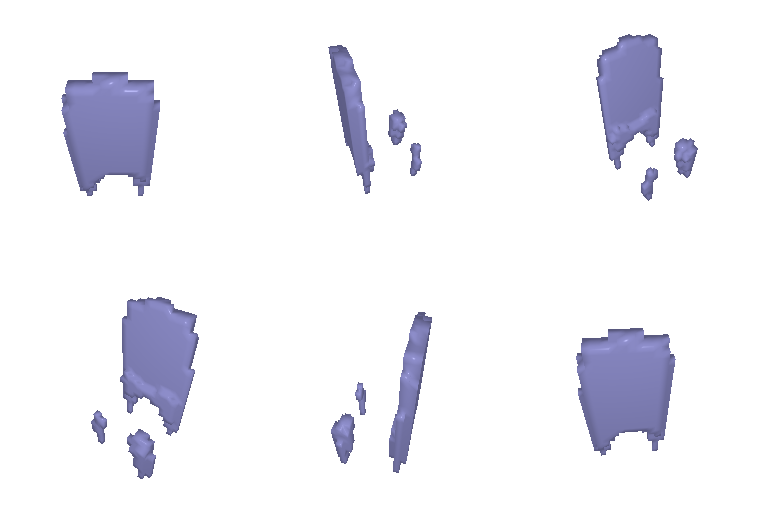
The network predicting the implicit function representation performs significantly worse than the baseline voxel prediction network (F1@0.05 of 46.211 vs. 60.743). This appears to be primarily due to the implicit representation predicting fewer filled voxels due to its network’s lower confidence in its predictions. The baseline voxel prediction network used convolutional layers which let it learn spatial patterns much more easily, so it makes sense it would perform so much better.
| Example 1 | Example 2 | Example 3 | F1@0.05 | |
|---|---|---|---|---|
| Input | |
|
|
|
| Ground Truth | |
|
|
|
| Predict (2.2) | |
|
|
80.974 |
| Predict (parametric) | 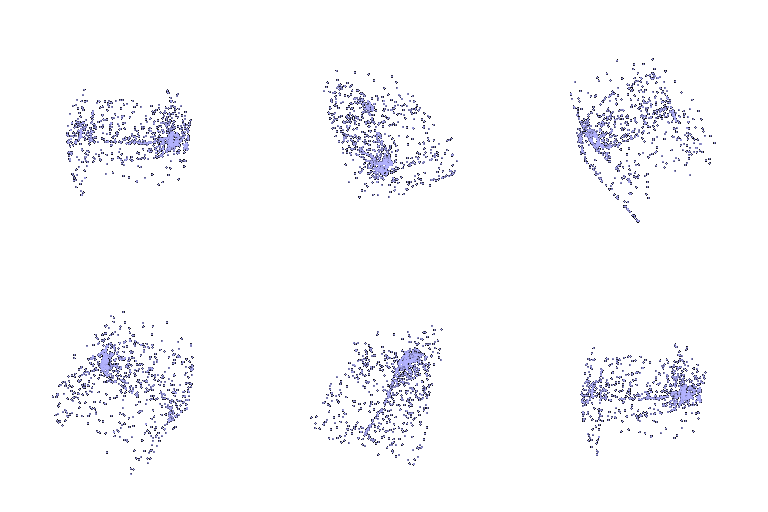 |
 |
 |
68.090 |
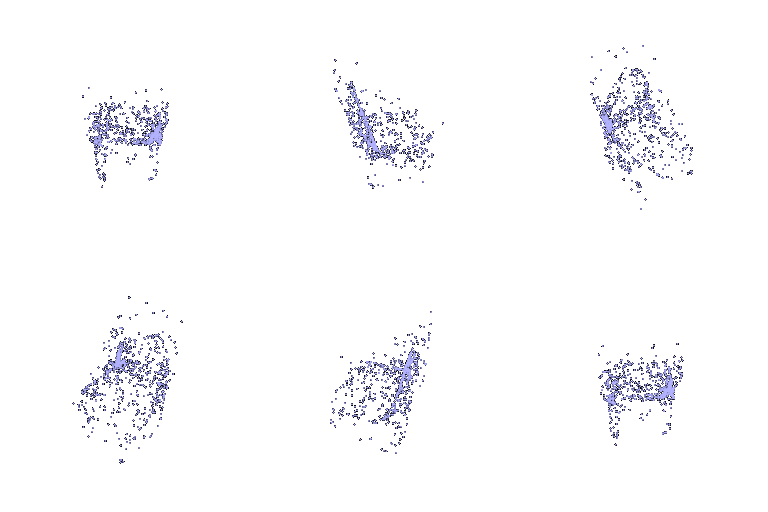
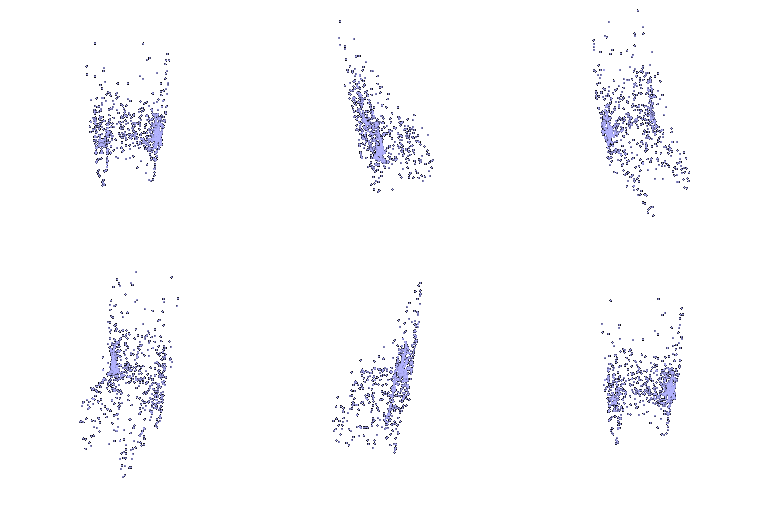
The network predicting the parametric function representation performs significantly worse than the baseline point cloud prediction network (F1@0.05 of 68.090 vs 80.974). The parametric function starts on a square domain, so it has a very difficult task of contorting that space around extremes shapes like a long leg, so it makes sense that the parametric function model would do so much worse.
| Example 1 | Example 2 | Example 3 | F1@0.05 on test chairs | |
|---|---|---|---|---|
| Input | |
|
|
|
| Ground Truth | |
|
|
|
| Predict (1 class) | |
|
|
73.966 |
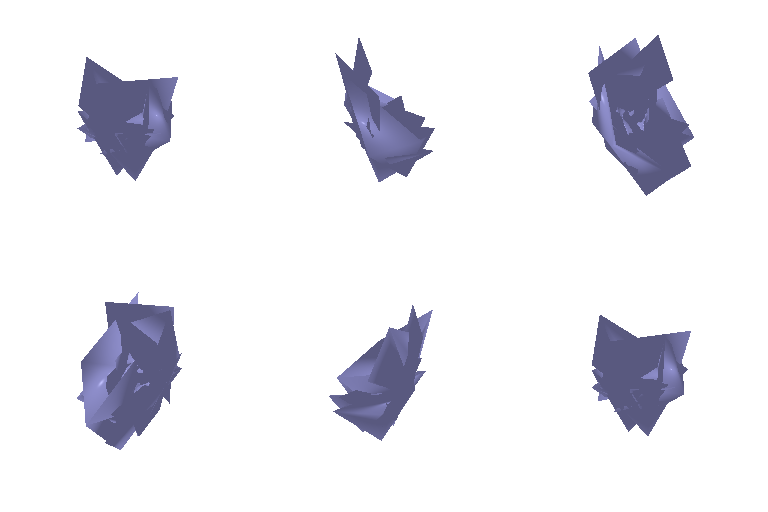
| Predict (3 classes) | 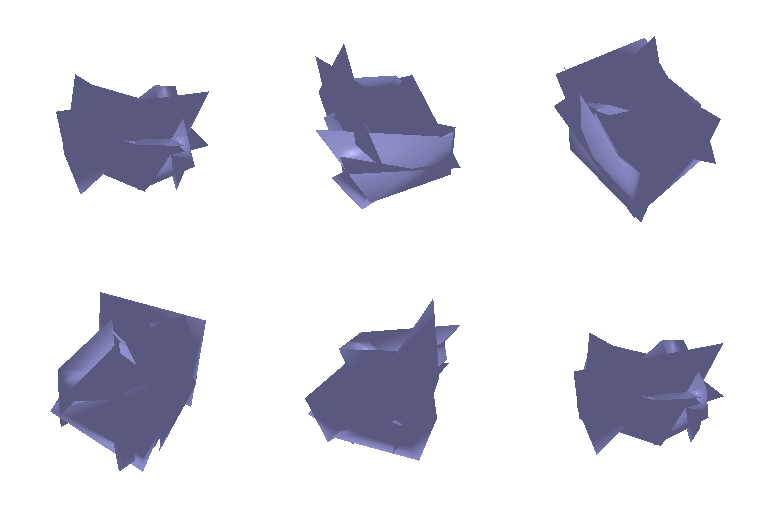 |
 |
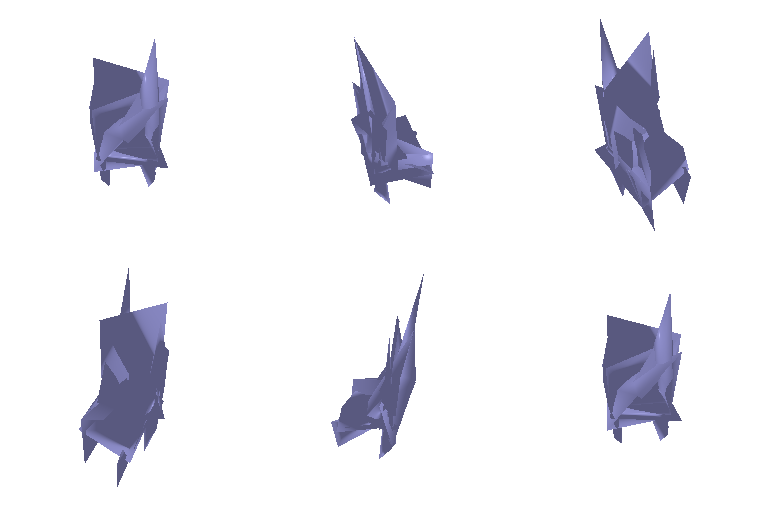 |
72.830 |
Remarkably, forcing the neural net to learn a wider range of representations doesn’t cause the F1@0.05 score on the test chairs to collapse. When trained on one class vs trained on 3 classes the F1 scores are nearly identical (73.966 vs 72.830). Qualitatively though, the meshes from the three-class model appear much spikier. Both training runs had ~10,000 iterations, which means with more classes, each individual chair was seen significantly fewer times. Perhaps reducing the chamfer loss (and thus increasing the F1 score) is an easier task than smoothing the surface, so reducing the chamfer loss with 3 classes is still within the network’s ability, but smoothing the surface is pushing the network to its limits. With that said, the predicted shape firmly does look like a chair, showing the model’s capable of generalizing across model classes.