1. Classifying whole objects
Each object has one label. A shared multilayer perceptron maps XYZ coordinates to point features. Taking the maximum over points gives a 192-dimensional shape descriptor that is independent of input order. The classification head applies softmax to its three scores. The largest probability determines whether the prediction is chair, vase, or lamp.
922 of 953 test objects classified correctly (96.75%). The confusion counts below group objects by their true class and show the prediction in each column.
Random test objects
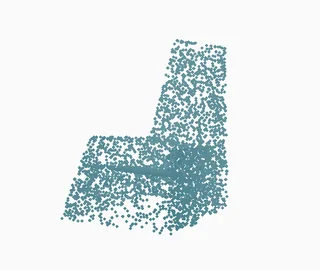
True chair · predicted chair
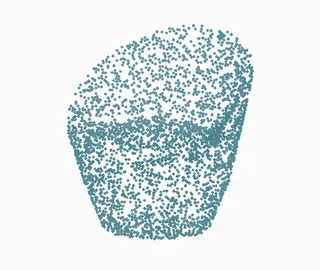
True chair · predicted chair
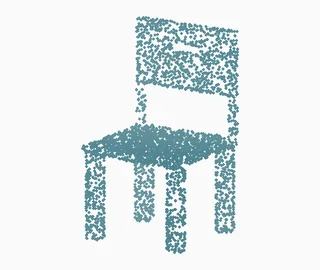
True chair · predicted chair
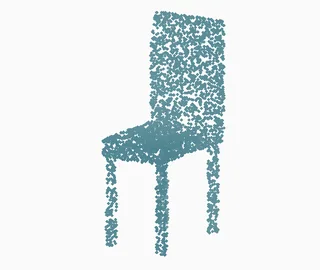
True chair · predicted chair

True lamp · predicted lamp
| True class | Chair | Vase | Lamp | Recall |
|---|---|---|---|---|
| Chair | 616 | 0 | 1 | 99.84% |
| Vase | 0 | 82 | 20 | 80.39% |
| Lamp | 1 | 9 | 224 | 95.73% |
The most frequent error was a vase classified as a lamp. This accounted for 20 of the 31 errors.
Classification errors
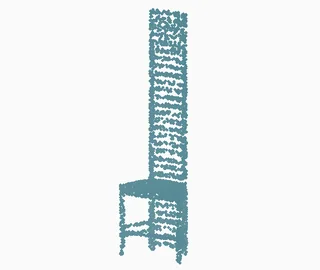
True chair · predicted lamp
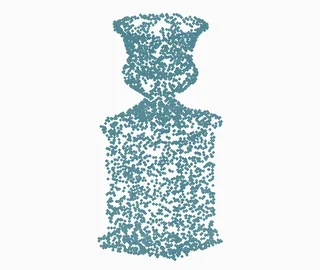
True vase · predicted lamp
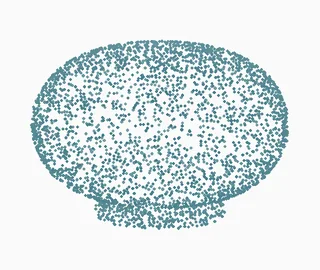
True lamp · predicted vase
Object 543, chair predicted as lamp. The short seat and legs occupy the bottom of a tall, narrow slatted frame. The overall silhouette resembles a floor lamp, even though the seat is visible in the lower third. This confusion occurred on 1 of the 617 test chairs.
Object 650, vase predicted as lamp. A small flared vessel sits on a much broader pedestal. The narrow connection between these pieces gives it the base-and-shade profile of a lamp. This confusion occurred on 20 of the 102 test vases.
Object 883, lamp predicted as vase. The lamp has a broad rounded body and a shallow foot. Its point cloud has few visible cues that would distinguish it from a squat vase. This confusion occurred on 9 of the 234 test lamps.
2. Labeling chair parts
The segmentation head combines a 64-dimensional feature at each point with the shared global shape descriptor. It assigns each point one of six part IDs. The same colors identify the same IDs in every figure.
5,533,222 of 6,170,000 test points labeled correctly (89.68%). The denominator includes all points evaluated across 617 chairs.
- Part 0
- Part 1
- Part 2
- Part 3
- Part 4
- Part 5
Overall accuracy gives the most common chair parts the greatest weight. The least frequent label, part 1, accounts for 7,865 points (0.13% of the split). The model recovered 0 of them. Of the mistakes on this label, 7,865 were assigned to part 2.
The first three chairs fall near the 25th, 50th and 75th percentiles of baseline object accuracy. The final two have the lowest baseline accuracies on the test split.
Chair 119

Ground truth

86.00% correct
The most frequent error was part 5 labeled as part 4, accounting for 805 of 1,400 incorrect points. The predicted back is uniformly blue and the legs are uniformly purple. The reference places some gold points on both structures, which explains much of the disagreement despite their similar outlines.
Rotate chair 119 and compare labels

Chair 385

Ground truth

92.92% correct
The most frequent error was part 5 labeled as part 2, accounting for 294 of 708 incorrect points. Both labelings recover the back, armrests and slender legs. Disagreement concentrates where the blue and green panels meet the gold seat.
Rotate chair 385 and compare labels

Chair 613

Ground truth

96.33% correct
The most frequent error was part 4 labeled as part 5, accounting for 187 of 367 incorrect points. The back, seat and four separated legs line up in both views. Some support points near the seat are absorbed into the gold region, leaving the long exposed parts of the legs correctly labeled.
Rotate chair 613 and compare labels

Chair 351 · low accuracy

Ground truth

40.56% correct
The most frequent error was part 3 labeled as part 4, accounting for 2,194 of 5,944 incorrect points. The reference sides extend almost continuously to the floor in green. PointNet assigns a broad purple support region across the lower chair, even though the reference has no part-4 points on this object.
Rotate chair 351 and compare labels

Chair 235 · low accuracy

Ground truth

51.56% correct
The most frequent error was part 3 labeled as part 5, accounting for 2,343 of 4,844 incorrect points. The chair has a low, wraparound side that blends into the seat. PointNet extends the gold region into points labeled green in the reference, especially toward the front and center.
Rotate chair 235 and compare labels

3. Robustness to input changes
Both experiments hold the trained PointNet weights fixed and use the same test objects as the clean run. The tables report accuracy and the change from clean input in percentage points (pp).
Tilting objects
Rotate each point cloud by 30° or 90° around its X axis. The ground-truth object class and part IDs travel with the points. The camera in the comparison figures stays fixed.
| Condition | Class acc. | Δ pp | Part acc. | Δ pp |
|---|---|---|---|---|
| Clean | 96.75% | 0.00 | 89.68% | 0.00 |
| 30° rotation | 46.80% | −49.95 | 70.26% | −19.42 |
| 90° rotation | 25.39% | −71.35 | 23.24% | −66.44 |
At 90° rotation, classification accuracy fell by 71.35 percentage points and segmentation accuracy fell by 66.44 percentage points. Rotation changes the axes seen by the shared point encoder. Max pooling makes its output independent of point order, but the input features still depend on orientation.
Among the same 953 objects, 687 formerly correct classifications became incorrect and 7 formerly incorrect classifications became correct. Chair recall fell the most. The clean model recognized 616 of 617 chairs and recognized 0 after the tilt.
Classification object 520
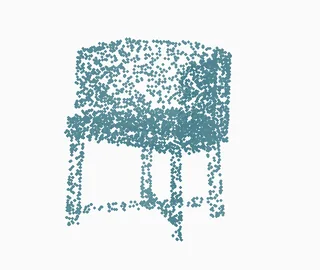
True chair · predicted chair
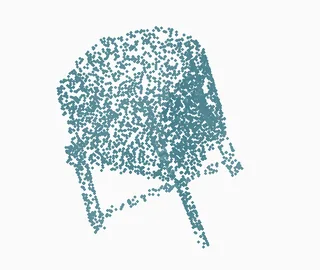
True chair · predicted chair
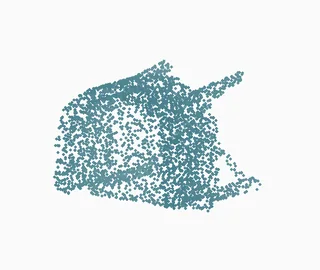
True chair · predicted vase
Classification object 702
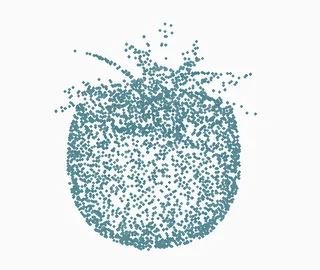
True vase · predicted vase
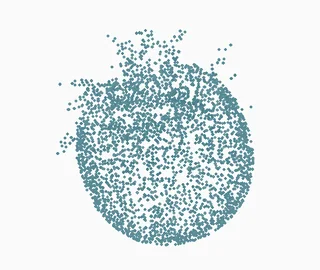
True vase · predicted vase
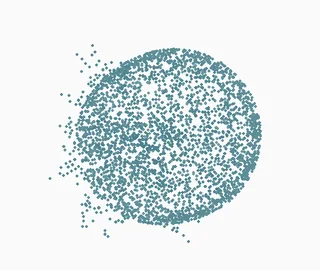
True vase · predicted vase
Segmentation chair 351
40.56% correct

52.48% correct

59.82% correct
Segmentation chair 385
92.92% correct

64.47% correct

11.15% correct
Reducing the point count
Uniformly sample 256 points per object without replacement, then take a nested subset of 64. A seeded draw keeps the examples paired. Part accuracy is measured on the retained points.
| Condition | Class acc. | Δ pp | Part acc. | Δ pp |
|---|---|---|---|---|
| Clean | 96.75% | 0.00 | 89.68% | 0.00 |
| 256 points | 95.17% | −1.57 | 87.94% | −1.74 |
| 64 points | 92.24% | −4.51 | 81.30% | −8.38 |
At 64 points, classification accuracy fell by 4.51 percentage points and segmentation accuracy fell by 8.38 percentage points. Subsampling changes which points can contribute a maximum to the global descriptor. For segmentation, the score also depends on which labeled parts remain in the sample.
On precisely the 64 retained points per chair, the full-input model had already achieved 89.47% accuracy. Recomputing predictions with only those same 64 points changed their accuracy by −8.17 pp. This comparison holds the scored labels fixed while changing the context available to the model.
Classification object 520
True chair · predicted chair
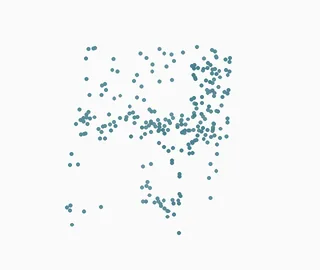
True chair · predicted chair
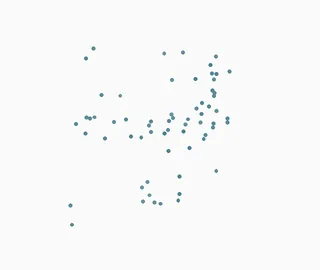
True chair · predicted chair
Classification object 702
True vase · predicted vase
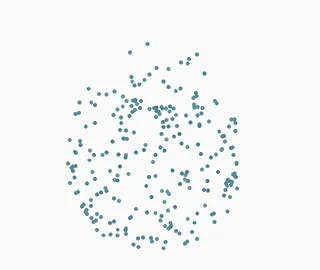
True vase · predicted vase
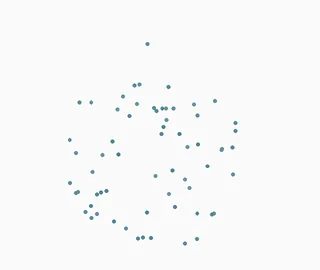
True vase · predicted lamp
Segmentation chair 351
40.56% correct

43.36% correct

45.31% correct
Segmentation chair 385
92.92% correct

93.75% correct

89.06% correct
4. Adding local neighborhoods
Two voxel grids, with eight then four cells per axis, group neighboring points in normalized coordinates. Within each occupied cell the network pools mean features and computes a centroid. Each point receives the pooled feature and its offset from that centroid through a residual update. The later pooling and task heads follow the PointNet design.
| Condition | Class acc. | Δ pp | Part acc. | Δ pp |
|---|---|---|---|---|
| Clean | 96.75% | 0.00 | 89.68% | 0.00 |
| Voxel neighborhoods | 96.12% | −0.63 | 89.76% | +0.08 |
On the clean test set, classification accuracy fell by 0.63 percentage points and segmentation accuracy rose by 0.08 percentage points with the voxel model. Among the same 953 objects, 12 formerly correct classifications became incorrect and 6 formerly incorrect classifications became correct. These are single training runs for each architecture. Both the neighborhood information and the added trainable layers can contribute to the difference.
Of the chairs compared below, chair 351 shows the largest individual change. Its accuracy moved from 40.56% to 57.67% on exactly the same labeled points.
Classification object 650
True vase · predicted lamp
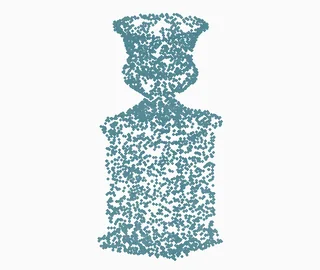
True vase · predicted vase
Classification object 520
True chair · predicted chair
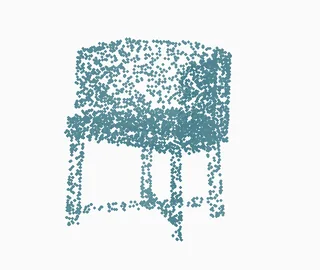
True chair · predicted chair
Classification object 702
True vase · predicted vase
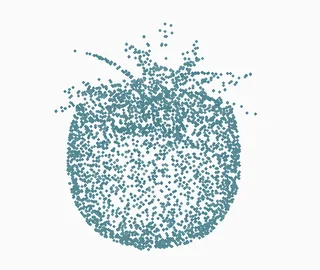
True vase · predicted vase
Classification object 821
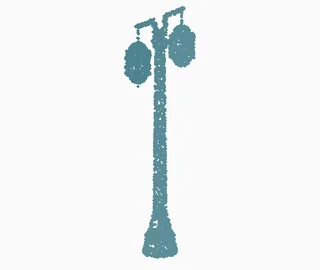
True lamp · predicted lamp

True lamp · predicted lamp
Segmentation chair 351
40.56% correct

57.67% correct
Segmentation chair 385
92.92% correct

93.21% correct
Segmentation chair 613
96.33% correct

96.75% correct
Reproduction and checks
Training holds out whole objects from the official training split for checkpoint selection. The final test split supplies the reported accuracies. Classification weights each object equally. Segmentation weights each evaluated point equally. Every displayed ID is its row in the official test array. The clean evaluation uses 10,000 points per object and sample selection uses seed 825.
| Task | Model | Train / val. shapes | Train points | Epochs | Selected epoch | Val. acc. |
|---|---|---|---|---|---|---|
| Classification | PointNet | 6,106 / 678 | 1,024 | 50 | 32 | 97.49% |
| Classification | Voxel model | 6,106 / 678 | 1,024 | 50 | 15 | 97.35% |
| Segmentation | PointNet | 4,040 / 449 | 1,024 | 50 | 49 | 89.62% |
| Segmentation | Voxel model | 4,040 / 449 | 1,024 | 50 | 42 | 89.86% |
The figures use a common camera and colors. Dense static views display a deterministic sample of at most 3,200 points for legibility. Captions and tables use the full evaluated inputs. The rotating pairs show ground truth on the left and prediction on the right.
From the code archive, rebuild the report from the saved predictions and check its figures and metrics:
python main.py report
python main.py verify --offline
Machine-readable scores, confusion matrices, and sample selections are available in the accompanying evaluation data. Measured results (JSON)
Course starter and assignment brief · Course point-cloud data · PointNet paper