1. Classification Model
Test accuracy: 97.38% (928 of 953 objects).
| Class | Correct / total | Accuracy |
|---|---|---|
| Chair | 616 / 617 | 99.8% |
| Vase | 93 / 102 | 91.2% |
| Lamp | 219 / 234 | 93.6% |
Random test point clouds
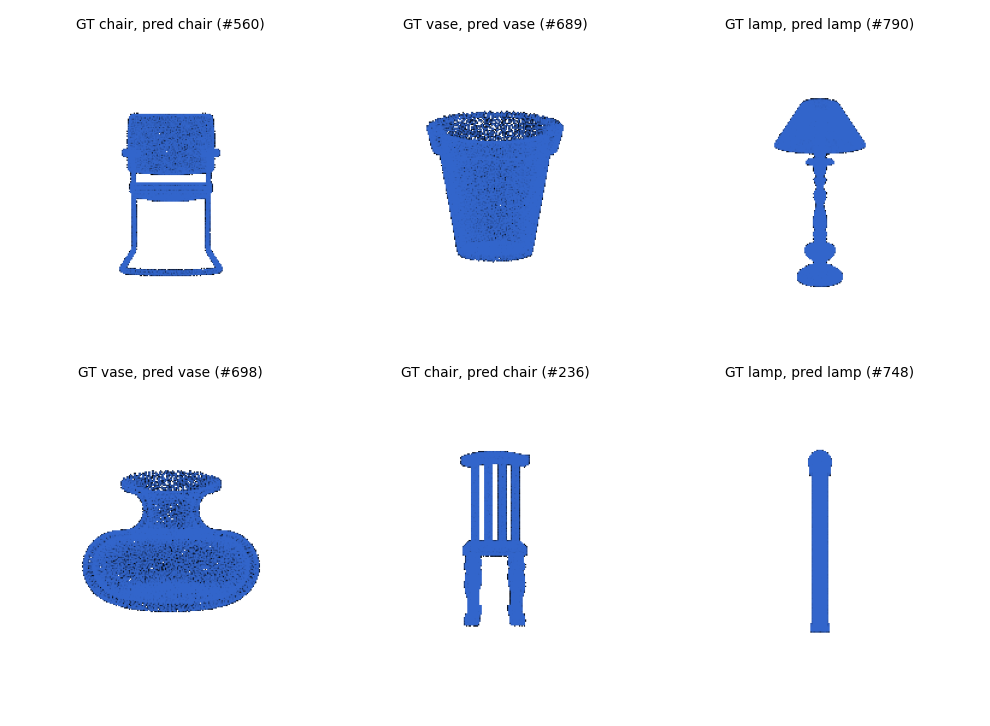
Failure cases

Interpretation.
- Chair predicted as lamp. This chair is a solid block with two short legs. It has no separate seat and back, so it looks like a lamp.
- Vase predicted as lamp. This vase is a plain cylinder with a rim and a flat base, which indeed looks like a lamp.
- Lamp predicted as vase. This lamp has a solid cylinder on top of thin legs. The cylinder is close to a vase shape. Most mistakes are between vases and lamps, which are both tall and symmetric. Chairs are rarely predicted wrong.
2. Segmentation Model
Test accuracy: 90.84%
Visualizations
Each row shows ground truth (left) and prediction (right). Objects 133, 499 and 592 are random good cases; objects 351 and 26 are bad cases.
| Test object | Accuracy |
|---|---|
| #133 | 97.6% |
| #499 | 98.0% |
| #592 | 97.5% |
| #351 (bad) | 46.4% |
| #26 (bad) | 48.1% |
#133 — 97.6%


#499 — 98.0%


#592 — 97.5%


#351 — 46.4% (bad)


#26 — 48.1% (bad)


Interpretation.
- Good cases. These are ordinary chairs with a back, a seat and four legs. Each part is a separate region and the model gets almost every point right.
- Bad cases. #351 is a round chair, and #26 is a wide sofa-chair with a separate piece on the side. In both, the back, arms and seat have no clear boundary. The model mixes up these parts. Errors are mostly on unusual shapes. The model has to guess the part from the global shape and each point's position.
3. Robustness Analysis
Experiment 1: Rotation
Rotate every test object around the x axis by 15° to 90° and run the models from Q1 and Q2.
| Rotation | 0° | 15° | 30° | 45° | 60° | 90° |
|---|---|---|---|---|---|---|
| Classification accuracy | 97.4% | 95.3% | 85.2% | 53.1% | 35.3% | 29.1% |
| Segmentation accuracy | 90.8% | 84.5% | 72.3% | 59.4% | 41.0% | 26.6% |
Classification samples

Segmentation samples

Interpretation. Classification is fine up to 15° and fails quickly after 30°. Segmentation already loses at 15°. The predictions at 90° are mostly wrong for both objects. PointNet uses the raw xyz coordinates and has never seen rotated objects and rotated chair looks like a new shape.
Experiment 2: Number of points
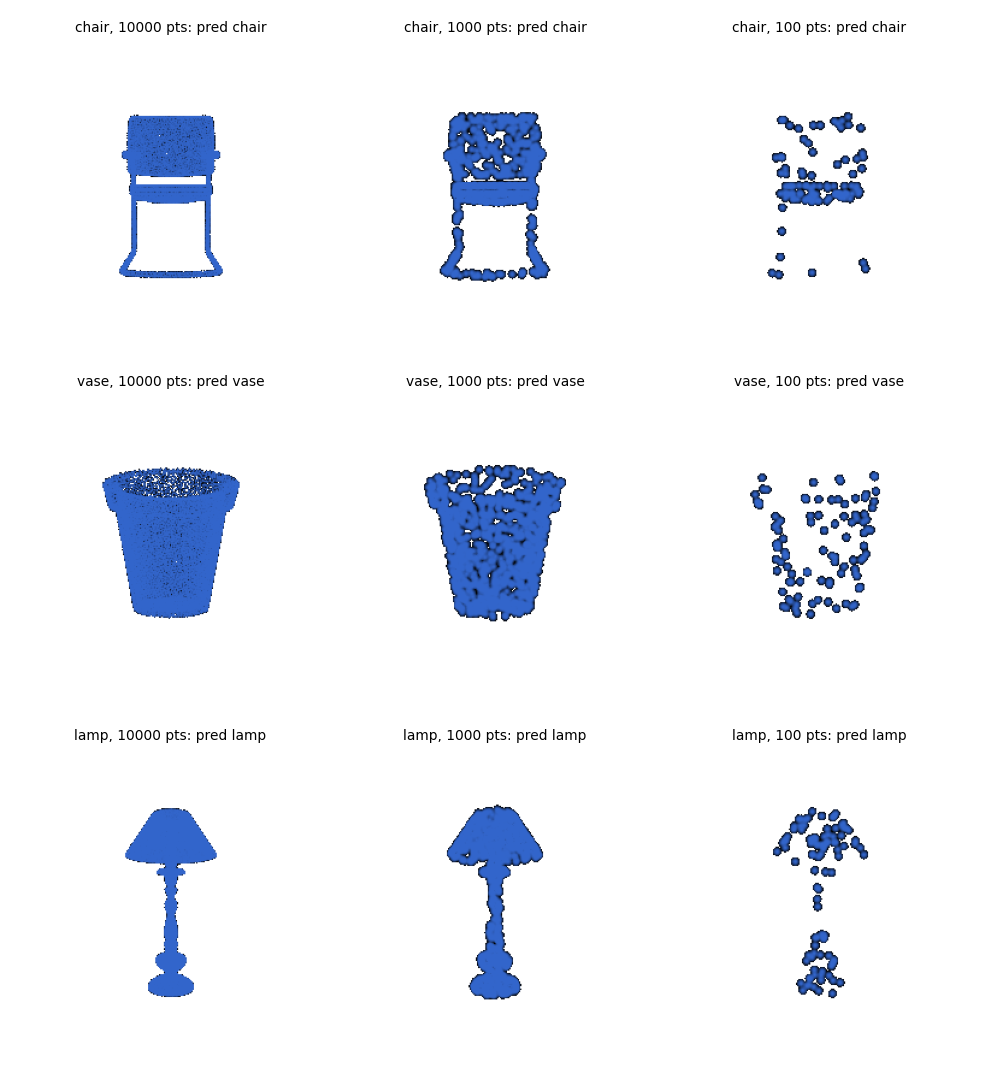
Randomly keep 5000, 1000, 500 or 100 of the 10,000 points of each test object and run the same models. Each number is the average of 3 random draws.
| Points | 10000 | 5000 | 1000 | 500 | 100 |
|---|---|---|---|---|---|
| Classification accuracy | 97.4% | 97.3% | 97.2% | 96.9% | 92.9% |
| Segmentation accuracy | 90.8% | 90.8% | 89.9% | 88.3% | 81.4% |
Classification samples
Segmentation samples
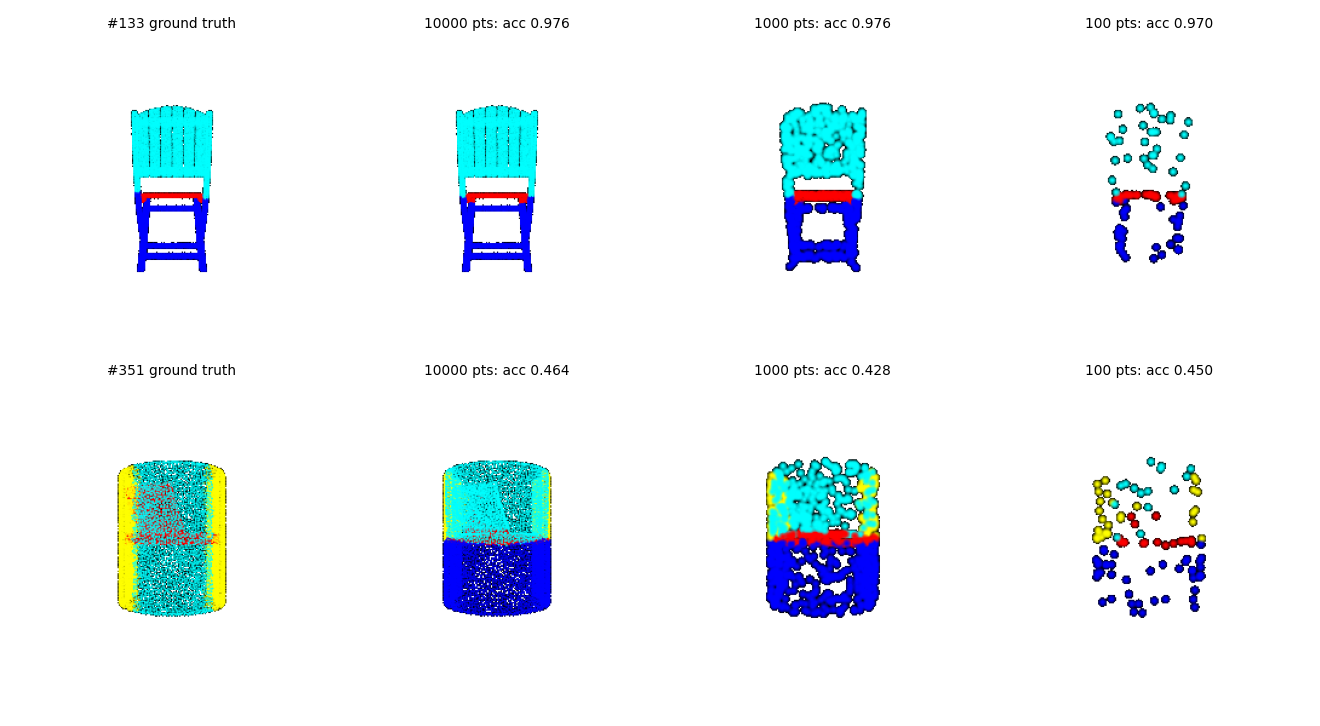
Interpretation. Both models are stable down to 500 points and only drop at 100 points. Max pooling over the points only needs enough points to cover the overall shape. At 100 points, thin parts such as legs and stems are often missed, and the shape is harder to recognize. Segmentation drops more than classification, probably because each point label depends on the part around that point, and with 100 points there are too few neighbors.
4. Bonus: Locality (DGCNN)
Model. DGCNN. Each EdgeConv layer finds the 20 nearest neighbors of every point and applies an MLP to the feature differences to those neighbors. The neighbors are recomputed in feature space at every layer. Classification uses 4 EdgeConv layers and pooling (max and mean) over points. Segmentation uses 3 EdgeConv layers and concatenates a global feature.
Training. Finding neighbors among 10,000 points is too expensive, so each batch uses 1024 random points per object. At test time, each object is randomly split into chunks of 1024 points. For classification, the logits of all chunks are averaged. For segmentation, each chunk is labeled separately, so every one of the 10,000 points gets a label.
| Model | Classification accuracy | Segmentation accuracy |
|---|---|---|
| PointNet (Q1, Q2) | 97.38% | 90.84% |
| DGCNN | 98.64% | 91.20% |
Classification

Segmentation

Interpretation.
-
Segmentation is about the same. Classification improves with DGCNN. I expected local neighbors to help more, since part labels depend on local shape. DGCNN also seems more robust to rotation. For small tilts its segmentation is better (79% vs. 72% at 30°). However, with 100 points, its classification accuracy falls to 27% (PointNet 93%), because 20 neighbors among 100 points cover a much larger area than during training. The model sees a very different shape and fails to classify it.