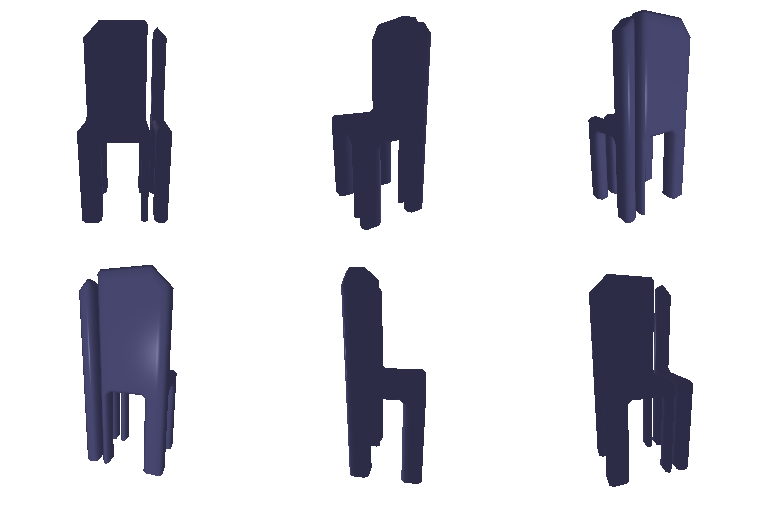
--load_feat). The 3.3 three-class model is the exception: it is trained end-to-end from images.1.1 Fitting a Voxel Grid

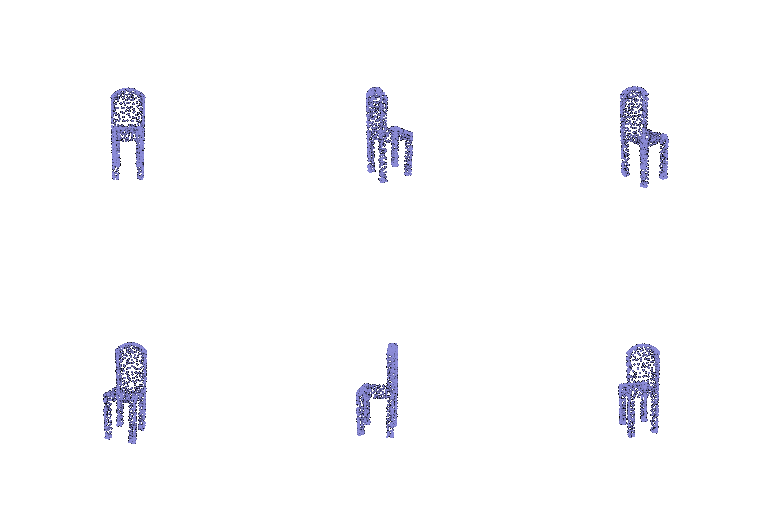
1.2 Fitting a Point Cloud

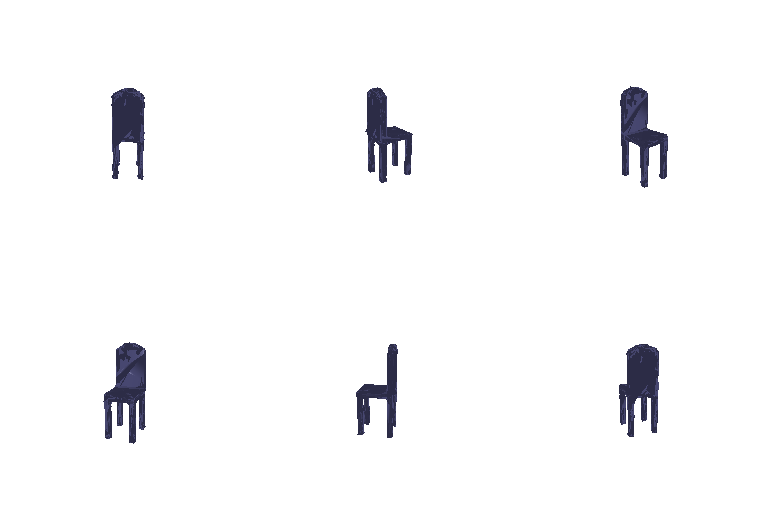
1.3 Fitting a Mesh

2.1 Image to Voxel Grid

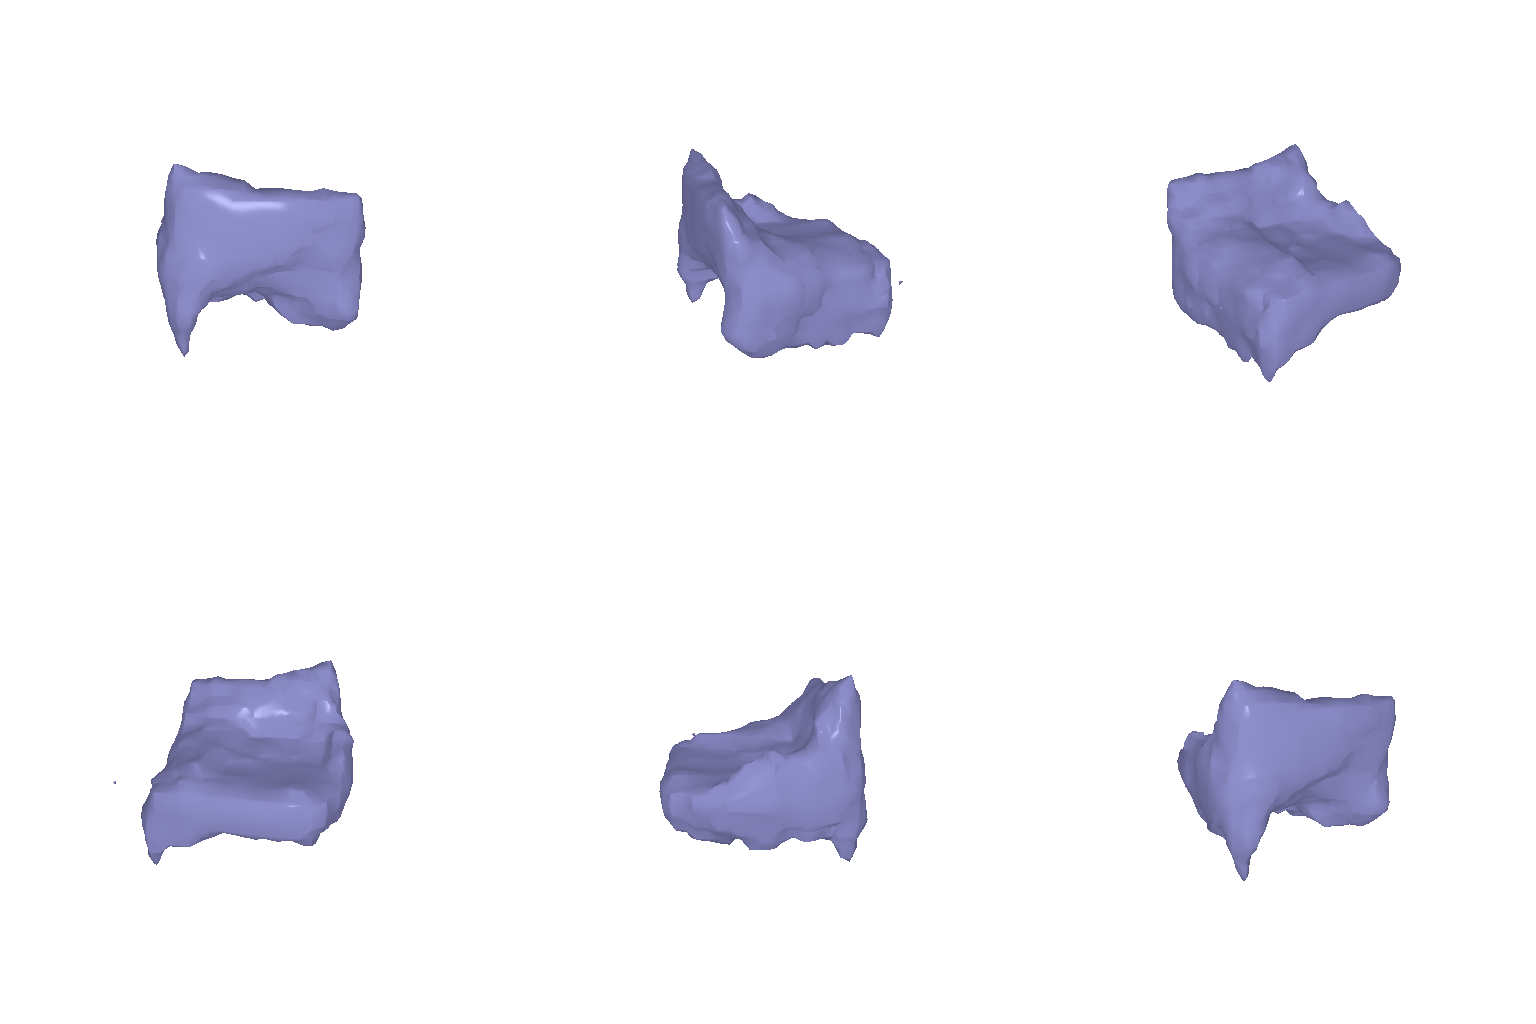
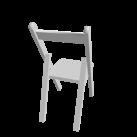

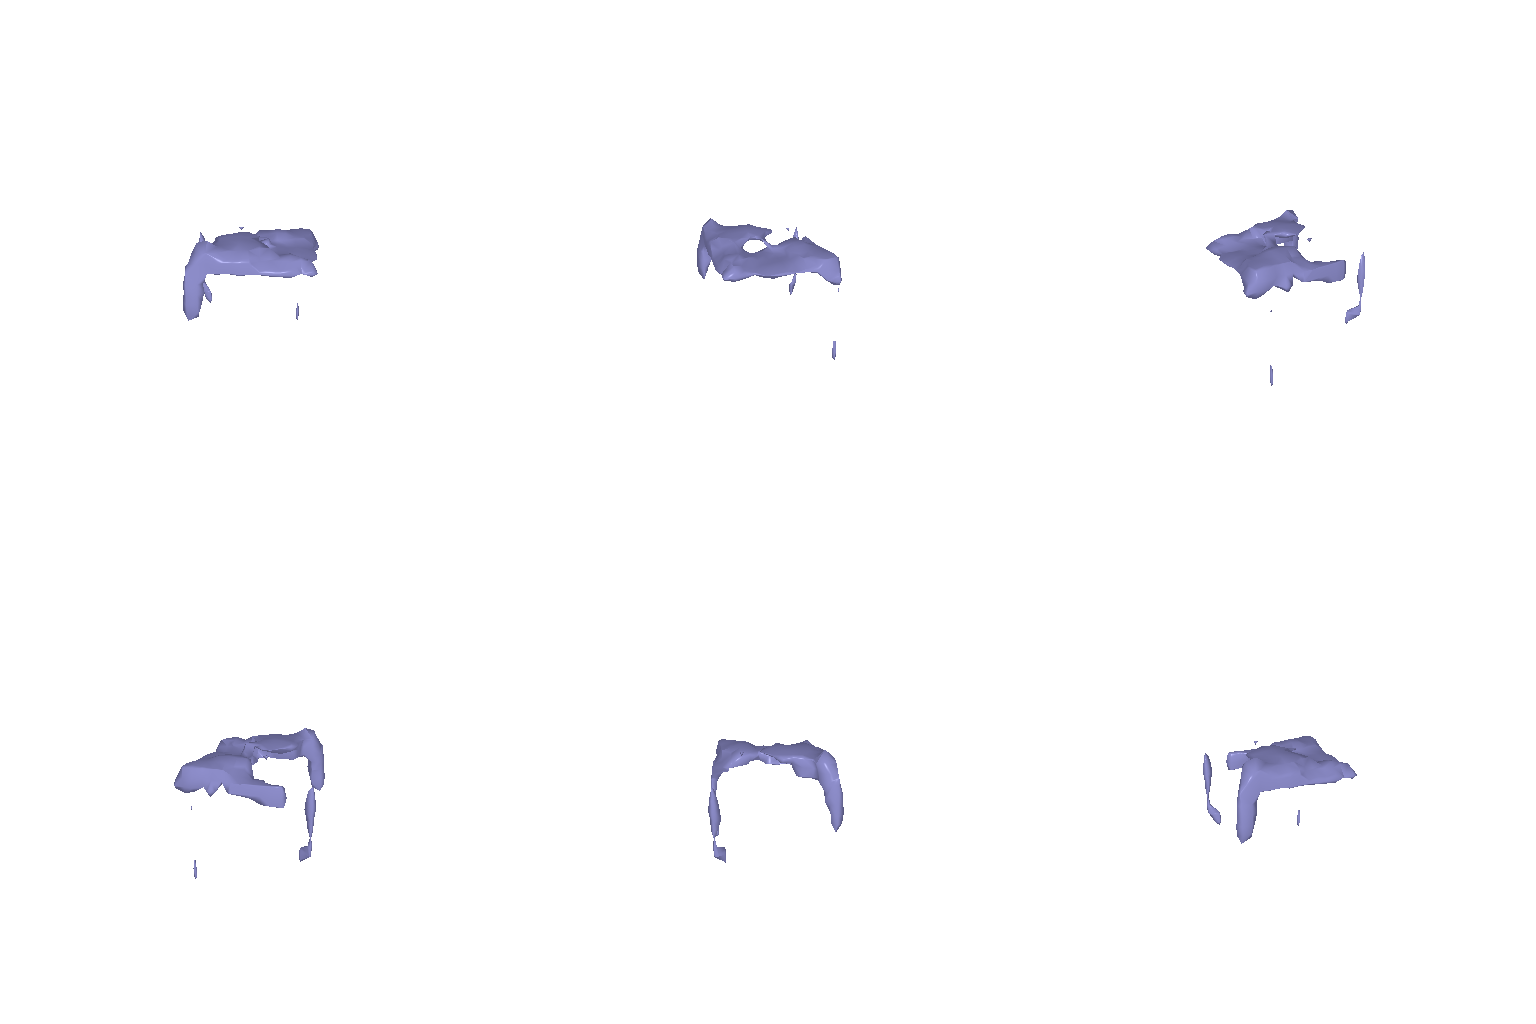
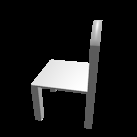

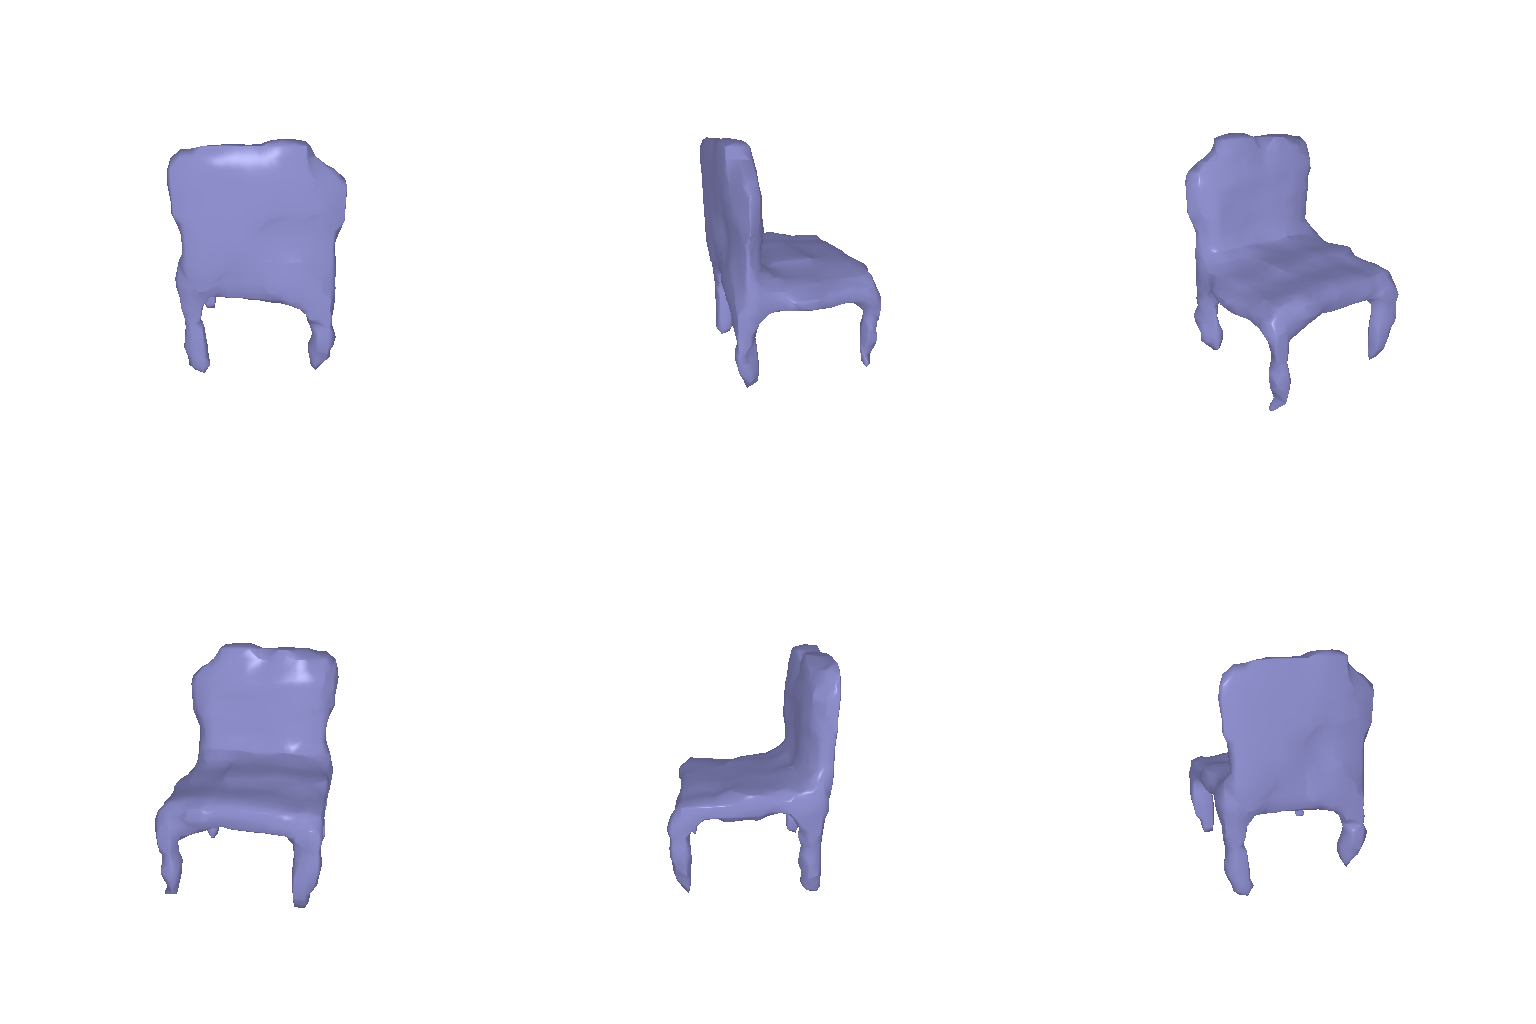
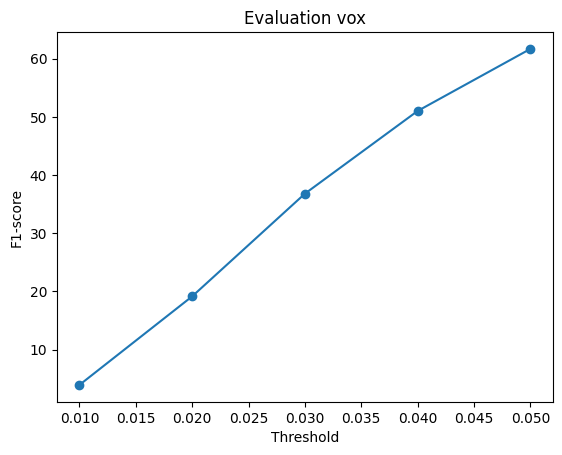
F1@0.05: 61.860
2.2 Image to Point Cloud
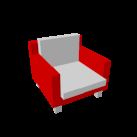
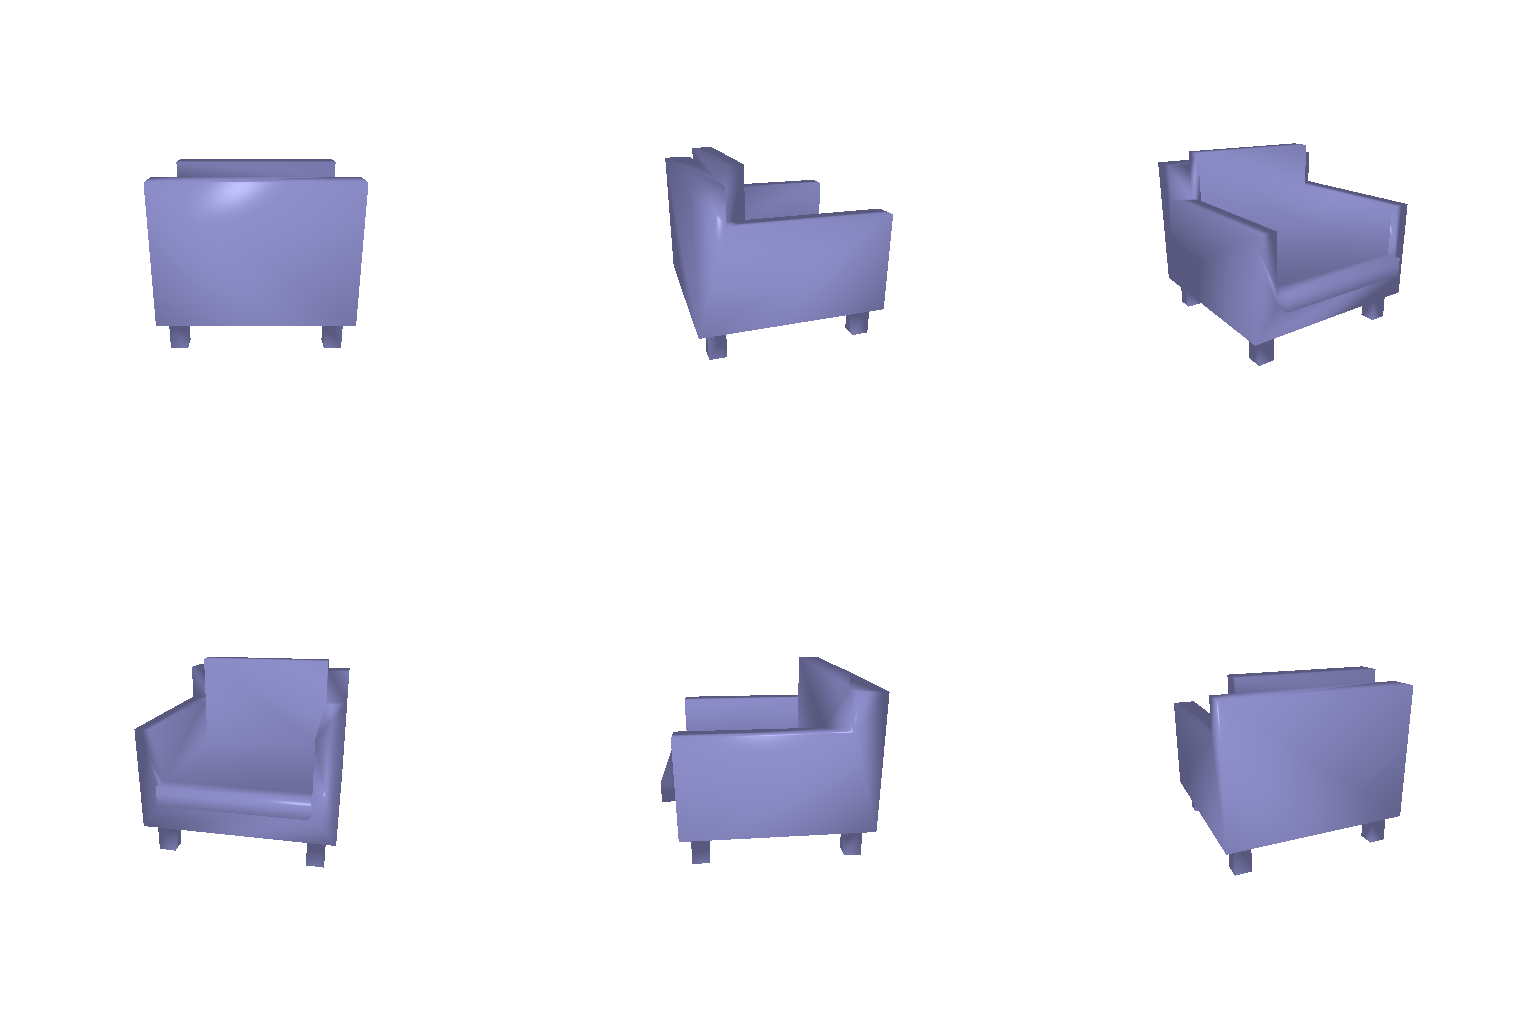
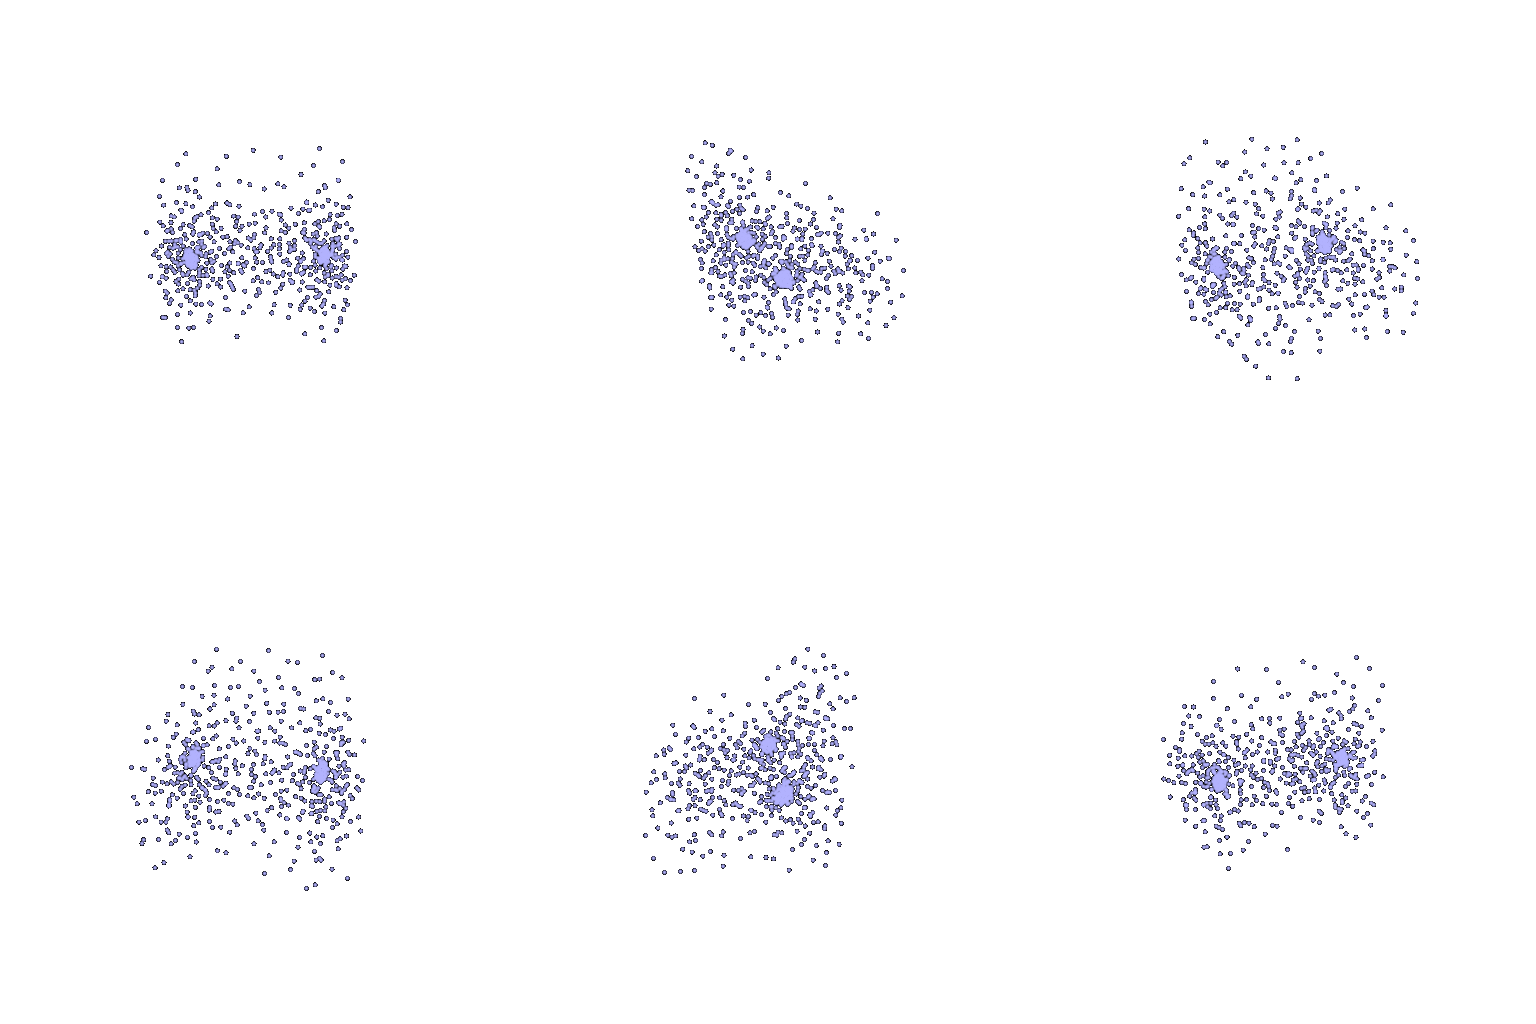
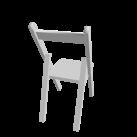
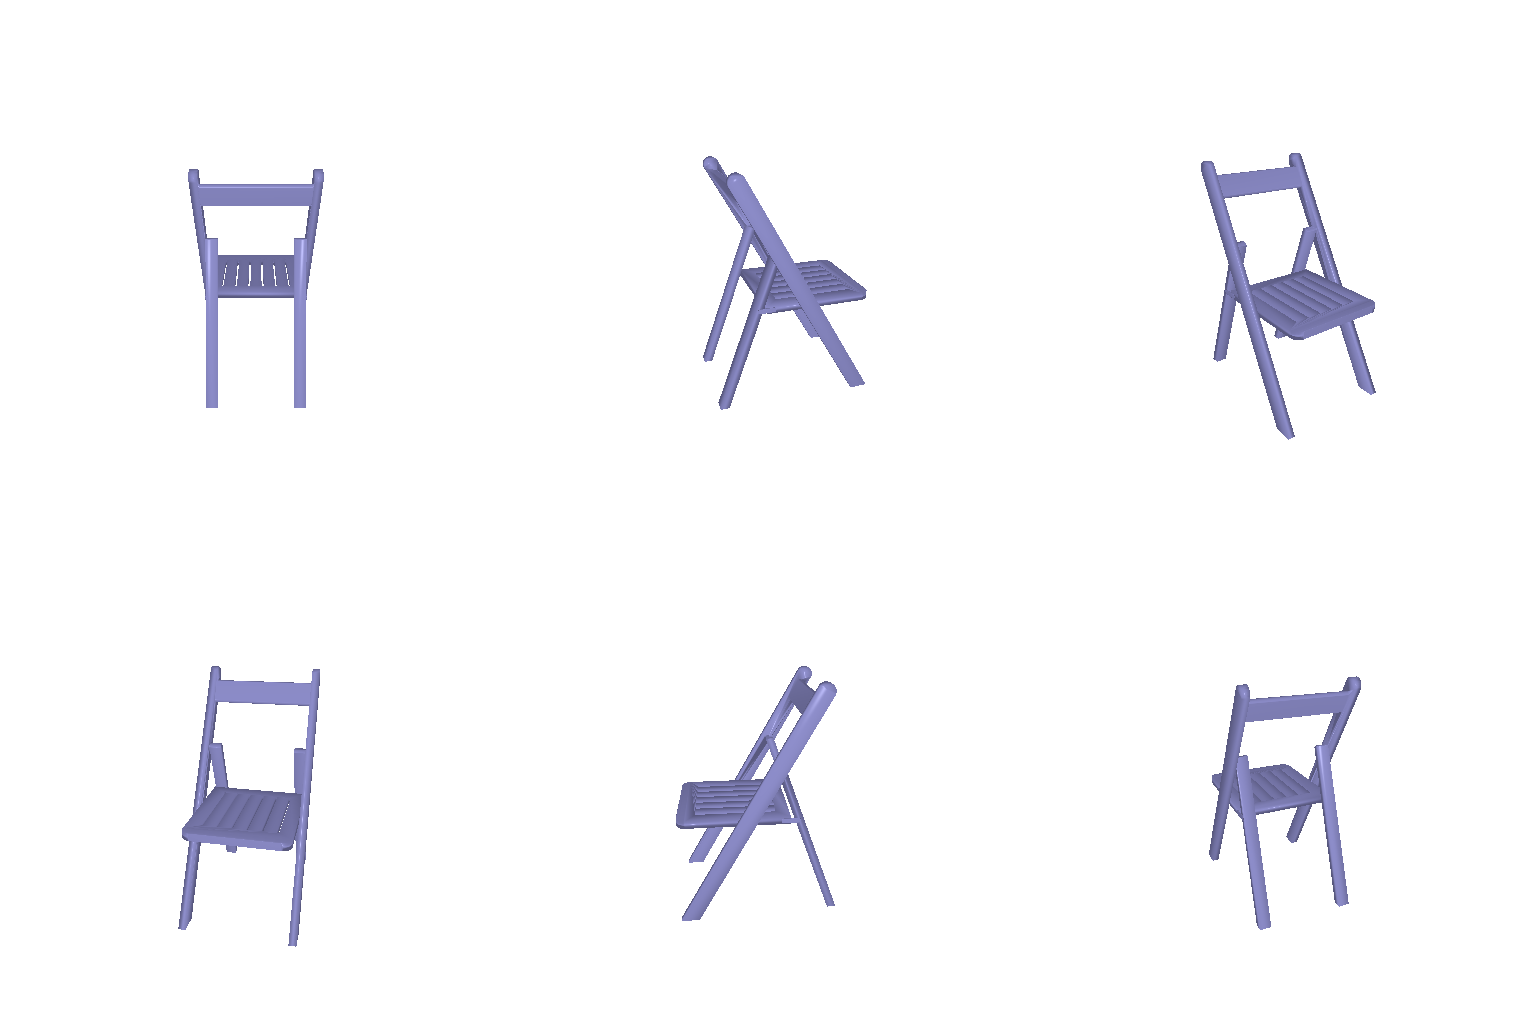
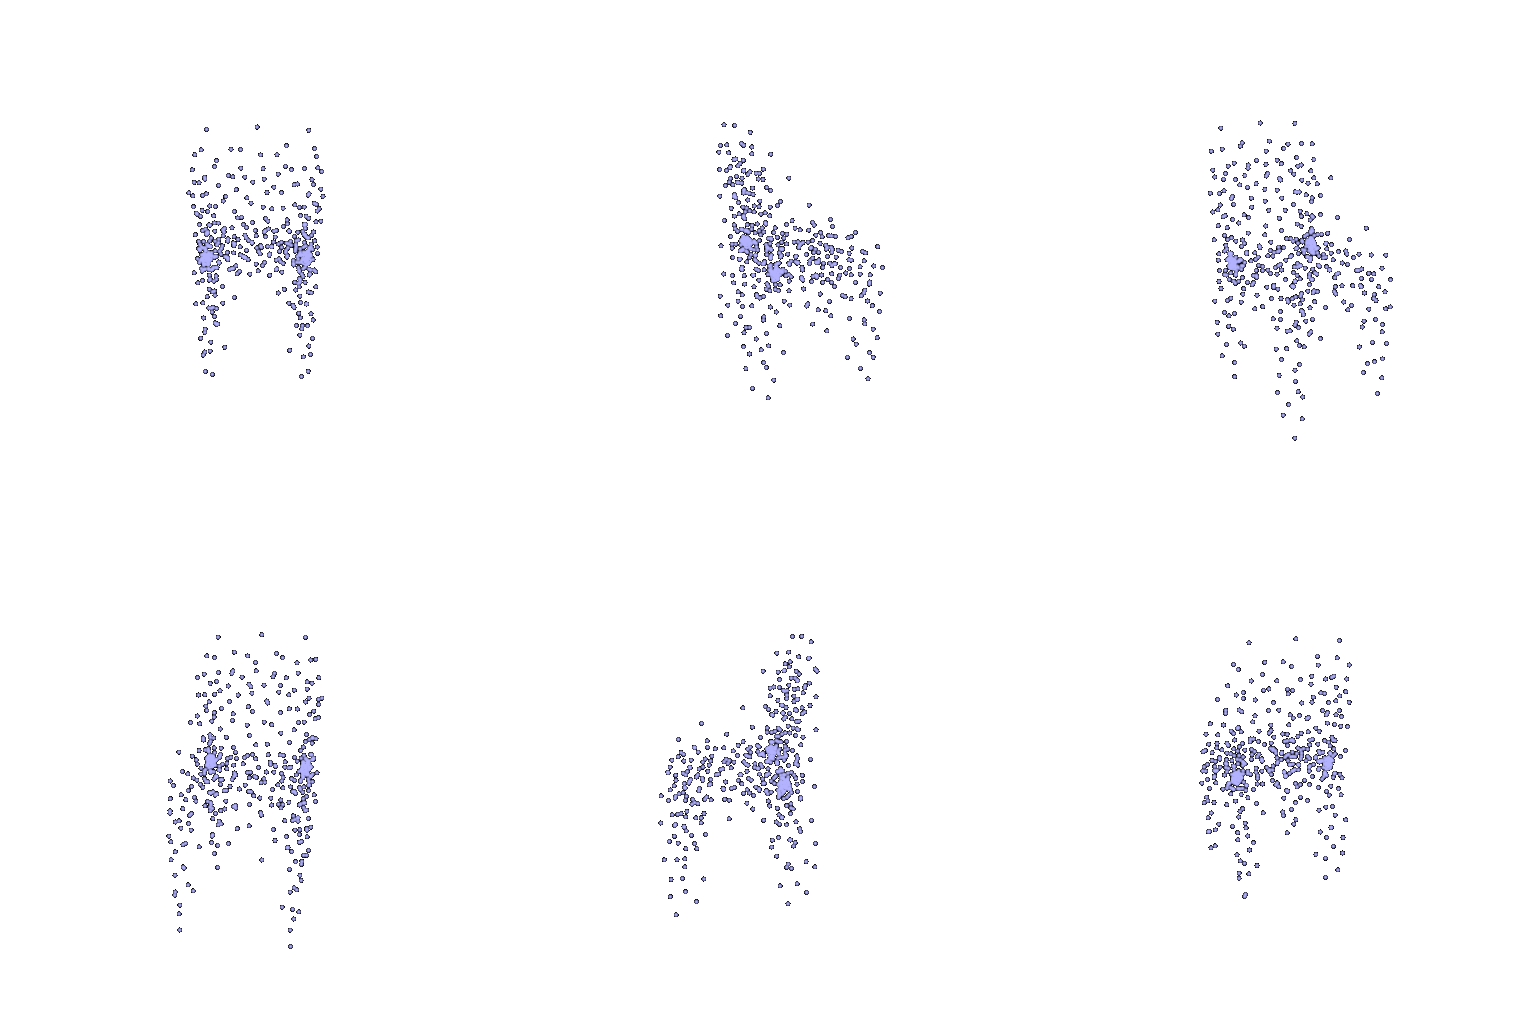
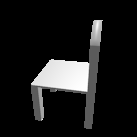
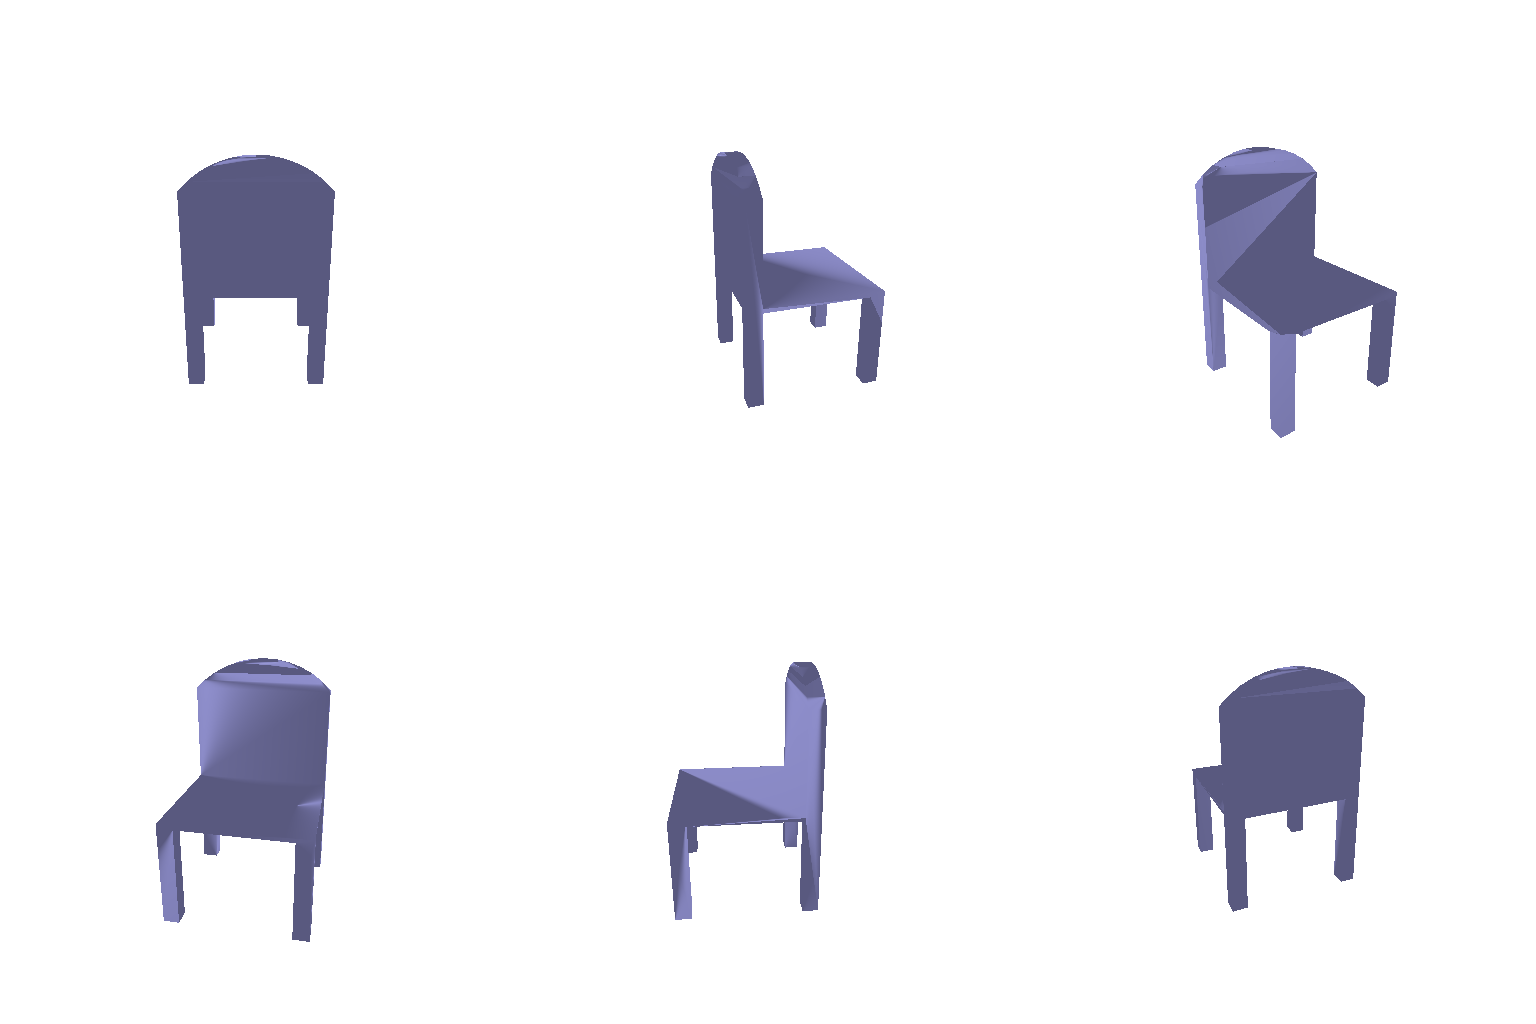
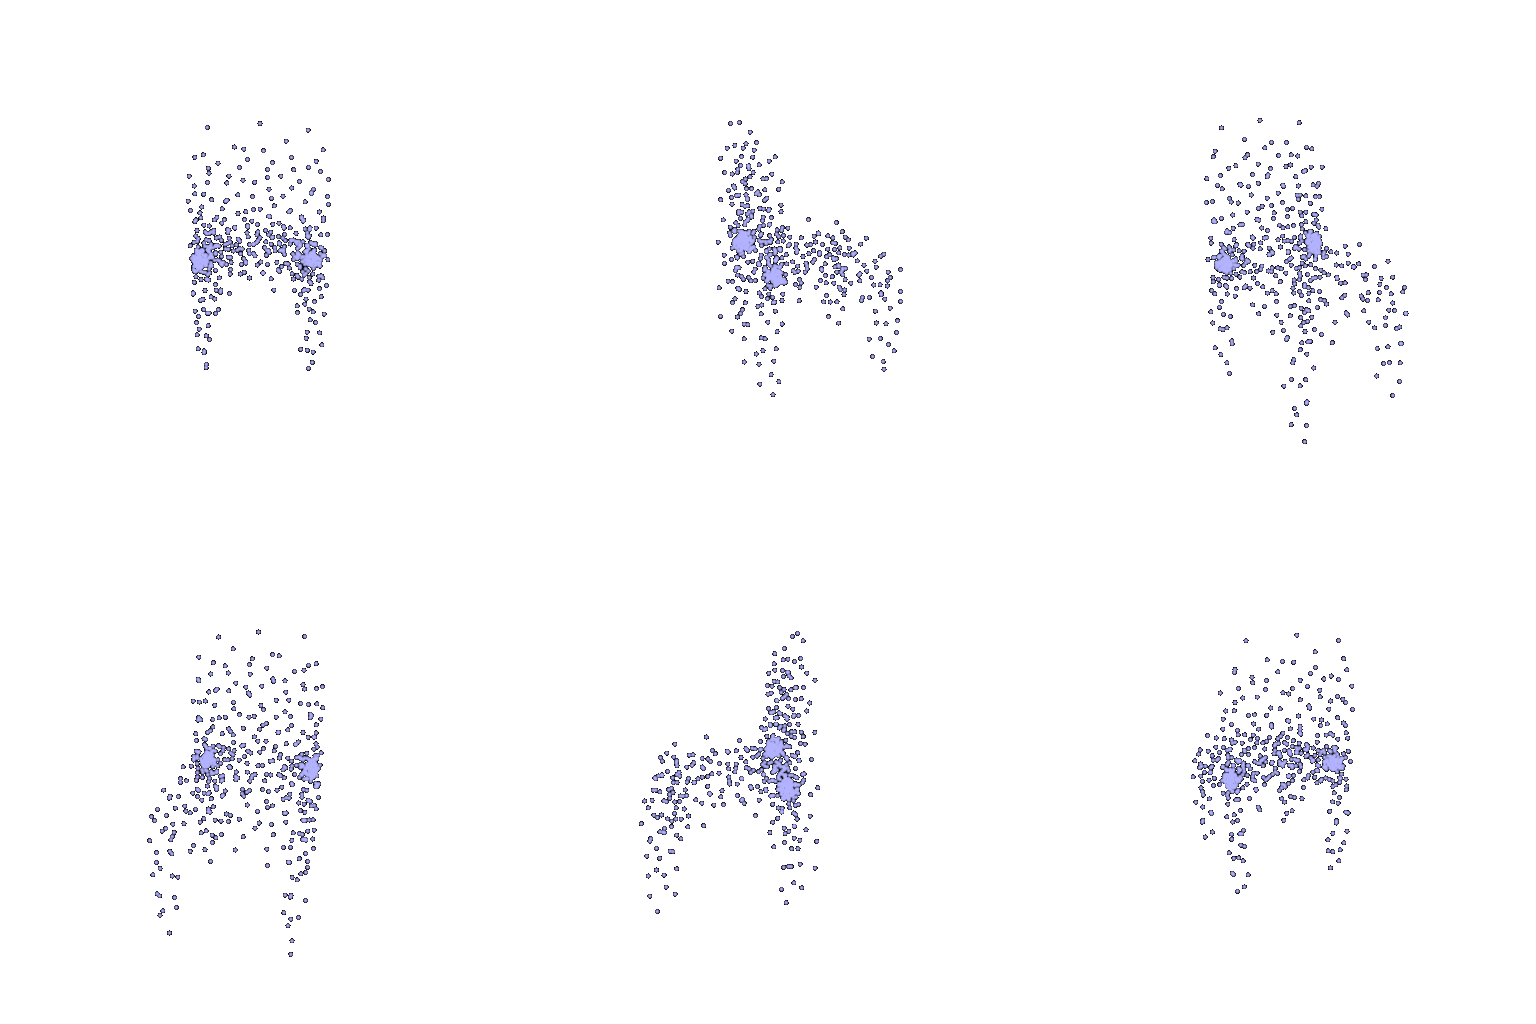
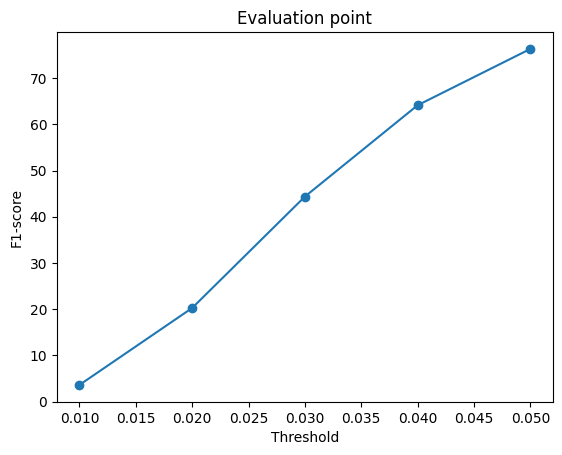
F1@0.05: 76.332
2.3 Image to Mesh
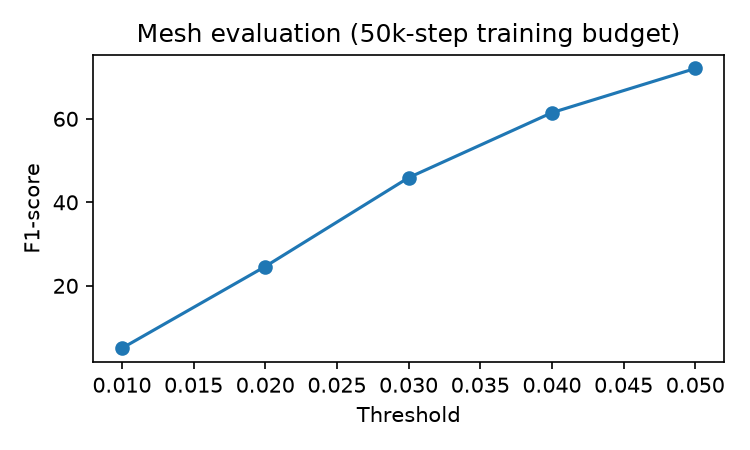
The mesh model used a 50,000-step training budget with w_smooth = 0.1.
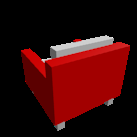

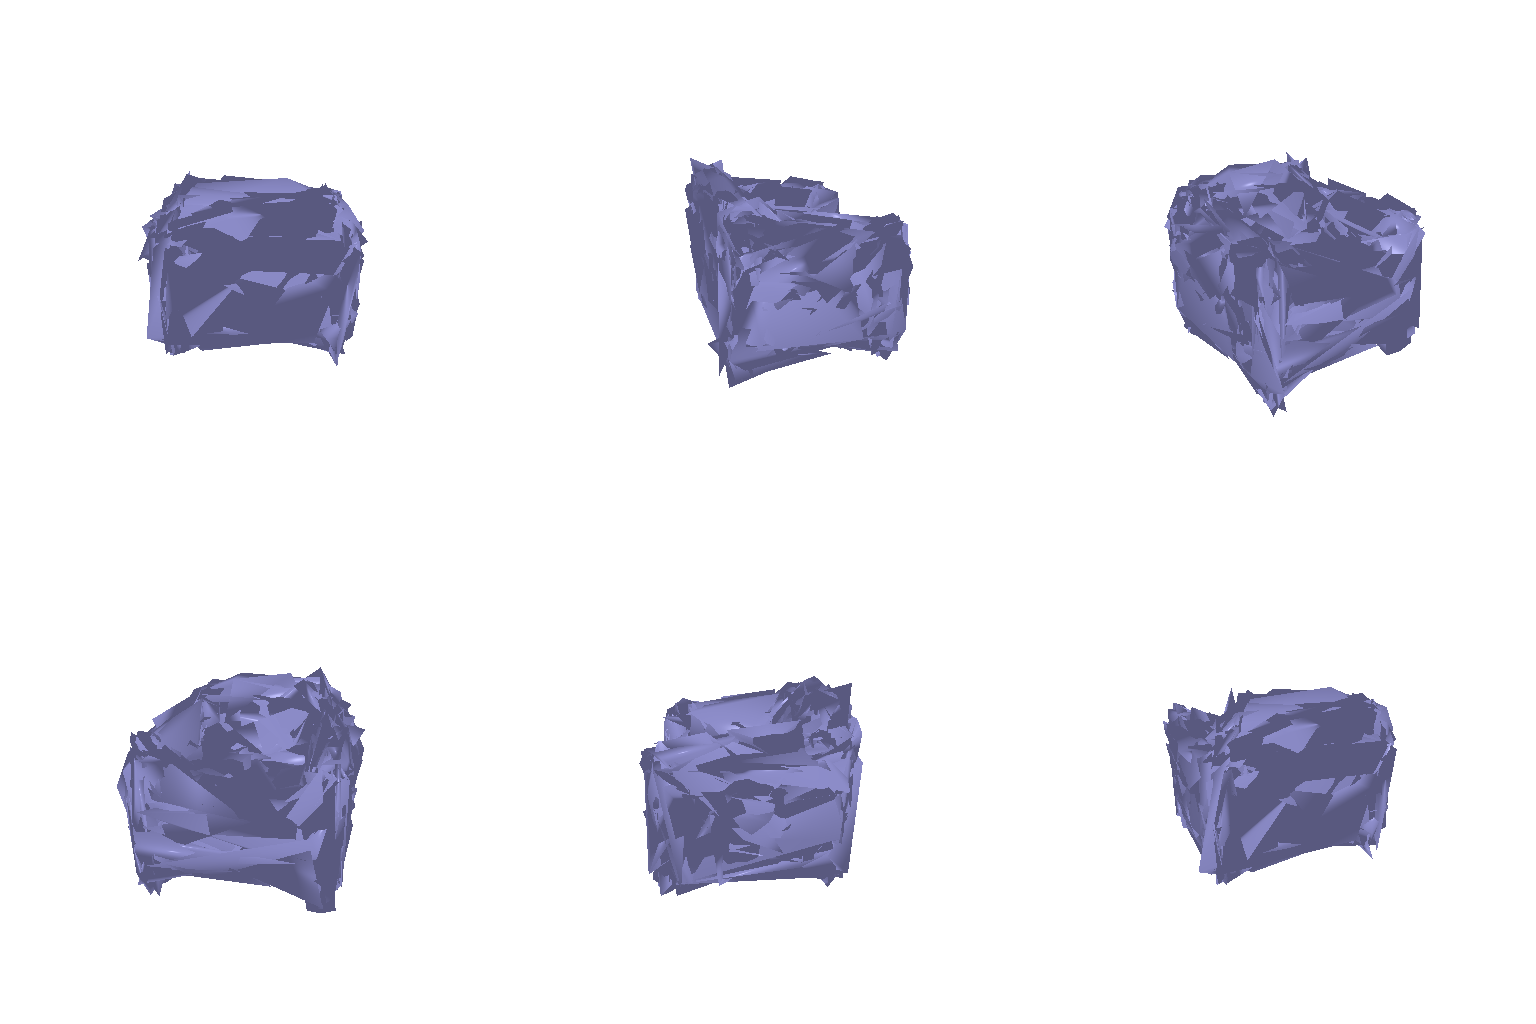
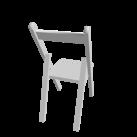

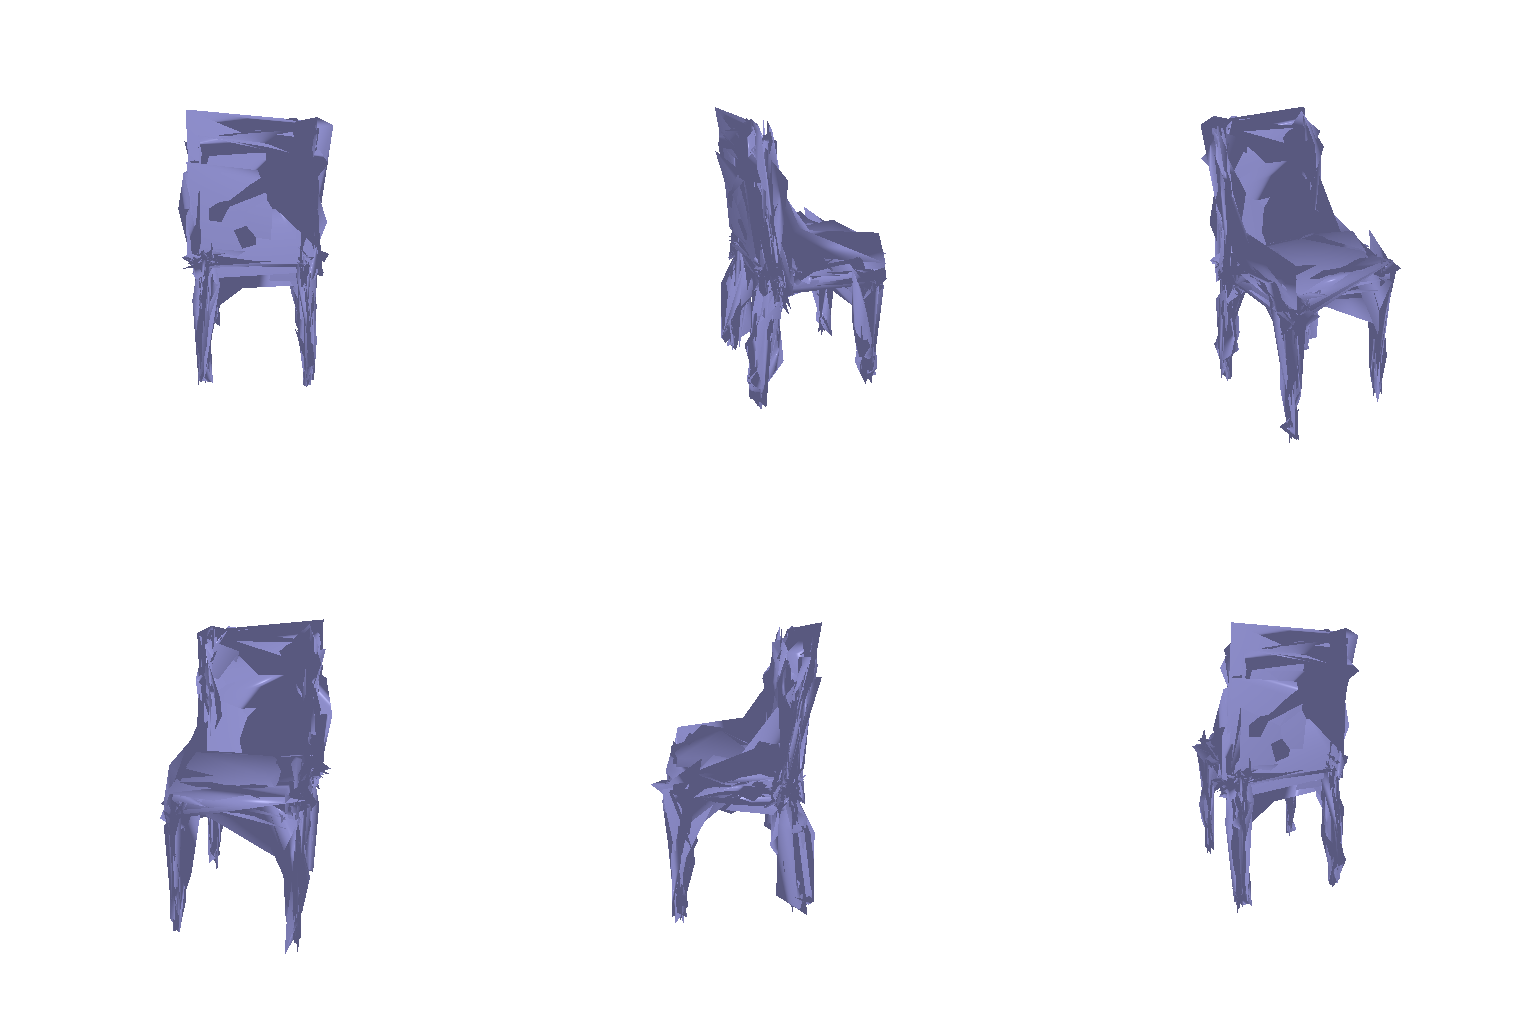
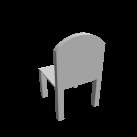

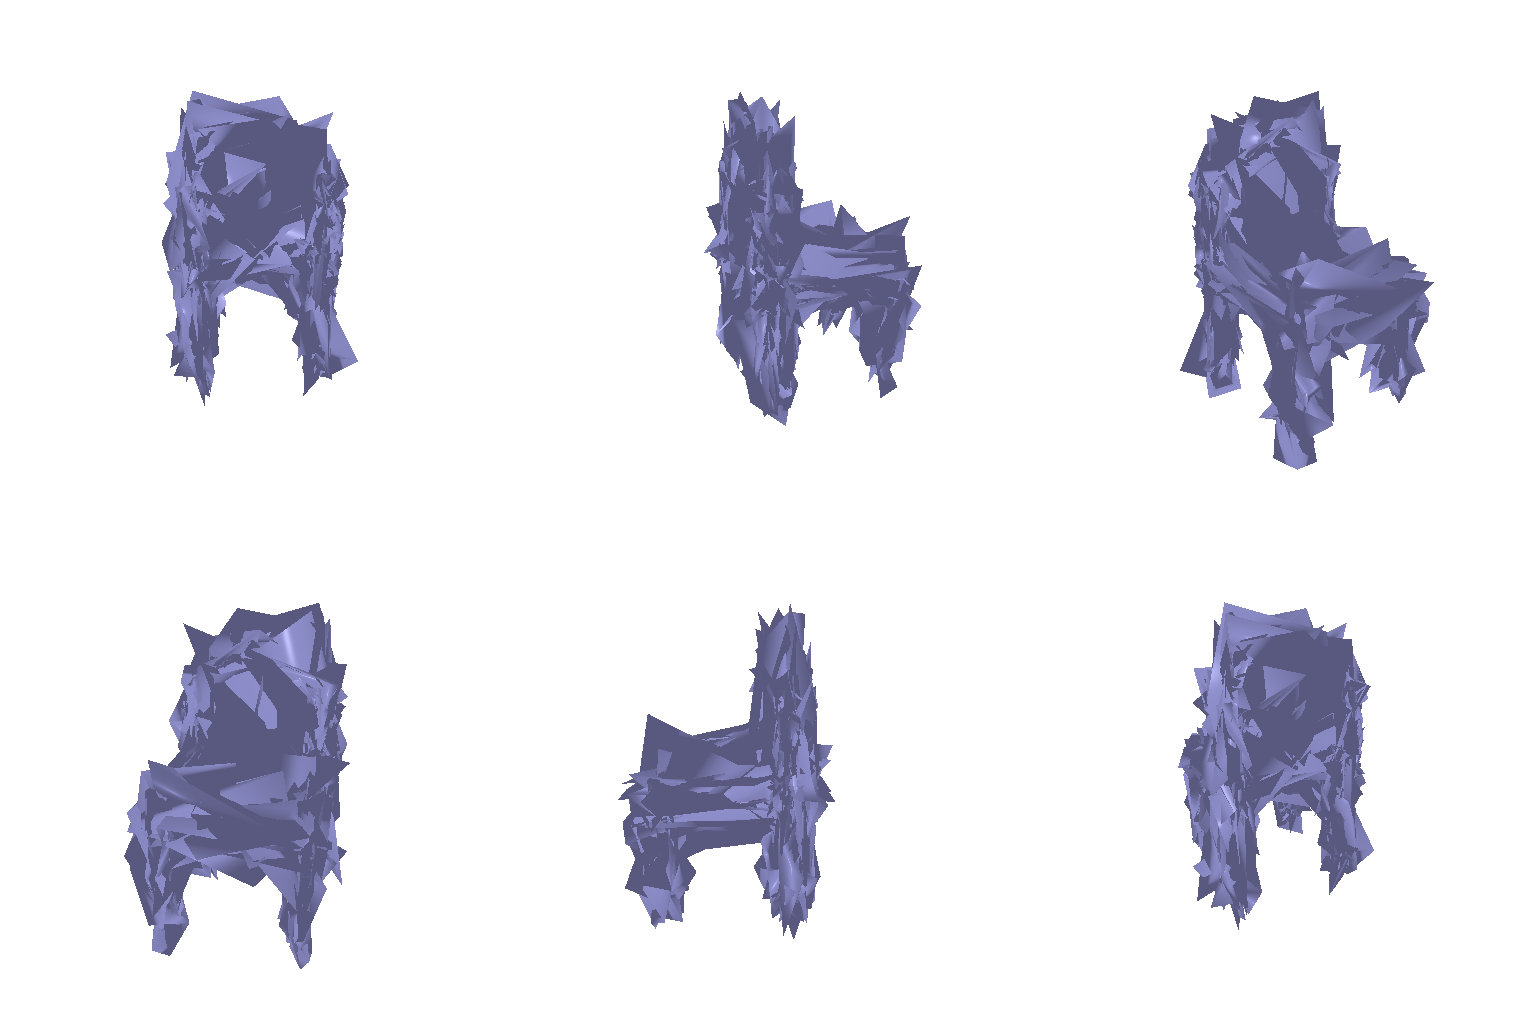
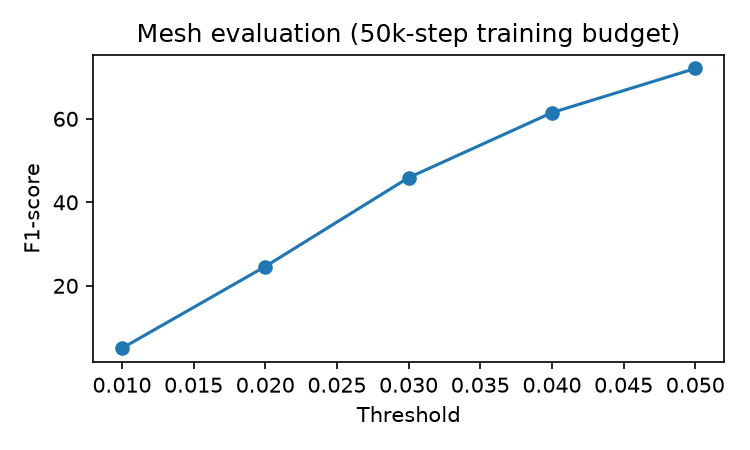
F1@0.05: 72.056
Comparing voxel vs. point cloud vs. mesh
| Representation | F1@0.05 |
|---|---|
| Voxel grid | 61.860 |
| Point cloud | 76.332 |
| Mesh | 72.056 |
Point cloud decoders regress coordinates directly with no structural prior, so they can place points freely and often score highest on F1; mesh decoders are constrained to deform a fixed template, so they struggle with thin structures like chair legs; voxel grids are limited by their fixed resolution and need marching cubes to extract a surface, which can lose fine detail.
2.4 Analyse Effects of Hyperparameter Variations
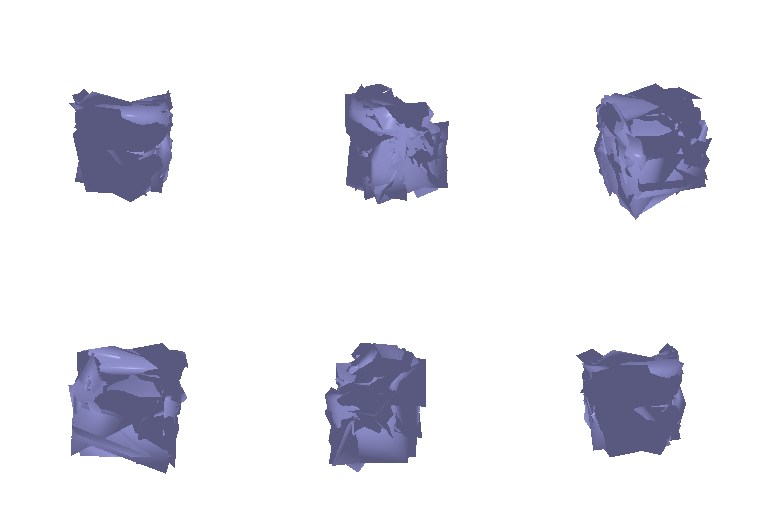
Varied the mesh decoder's Laplacian smoothness weight across {0.1, 1.0, 10.0}


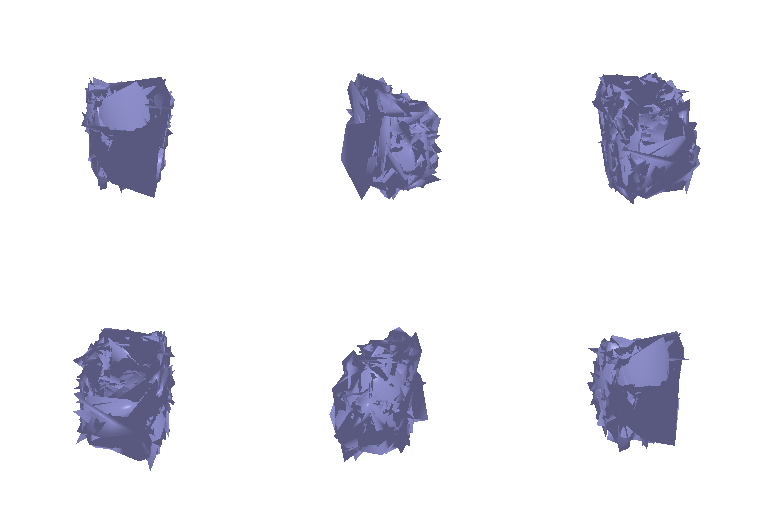

| w_smooth | Training budget (steps) | F1@0.05 |
|---|---|---|
| 0.1 | 50,000 | 72.056 |
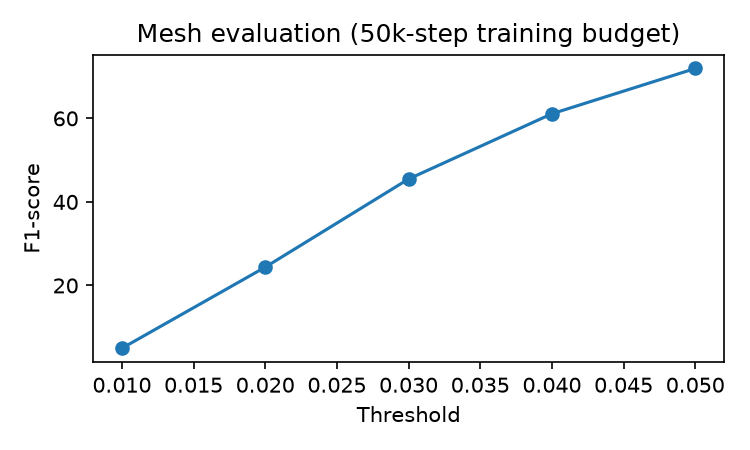
| 1.0 | 50,000 | 71.941 |
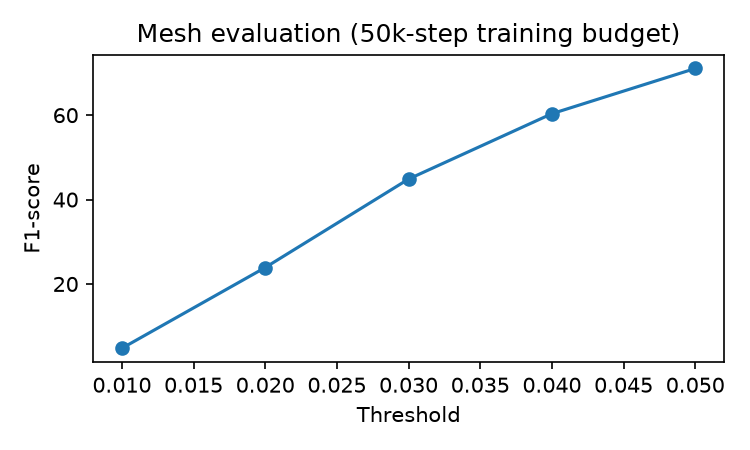
| 10.0 | 50,000 | 71.056 |
With a 50,000-step training budget, all models were evaluated on the same 678 chairs using matching views and sampling seeds. Weight 0.1 gives the best F1 (72.056), but only slightly exceeds 1.0 (71.941); weight 10.0 scores lower (71.056).
All three GIFs still show jagged, folded-looking surfaces. Stronger smoothing does not clearly remove these artifacts, which F1 does not directly measure. One possible reason is that our Chamfer loss sums over 1,000 points, making the smoothness term relatively weak. Normalising Chamfer and retuning the weight may improve this balance.
2.5 Interpret Your Model
Error heatmap
Each predicted vertex is colored by its distance to the nearest ground-truth surface point (blue = close, red = far), to see which parts of the shape the model reconstructs well.
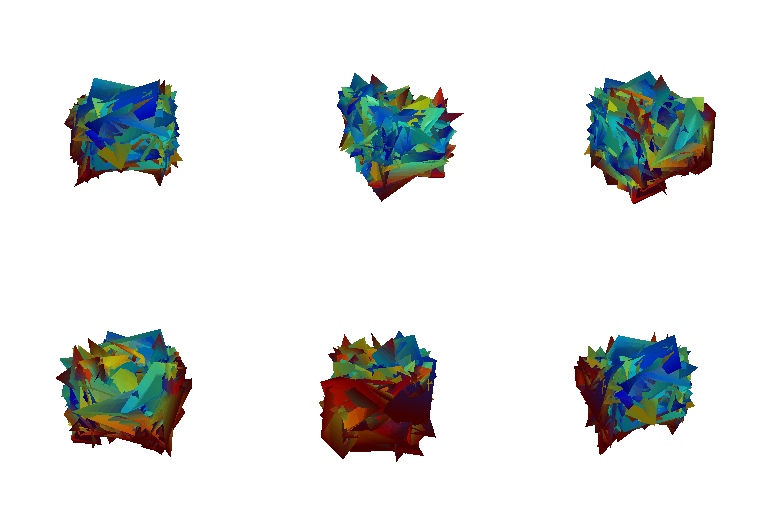
Errors concentrate at the tips of the mesh's spiky protrusions. The model gets the rough shape right but not surface smoothness, which is consistent with 2.4's finding that F1 doesn't reward smoothness.
Latent space interpolation
Linearly interpolating between two test images' encoded feature vectors and decoding every step, to check whether the learned feature space is a smooth, meaningful shape manifold rather than a lookup table.
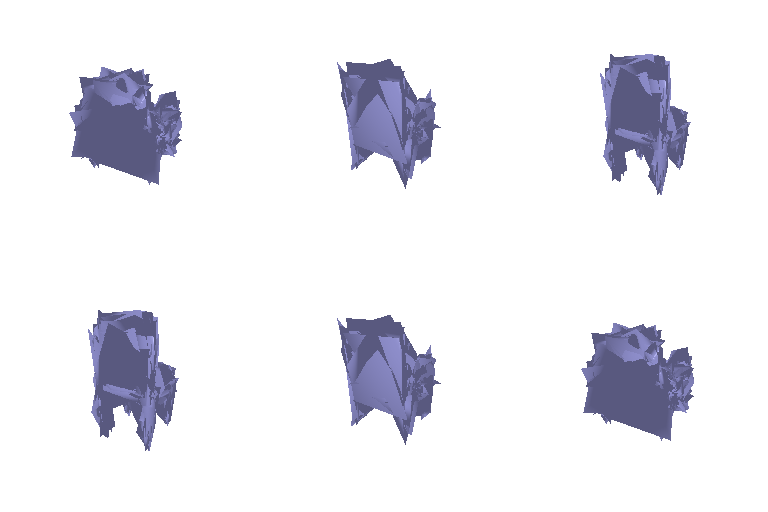
Every intermediate shape is spiky like the endpoints, but the mesh reshapes continuously. The feature space seems locally smooth even though individual decodes are noisy.
3.1 Implicit Network
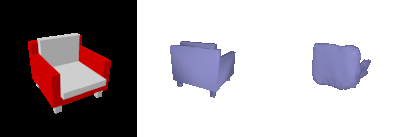
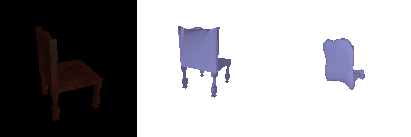
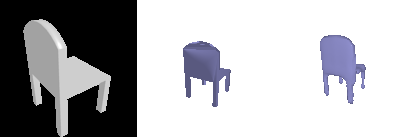
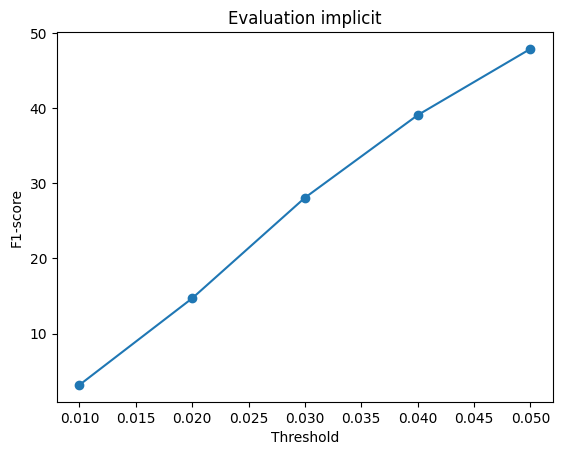
F1@0.05: 47.858. The decoder takes the 512-d image feature and a positionally encoded (x, y, z) query and outputs occupancy, and is queried on a 32×32×32 grid followed by marching cubes. It scores below the voxel decoder (61.860): a single global feature has to specify occupancy at every location through a small MLP, which may give blurrier occupancy boundaries than a decoder that outputs the grid directly.
3.3 Extended Dataset Training
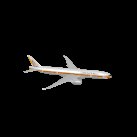
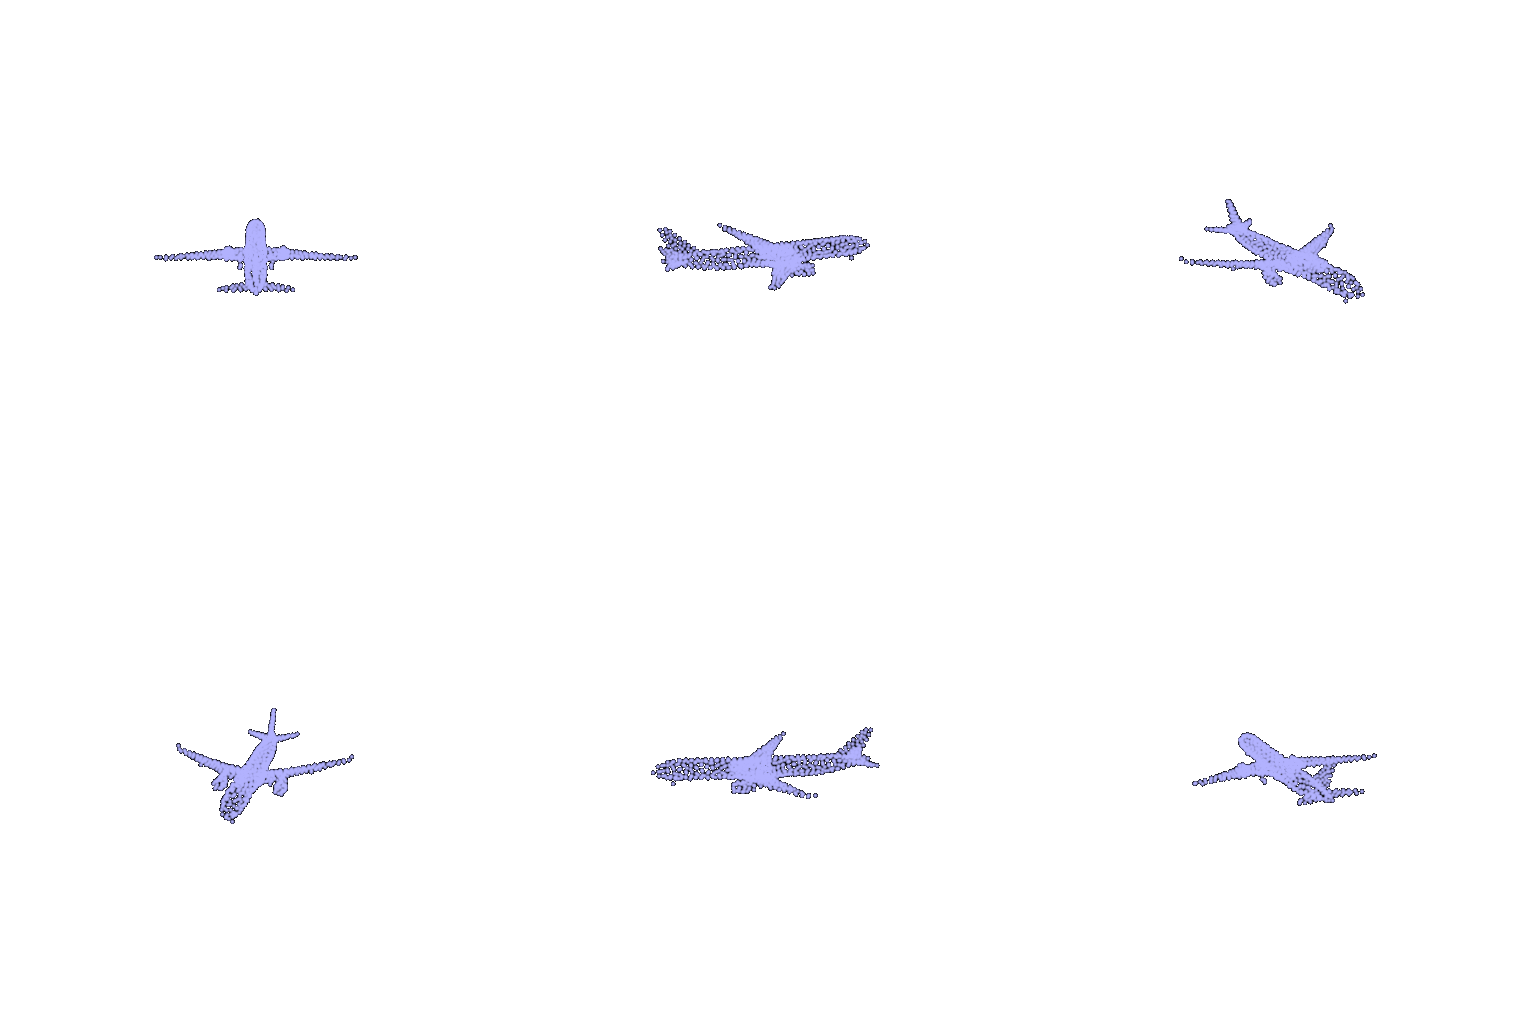
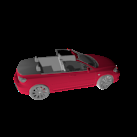
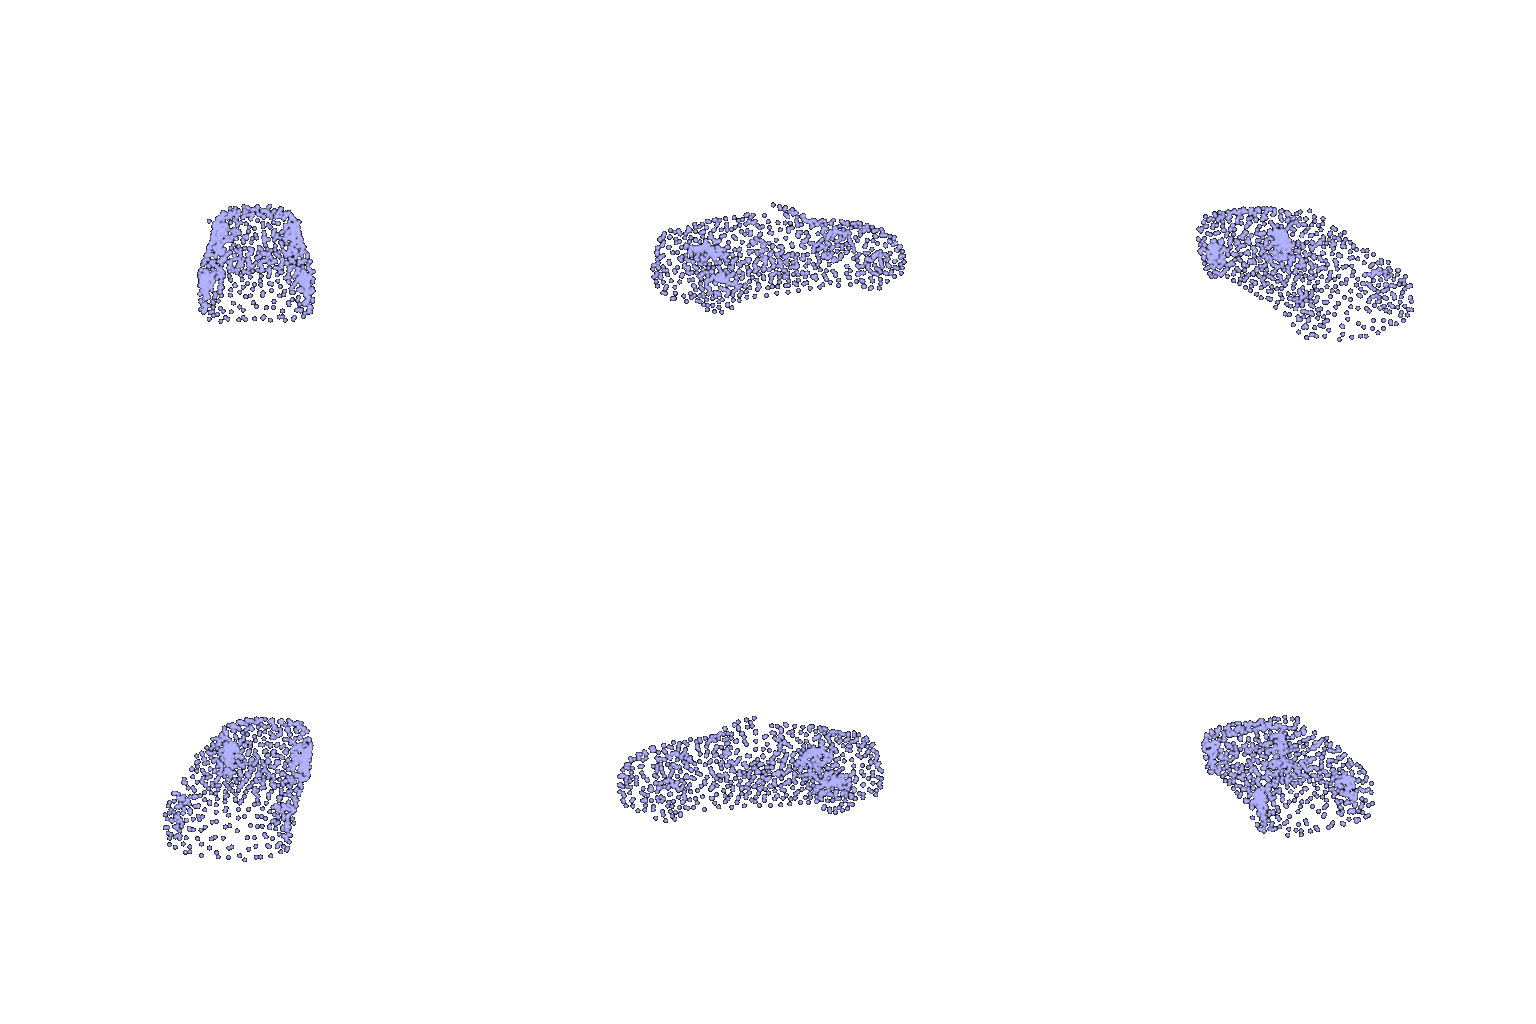
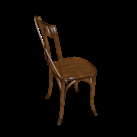
Point-cloud model trained on chair + car + plane (30k iterations, same architecture as 2.2) versus the chair-only model, both evaluated on the same 3-class test images (one fixed view per model).






| F1@0.05 | Plane | Car | Chair | All |
|---|---|---|---|---|
| Trained on 3 classes | 94.08 | 92.24 | 76.70 | 85.49 |
| Trained on chairs only | 48.78 | 61.92 | 77.11 | 65.35 |
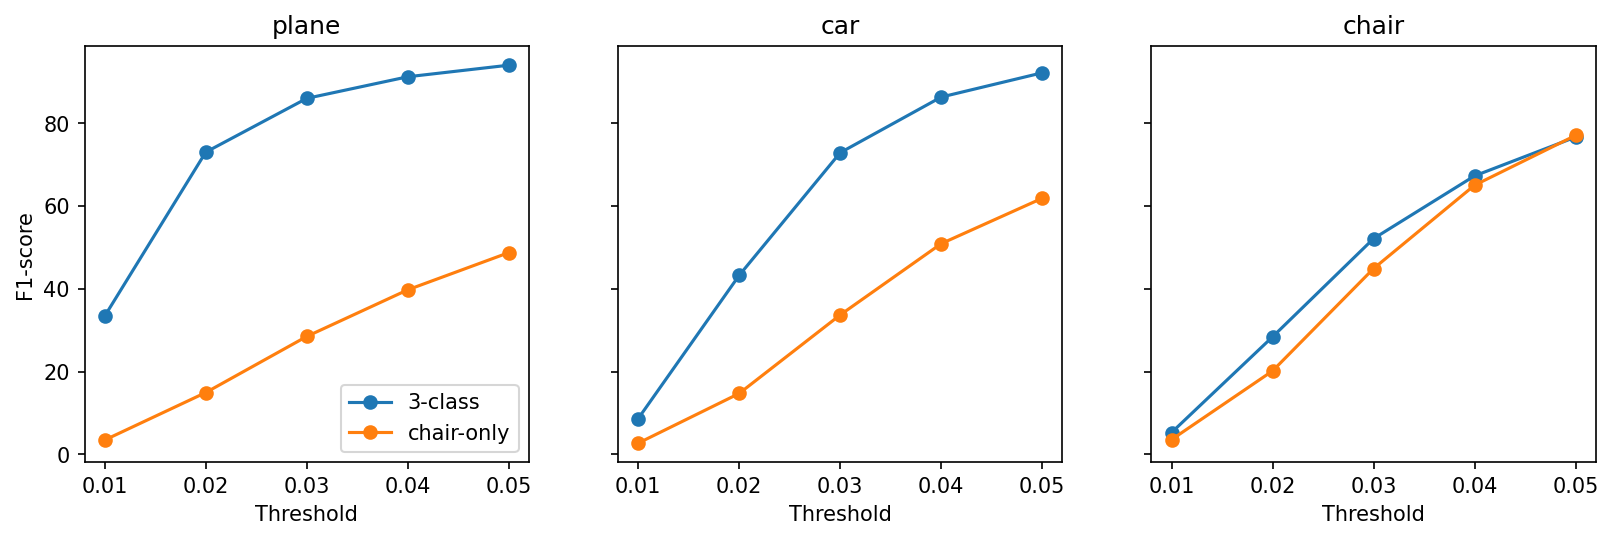
On chairs the two models are indistinguishable (76.70 vs. 77.11), so training on three classes did not hurt the chair class or help it. The chair-only model still gets some points near planes and cars but produces a chair-like blob instead of the right shape, while the 3-class model recovers wings and car bodies clearly.
3D consistency and diversity (chairs)
Consistency: the same test chair is fed from 4 different views and the predictions are compared with each other (mean pairwise Chamfer distance, ×100, lower = more consistent).
Diversity: mean Chamfer distance between the predictions of 1000 random pairs of different chairs; the ground-truth chairs have 7.73.
| Chairs | Cross-view inconsistency (lower is better) | Diversity (GT = 7.73) | Chamfer to GT (lower is better) |
|---|---|---|---|
| Trained on 3 classes | 2.33 | 5.24 | 3.79 |
| Trained on chairs only | 2.26 | 3.69 | 3.84 |
Consistency and the distance to the ground truth are essentially the same for both models. The difference is diversity: both models output less varied chairs than the real ones, they drift toward an average chair, but the three-class model is noticeably closer to the ground truth (5.24 vs. 3.69).